Czech J. Genet. Plant Breed., 49, 2013 (1): 36–47
Comparing the Efficiency of Sampling Strategies to Establish a Representative in the Phenotypic-based Genetic Diversity Core Collection of Orchardgrass (Dactylis glomerata L.) Marcin STUDNICKI 1, Wiesław MĄDRY 1 and Jan SCHMIDT 2 1
Department of Experimental Design and Bioinformatics, Faculty of Agriculture and Biology, Warsaw University of Life Sciences – SGGW, Warsaw, Poland; 2Botanical Garden, Plant Breeding and Acclimatization Institute – National Research Institute, Bydgoszcz, Poland
Abstract Studnicki M., Mądry W., Schmidt J. (2013): Comparing the efficiency of sampling strategies to establish a representative in the phenotypic-based genetic diversity core collection of orchardgrass (Dactylis glomerata L.). Czech J. Genet. Plant Breed., 49: 36–47. Establishing a core collection that represents the genetic diversity of the entire collection with a minimum loss of its original diversity and minimal redundancies is an important problem for gene bank curators and crop breeders. In this paper, we assess the representativeness of the original genetic diversity in core collections consisting of one-tenth of the entire collection obtained according to 23 sampling strategies. The study was performed using the Polish orchardgrass Dactylis glomerata L. germplasm collection as a model. The representativeness of the core collections was validated by the difference of means (MD%) and difference of mean squared Euclidean ‒ distance (d D%) for the studied traits in the core subsets and the entire collection. In this way, we compared the efficiency of a simple random and 22 (20 cluster-based and 2 direct cluster-based) stratified sampling strategies. Each cluster-based stratified sampling strategy is a combination of 2 clusterings, 5 allocations and 2 methods of sampling in a group. We used the accession genotypic predicted values for 8 quantitative traits tested in field trials. A sampling strategy is considered more effective for establishing core collections if the means of the traits in a core are maintained at the same level as the means in the entire collection (i.e., the mean of MD% in the simulated samples is close to zero) and, simultaneously, when the overall variation in a core collection is ‒ greater than in the entire collection (i.e., the mean of d D% in the simulated samples is greater than that obtained for the simple random sampling strategy). Both cluster analyses (unweighted pair group method with arithmetic mean UPGMA and Ward) were similarly useful in constructing those sampling strategies capable of establishing representative core collections. Among the allocation methods that are relatively most useful for constructing efficient samplings were proportional and D2 (including variation). Within the Ward clusters, the random sampling was better than the cluster-based sampling, but not within the UPGMA clusters. Keywords: core collection; genetic diversity; germplasm collection; orchardgrass; phenotypic variation; representativeness; sampling strategies
Plant germplasm collections facilitate the conservation of the genetic diversity available in the genetic resources of a crop species before that 36
diversity is lost as a result of landrace replacement by high-yielding cultivars under high input cropping and farming systems (Yan et al. 2007).
Czech J. Genet. Plant Breed., 49, 2013 (1): 36–47 Currently, many germplasm collections are so large as to interfere with achieving the main goals for which the collections have been established, i.e., the collection, maintenance, evaluation and utilisation of the genetic diversity of crop species and their relatives. The large size of collections is the main reason for the poor use of germplasms and the unavailability of information on the traits of economic importance that would enable breeders to choose parents for use in breeding programs (van Hintum et al. 2000; Yan et al. 2007; Upadhyaya et al. 2009). To overcome size-related problems Frankel (1984), Frankel and Brown (1984) and Brown (1989a, b, 1995) introduced a core collection. A core collection is defined by these authors as a sample of accessions that represent, with the lowest possible level of redundancy, the genetic diversity (i.e., the richness of gene or genotype categories) of the entire collection (Frankel 1984; Brown 1989a; Brown & Spillane 1999). This definition also includes the core collection representativeness of genetic diversity maintained in the entire collection. The representativeness of a core collection could be considered its ability to capture most of the genetic diversity in the entire collection with minimal redundancies (van Hintum et al. 2000; Franco et al. 2005, 2006). This situation occurs when a core collection reflects its genetic variation with the minimum loss of the original genetic diversity and minimal redundancies. This definition is required from the conservation and plant breeding points-of-view (van Hintum et al. 1999, 2000; Marita et al. 2000; van Raamsdonk & Wijnker 2000; Malosetti & Abadie 2001; Jansen & van Hintum 2007; Pessoa-Filho et al. 2010). The published sizes of core collections range from 0.3 to 30% of the entire collection (Li et al. 2002; Franco et al. 2005; Logozzo et al. 2007; Wang et al. 2007; Ghamkhar et al. 2008; Liu et al. 2009) and are typically close to 10% (Brown 1989a, b; Spagnoletti Zeuli & Qualset 1993; Zewdie et al. 2004; Amalraj et al. 2006), depending on the species, the objective of the core collection, the strategy adopted and, most often, the size of the collection to be sampled (van Hintum et al. 2000). Establishing core collections requires specifying an appropriate sampling strategy (van Hintum et al. 1999, 2000; Xu et al. 2006). Several sampling strategies have been introduced to form a core collection. These strategies include simple random and stratified random and nonrandom sampling (Brown 1989a, b; Charmet &
Balfourier 1995; Grenier et al. 2000; Li et al. 2002; Upadhyaya et al. 2003, 2007, 2009; Xu et al. 2006) as well as more sophisticated sampling methods (Marita et al. 2000; Van Raamsdonk & Wijnker 2000; Chandra et al. 2002; Jansen & van Hintum 2007; Kim et al. 2007). This study compares the efficiency of simple random and twenty-two cluster-based stratified random sampling strategies to develop a core collection that is representative of the phenotypic-based genetic diversity. The tested core collections contained 10% of the accessions of the entire collection of the Polish orchardgrass Dactylis glomerata L. germplasm. To evaluate sampling strategies, we used the variation in the genotypic predicted values (Hu et al. 2000; Hartung & Piepho 2005; Wang et al. 2007) for 8 quantitative agro-morphological traits in the entire collection. Additionally, the global usefulness of statistical methods for constituting the effective sampling strategies was compared. MATERIAL AND METHODS The entire germplasm collection and its phenotypic evaluation. Orchardgrass (Dactylis glomerata L.) is one of the most important cool-season perennial forage grasses and is native to northern Africa, western and central Europe and temperate and tropic Asia. This crop species is adapted to a wide range of environments and is therefore widely cultivated around the world (Casler et al. 2000; Xie et al. 2010). The Polish germplasm collection of orchardgrass (approximately 4000 accessions) is maintained at the Botanical Garden of Plant Breeding and Acclimatisation Institute in Bydgoszcz, Poland. This germplasm collection includes predominantly wild accessions collected during many expeditions mainly across Poland and entries such as cultivars, landraces and advanced breeding clones originating from Poland and various countries around the world. Therefore, effective methods for constituting a core collection are necessary to improve its functioning, i.e., effective characterising, evaluating, serving and conserving. In this study, the entire germplasm collection used to establish core collections by the sampling strategies consists of 1971 orchardgrass accessions that originated from 19 countries. Over 88% of the orchardgrass accessions originated from Poland. The accessions chosen for this study are both 37
Czech J. Genet. Plant Breed., 49, 2013 (1): 36–47 wild and cultivated, and they cover approximately 50% of the total genetic resources of this crop held at the Botanical Garden of Plant Breeding and Acclimatisation Institute in Bydgoszcz, Poland. The number of accessions was limited by the availability of the data regarding the 8 important agro-morphological traits recorded according to the Forage Grass Descriptors (IBPGR 1985). The accessions were assessed in the field trials located at the Botanical Garden of Plant Breeding and Acclimatisation Institute in Bydgoszcz, Poland (53.174°N, 18.046°E) between 1978 and 1985. In successive years, the set of tested accessions changed almost completely, and only a few standard cultivars remained the same. When considering test years as incomplete blocks, this experimental plan is equivalent to an augmented design offered and used commonly in field incomplete block designs (Federer 1956; Federer et al. 2001; Upadhyaya et al. 2009). On a yearly basis, each accession was observed on 10 plants within a 1 m 2 plot for 8 quantitative agro-morphological traits, including the plant height (cm), inflorescence length (cm), leaf length (cm), leaf width (cm), total seasonal yield (kg), 1000 kernel weight (g), number of days since the 1 st of April until the inflorescence emergence and the number of days since the 1 st of April to the inflorescence. Predicted genotypic values for accessions in the germplasm collection. To predict the genotypic means across years for each trait in the entire collection, a two-step analysis of the data in the two-way (accessions × years) incomplete classification was used. In the first step, predictions of the genotypic effects were obtained using the best linear unbiased predictor (BLUP) in the residual maximum likelihood (REML) approach based on a mixed linear model as follows (Federer et al. 2001; Hartung & Piepho 2005; Piepho & Möhring 2005; Upadhyaya et al. 2007): yij = m + gi + rj + eij where: yij – trait response of the i-th accession in the j-th year m – general mean gi – random genotypic effect of the i-th accession rj – fixed effect of the j-th year eij – residual random effect that includes both the GE (accession × year) interaction effect and the experimental error
38
In the second step of the analysis, the genotypic predicted values (Hu et al. 2000; Li et al. 2004; Xu et al. 2006; Wang et al. 2007) were obtained using the following formula: m^ i = m^ + ^g i where: m^ i – predicted genotypic value (by BLUP) of the i-th accession ^ m – estimate of general mean ^ g i – genotypic effect (obtained using BLUP) of the i-th accession
The genotypic predicted values for all of the assessed accessions for each of the studied traits were employed to calculate the means and squared Euclidean distances among the accessions in the entire collection, their homogenous groups and the established core subsets (Xu et al. 2006). Sampling strategies. Twenty-three various sampling strategies were used in this study, including the simple random method and twenty-two cluster-based stratified sampling strategies. Twenty of these strategies are a combination of three statistical methods used commonly to construct the stratified samplings. These combinations comprised two cluster analysis methods, five sample allocation methods and two sampling methods in a group (Li et al. 2002; Xu et al. 2006; Liu et al. 2009). The remaining two are direct cluster-based sampling strategies (van Hintum et al. 2000; Zewdie et al. 2004). The first step of the cluster-based stratified sampling strategy in developing core collections is stratification (grouping and classification). We used two of the most commonly used methods of hierarchical cluster analysis: the unweighted pairgrouping method with arithmetic means (UPGMA) and Ward’s method (Crossa et al. 1995; Malosetti & Abadie 2001; Franco et al. 2005; Reddy et al. 2005; Amalraj et al. 2006). These methods use the squared Euclidean distance for the important principal components (PCs) obtained from a PCA analysis performed on the standardised genotypic predicted values of the phenotypic traits. The eigenvalue of the PCs was used as a criterion to determine how many PCs should be utilised in the cluster analysis. The PCs with an eigenvalue >1.0 were considered when determining the agromorphological variation in the entire collection (Kaiser 1960), and these PCs were used for the clustering. These clustering methods involve
Czech J. Genet. Plant Breed., 49, 2013 (1): 36–47 dividing the entire collection into a reasonable number of homogeneous groups, after which the accessions within each group could be selected. In the clustering methods, the group numbers were determined using the R 2 (i.e., the squared multiple correlation). The dendrogram was cut when the fusion of groups was performed at the R2 level approaching 0.75 (Upadhyaya et al. 2003; SAS 2004). The second step in developing the core collections was the allocation, i.e., determining the number of entries from each cluster (group) included in a core collection. Five allocation methods were used. Two of these methods proposed by Brown (1989a), based on the group size, are commonly known as the proportional (Pro) and logarithmic (Log) methods. The proportional method allocates n t accessions from the t-th group in proportion to the number of accessions in the group N t and is calculated using the following formula:
where: n – size of a core collection (i.e., accession number, sample size), calculated as the product of the entire collection size and the sample fraction (a core collection fraction) g – number of groups obtained in the cluster analysis
The logarithmic method uses the proportion of the logarithm of the accession numbers in the groups. The number of accessions allocated from the t-th group n t is represented by
Commonly in sample allocation, the genetic variation within a group is considered when information on that variation is available (Neyman 1934; Spagnoletti Zeuli & Qualset 1993; Brown 1995; Diwan et al. 1995; Franco et al. 2005). Diwan et al. (1995) and Franco et al. (2005, 2006) observed that when the genetic variation in the different groups was considered in their sample allocation methods, more representative core collections were generated than in the common allocation methods. Franco et al. (2005) proposed three allocation methods for determining the number of accessions taken from a group
based on the mean of the Gower’s distance between the accessions within the group. In this study, instead of Gower’s distance, the squared Euclidean distance was employed to measure the genetic variation (dissimilarities) among the accessions within the group. The squared Euclidean distances were based on the standardised estimates of the predicted genotypic values of the accessions for the studied traits (Xu et al. 2006). The respective allocation methods suggested by Franco et al. (2005) are termed D 1, D 2 and D 3. The first allocation method, D1, indicates that the size of the sample to be drawn from each group should be proportional to the mean squared Euclidean distance between the accessions within that group. The number of accessions n t to be drawn from the t-th group is
where: dt – mean squared Euclidean distance between the accessions within the t-th group
Methods D 2 and D 3 are modifications of Neyman’s (1934) method. In the D2 allocation method, the number of accessions n t from the t-th group is calculated using the formula that includes the size of the t-th group N t as weighted by the mean squared Euclidean distance d t as follows:
The D 3 method allocates the number of accessions per group into the logarithm of the number of accessions in the t-th group N t and is weighted by the mean squared Euclidean distance dt as follows:
The idea of the last three allocation methods is similar to the method proposed by Jansen and van Hintum (2007). According to methods D1, D2 and D3, more diverse groups with more numerous subsets will be selected. The third and final step of the stratified sample strategies is the selection of the n t number. Two sampling methods were used: random and clus39
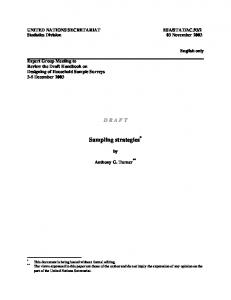
Czech J. Genet. Plant Breed., 49, 2013 (1): 36–47 tered (Li et al. 2002; Zewdie et al. 2004; Liu et al. 2009). The random sampling method was based on a simple random sample of accessions in each group (van Hintum et al. 2000). The clustered sampling method is a non-random (restrictedrandom) sampling method that involves dividing the accessions in each group into homogeneous subgroups with a cluster analysis, using the same method that provided the groups in the entire collection. The number of subgroups for a group was specified in an allocation method and was equal to the n t number of accessions from this group that were selected to a core. From each subgroup that contained more accessions, only one was randomly selected to a core subset; from each one-entry subgroup, only this accession was selected (van Hintum et al. 2000; Zewdie et al. 2004; Liu et al. 2009). For the two direct cluster-based sampling strategies using the Ward and UPGMA cluster analyses, the accessions in the entire collection were divided into as many homogeneous groups as the size of a core collection, denoted by n. For the simple random sampling strategy, the accession subset of size n was selected from the entire collection using random selection without replacement. A schematic of the twenty-three assessed sampling strategies showing their construction is presented in Figure 1.
Size of the core collections. Brown (1989a, b), Spagnoletti Zeuli and Qualset (1993), Li et al. (2002), Zewdie et al. (2004), Reddy et al. (2005) and Yan et al. (2007) suggested that a 10% fraction of the accessions from entire collection would be an acceptable size for the core collections. In this study, each sampling strategy resulted in the core collection containing 197 accessions of orchardgrass. Efficiency evaluation of sampling strategies by validating the representativeness of the resulted core collections. Ten thousand independent samples (core collections) were obtained by computer simulations from the entire collection of orchardgrass using each of the studied sampling strategies (van Hintum et al. 1995; Chandra et al. 2002; Franco et al. 2005). These simulations provided reliable results and allowed drawing accurate conclusions regarding the true efficiency of the sampling strategies. The efficiency evaluation of a sampling strategy involved validating the representativeness of the obtained core collection (Hu et al. 2000; Li et al. 2004; Wang et al. 2007; Oliveira et al. 2010). The representativeness of the original genetic diversity in the core collections was validated using the difference of means and a multivariate variation measure of traits in the core subsets and the entire collection (Li et al. 2004, 2005; Franco et al. 2005; Kim et al. 2007;
Sampling strategies
Stratified sampling
Non group
Ward
Random Restricted sampling random sampling Simple random sampling
Direct clustered sampling
UPGM
Random sampling
Restricted random sampling
PRO LOG D1 D2 D3 PRO LOG D1 D2 D3 PRO LOG D1 D2 D3 PRO LOG D1 D2 D3
Direct clustered sampling
Figure 1. A schematic of the sampling strategies used for constructing core collections from the Polish orchardgrass germplasm collection 40
Czech J. Genet. Plant Breed., 49, 2013 (1): 36–47 Oliveira et al. 2010). The respective differences of the mean and variation measured in the simulated core collections and the entire collection can be described using the following two statistical parameters based on the predicted genotypic values of the quantitative traits in accessions: (a) the difference between the means in a core collection and the entire collection, relative to those in the entire collection across all traits (Kim et al. 2007),
where: ‒x – mean of the τ-th trait (τ = 1, 2, …, p) in a core colCτ lection ‒x – mean of the τ-th trait in the entire collection Eτ
(b) the difference between the mean squared Euclidean distance among accessions in a core and in the entire collection, relative to that in the entire collection,
where: ‒ d Cτ – mean squared Euclidean distance among accessions in a core collection ‒ d Eτ – mean squared Euclidean distance among accessions in the entire collection
The use of both statistical parameters (MD% and ‒ dD%) to compare the efficiency of sampling strategies permits the identification of core collections without losing genetic diversity and without too ‒ many duplicates. The means of MD% and d D% parameters were calculated for 10 000 simulated samples using each sampling strategy. A sampling strategy could be considered to be more effective in establishing a representative core subset of genetic diversity in the entire collection if the means of the traits in the cores and the entire collection were maintained at the same level (i.e., the mean MD% of the simulated samples was close to zero) and, simultaneously, when the overall variation in a core subset was greater than that in the entire ‒ collection (i.e., the mean dD% across the results of the simulated samples was greater relative to that obtained for the simple random sampling strategy) (Hu et al. 2000; Li et al. 2004, 2005; Franco et al. 2005; Oliveira et al. 2010). The explanation for
this logic could be the following: the mean MD% for simulated core collections being close to zero indicates that, within a core subset, a minimum loss of the original diversity occurred; however, ‒ the mean d D% across the results of the simulated core subsets being greater relative to that obtained for the simple random sampling strategy indicates that the frequency distribution in a core subset is more similar to a uniform distribution compared to that of the entire collection. Therefore, the implication is that most of the redundancies (duplicates) present in the entire collection were not retained in the core collection. Computations and software used. The MIXED and CLUSTER procedures of SAS were used to estimate the best linear unbiased predictors (BLUPs) for the random effects of the mixed linear model for the augmented design and to perform the twocluster analysis methods (SAS Institute Inc. 2004). The simulations of the samples (core collections) from the orchardgrass germplasm collection using the respective sampling strategies were performed using software written in the R programming language (R Development Core Team 2010). The random sampling without replacement was performed using the SELECT procedure of the R software. RESULTS AND DISCUSSION Summary of variation in the entire collection Almost 2000 accessions in the orchardgrass germplasm collection showed substantial genotypic variation for the aboveground biomass yield per unit area and its components, i.e. the total seasonal yield (standard deviation of the predicted genotypic values, SD = 33%), plant height (SD = 24.5%), inflorescence length (SD = 16.7%) and 1000 kernel weight (SD = 14.2%). Two traits of leaf morphology (i.e., leaf length and width) and two phenological traits (i.e., number of days to inflorescence emergence and inflorescence) showed relatively small variation; their standard deviations ranged between 1.2% and 3.6% (Table 1). Stratification of accessions in the entire collection The stratification of the entire collection was performed using the UPGMA and Ward’s clustering 41
Czech J. Genet. Plant Breed., 49, 2013 (1): 36–47 Table 1. Summary statistics for the 8 quantitative agro-morphological traits recorded in the studied orchardgrass germplasm collection Traits
Mean
SD
CV (%)
Plant height (cm)
60.44
14.81
24.50
Inflorescence length (cm)
15.10
2.52
16.70
Leaf length (cm)
22.93
0.83
3.61
Leaf width (cm)
0.80
0.02
2.27
Total seasonal yield (kg per plot)
2.65
0.88
33.05
1.16
0.16
14.23
52.34
0.91
1.74
67.06
0.81
1.21
1000 kernel weight (g) st
Number of days to inflorescence emergence (since the 1 of April) st
Number of days to inflorescence (since the 1 of April) SD – standard deviation; CV – coefficient of variation
methods based on the squared Euclidean distance for four significant principal components (for which the eigenvalues were >1). In both clustering methods, the resulted dendrograms were cut at the R2 level equal to 0.75. This parameter indicates that the multivariate variation (as measured by the squared Euclidean distance) among the distinguished groups explained about one-thirds of the overall variation among the accessions. This criterion of clustering the whole population for sampling purposes would seem to be very reasonable because it guarantees that groups consist of relatively similar accessions. Stratification is the most effective method in establishing representative samples due to two conditions: the variation within groups is minimised and variation between groups is maximised (Cochran 1977; Diwan et al. 1995). The UPGMA and Ward’s methods enabled the division of the accessions in the entire collection into 10 and 5 groups, respectively. When using UPGMA method 10 homogenous groups were distinguished including those of a great number of accessions and of few ones. Ward’s method facilitated the stratification of the accessions in the entire collection into 5 groups that consisted of similarly numerous entries. The consequences of these stratifications by both clustering methods for efficiency of sampling strategies will be discussed in further stages of the study. Efficiency evaluation of sampling strategies Among the sampling strategies, considerable ‒ differentiation was identified mainly for the d D% 42
parameter, which denotes how much greater the variation in a core collection is than that in the entire collection (Table 2). The means of the parameter MD% were close to zero for the core collections established by all tested sampling strategies; they ranged from 0% to 1.11% in absolute values. How‒ ever, means of the d D% parameter were relatively large and differed, ranging from 16.92% to 27.83%, discriminating substantially between the studied sampling strategies. This result indicates that these sampling strategies permit the establishment of orchardgrass core collections, demonstrating different (better or worse) representativeness of genetic diversity in the entire collection. The means of both parameters, i.e., MD% and ‒ d D%, for simple random sampling were equal to zero and 18.72, respectively (Table 2). This result indicates that the mean of the τ-th quantitative trait (τ = 1, 2, …, p) x‒ Cτ in a core collection is the unbiased estimator of the finite population mean for this trait ‒xEτ in the entire collection of the sample means x‒ Cτ, calculated using a simple random sample of this population. Additionally, it indicates that the mean squared Euclidean distance among ‒ accessions in a core collection d Cτ is a biased esti‒ mator of the mean squared Euclidean distance dEτ among accessions in the entire collection (finite ‒ population) if the sample mean distance d Cτ is calculated on the basis of results obtained by a simple random sampling. Therefore, those core collections showing means of MD% close to zero ‒ and d D% greater than 18.72 could be considered to be representative of the genetic diversity of the entire collection and the respective sampling strategies would be considered effective. The com-
Czech J. Genet. Plant Breed., 49, 2013 (1): 36–47 binations of two allocation methods, Proportional and D2, with random sampling within a group and with both clustering methods were those sampling strategies that facilitated the establishment of orchardgrass, with those core collections showing a relatively good representativeness of the genetic diversity for phenotypic traits in the entire collection. However, both direct cluster-based sampling strategies were least effective in constructing core collections representative of the genetic diversity in the entire collection.
The core collections established using all of the samplings related to the UPGMA cluster analysis were characterised by smaller averages of MD% and ‒ d D% than for those related to Ward’s clustering procedure (Table 3). Additionally, the dispersion of the means of these parameters for the core collections within both groups of sampling strategies involved with each of the clustering methods was comparable (Table 2). This result indicates that, on average, both cluster analyses were similarly useful in constructing those sampling strategies
Table 2. The means of the parameters MD% and d‒D% calculated across the results of 10 000 simulated core collections from the orchardgrass germplasm collection established using the 23 sampling strategies No.
Sampling strategies cluster analysis method
1 3
D2
4 6
UPGMA
7 9
proportional
10 11
D1
12 13
D2
14 15 16
D3 logarithmic
8
Ward’s
17
D3 logarithmic
18 19
proportional
20
MD%
‒ dD%
random
0.03
17.79
clustered
–0.26
21.77
sampling in a group method
D1
2
5
allocation method
random
0.28
27.40
clustered
0.09
26.76
random
–0.26
17.74
clustered
–0.49
22.16
random
–0.14
17.77
clustered
–0.50
21.94
random
–0.10
25.40
clustered
–0.38
22.56
random
–1.09
27.77
clustered
–1.11
18.93
random
0.07
27.74
clustered
0.06
19.10
random
–0.89
27.83
clustered
–1.04
18.61
random
–1.10
26.94
clustered
–0.96
19.21
random
–0.02
26.71
clustered
–0.02
19.00
21
direct cluster-based sampling with UPGMA cluster analysis
0.02
19.57
22
direct cluster-based sampling with Ward cluster analysis
0.34
16.92
23
simple random sampling
0.00
18.72
In the D1 allocation method, the size of the sample from each group is proportional to the mean squared Euclidean distance within that group; in the D2 allocation method, the size of the sample from each group is proportional to the size of the group and group-mean squared Euclidean distance; in the D3 allocation method, the size of the sample from each group is proportional to the logarithm of the group size and the group-mean squared Euclidean distance; in the logarithmic allocation method, the size of the sample from each group is proportional to the logarithm of the group size; in the proportional allocation method, the size of the sample from each group is proportional to the group size
43
Czech J. Genet. Plant Breed., 49, 2013 (1): 36–47 capable of establishing the core collections that are representative of the genetic diversity in the entire collection of orchardgrass. The results of some studies have not shown a superiority of one of these clustering methods (i.e., UPGMA or Ward’s) in constructing effective sampling strategies (Hu et al. 2000; Wang et al. 2007). However, Xu et al. (2006) found that cotton core collections selected by samplings, including the UPGMA clustering method, showed better representativeness compared with samplings incorporating Ward’s clustering method. Franco et al. (2005, 2006) concluded that Ward’s cluster analysis method was more useful than the UPGMA method in developing sampling strategies that could effectively produce core collections representative of the genetic diversity of the entire collection. The core collections established by the sampling strategies related to the five allocation methods were characterised by considerably different ‒ averages of both MD% and d D% (Table 3). The averages of MD% for the core collections established by the samplings constructed using the D 2 and proportional allocation methods were close to zero. Conversely, the d‒ D% averages for these samplings were substantially greater compared to those average parameters regarding the three other allocation methods, i.e., Log, D 1 and D3. The averages of both parameters for the core collections with respect to the samplings with Log, D 1 and D 3 were very similar. The dispersion of these parameter means for the core collections within the five groups of sampling strategies involved with each allocation method was comparable. This result proves that two allocation methods, i.e.,
D2 and proportional, were the most useful (among the studied allocation methods) in constructing the sampling strategies that led to the maximum representativeness of the genetic diversity of the orchardgrass core collections. Franco et al. (2005, 2006) demonstrated that the allocation methods based only on the mean squared Euclidean distance (in the present study, D 1) could be considered the most useful in constructing effective sampling strategies among the compared allocation methods. Most researchers recognise that the proportional allocation methods are relatively the most useful in constructing effective sampling strategies to select the core collections that are representative of the genetic diversity (Diwan et al. 1995; van Hintum 2000; Malosetti & Abadie 2001; Oliveira et al. 2010). The core collections established using the sampling strategies related to both methods of sampling in a group were characterised by similar MD% ‒ (less than 0.5%) and different d D% averages (Ta‒ ble 3). The average d D% for the core collections established using the samplings constructed with random sampling in a group was greater than that obtained for clustered sampling. However, the ‒ mean d D% values for the core subsets established using the random sampling were greater than those for the cluster-based sampling within the Ward ‒ clusters (Table 2), while the mean d D% values for the core subsets established using both samplings within the UPGMA clusters were the opposite. Therefore, within the Ward clusters, the random sampling was better for constructing sampling strategies efficient in selecting representative core collections than the cluster-based sampling, but
Table 3. The averages of the parameters MD% and d‒D% calculated across those stratified sampling strategies related to each of the three statistical methods included in constructing these samplings MD%
‒ dD%
UPGMA Ward’s
–0.18 –0.61
22.13 23.18
D1
–0.61
21.57
D2
0.12
25.25
D3
–0.67
21.59
logarithmic
–0.68
21.47
proportional
–0.13
23.42
random sampling clustered sampling
–0.32 –0.46
24.31 21.01
Statistical methods Clustering method
Allocation method
Sampling in a group
44
Czech J. Genet. Plant Breed., 49, 2013 (1): 36–47 not within the UPGMA clusters. In many studies, the application of random sampling in a group was relatively most useful in constructing effective sampling strategies to establish representative core collections (Malosetti & Abadie 2001; Oliveira et al. 2010). However, Hu et al. (2000) demonstrated that clustered sampling within a group was more useful in establishing effective sampling strategies than other samplings. CONCLUSIONS (1) Combinations of both clustering methods with two allocation methods, i.e., proportional and D2, with random sampling in a group were the most effective sampling strategies in establishing a representative core collection of orchardgrass with regards to the phenotypicbased genetic diversity. (2) Both cluster analyses were similarly useful in establishing representative core collections. (3) The proportional and D 2 allocation methods were the most useful in selecting the core collections. (4) Within the Ward clusters, the random sampling was better than the cluster-based sampling, but not within the UPGMA clusters. Acknowledgements. The project was supported by National Science Centre of Poland, Project No. N N310 066339. References Amalraj V.A., Balakrishnan R., Jebadhas A.W., Balasundara N. (2006): Costituting a core collection of Saccharum spontaneum L. and comparison of three stratified random sampling procedures. Genetic Resources and Crop Evolution, 53: 1563–1572. Brown A.H.D. (1989a): Core collections: a practical approach to genetic resources management. Genome, 31: 818–824. Brown A.H.D. (1989b): The case for core collections. In: Brown A.H.D., Frankel O.H., Marshall D.R., Williams J.T. (eds): The Use of Plant Genetic Resources. Cambridge University Press, Cambridge, 136–156. Brown A.H.D. (1995): The core collection at the crossroads. In: Hodgkin T., Brown A.H.D., van Hintum Th.J.L., Morales E.A.V. (eds): Core Collections of Plant Genetic Resources. John Wiley & Sons, Chichester, 3–19.
Brown A.H.D., Spillane C. (1999): Implementing core collections – principles, procedures, progress, problems and promise. In: Johnson R.C., Hodgkin T. (eds): Core Collections for Today and Tomorrow. IPGRI, Rome, 1–9. Casler M.D., Fales S.L., McElroy A.R. (2000): Genetic progress from 40 years of orchardgrass breeding in North America measured under hay management. Crop Science, 40: 1019–1025. Chandra S., Huaman Z., Krishna S.H., Ortiz R. (2002): Optimal sampling strategy and core collection size of Andean tetraploid potato based on isozyme data – a simulation study. Theoretical and Applied Genetics, 104: 1325–1334. Charmet G., Balfourier F. (1995): The use of geostatistics for sampling a core collection of perennial ryegrass populations. Genetic Resources and Crop Evolution, 42: 303–309. Cochran W.G. (1977): Sampling Techniques. 3rd Ed. John Wiley & Sons, New York. Crossa J., DeLacy I.H., Taba S. (1995): The use of multivariate methods in developing a core collection. In: Hodgkin T., Brown A.H.D., van Hintum Th.J.L., Morales E.A.V. (eds): Core Collections of Plant Genetic Resources. John Wiley & Sons, Chichester, 77–92. Diwan N., McIntosh M.S., Bauchan G.R. (1995): Methods of developing a core collection of annual Medicago species. Theoretical and Applied Genetics, 90: 755–761. Federer W.T. (1956): Augmented (or hoonuiaku) designs. Hawaiian Planters' Record, 2: 191–208. Federer W.T., Reynolds M., Crossa J. (2001): Combining results from augmented designs over sites. Agronomy Journal, 93: 389–395. Franco J., Crossa J., Taba S., Shands H. (2005): A sampling strategy for conserving genetic diversity when forming core subsets. Crop Science, 45: 1035–1044. Franco J., Crossa J., Warburton M.L., Taba S. (2006): Sampling strategies for conserving maize diversity when forming core subsets using genetic markers. Crop Science, 46: 854–864. Frankel O.H. (1984): Genetic perspectives of germplasm conservation. In: Arber W., Llimensee K., Peacock W.J, Starlinger P. (eds): Genetic Manipulation: Impact on Man and Society. Cambridge University Press. Cambridge, 161–170. Frankel O.H., Brown A.H.D. (1984): Plant Genetic Resources Today: A Critical Appraisal. Crop Genetic Resources: Conservation and Evaluation. Allen and Unwin, Massachusetts. Ghamkhar K., Snowball R., Wintle B.J., Brown A.H.D. (2008): Strategies for developing a core collection of bladder clover (Trifolium spumosum L.) using ecological and agro-morphological data. Australian Journal of Agricultural Research, 59: 1103–1112.
45
Czech J. Genet. Plant Breed., 49, 2013 (1): 36–47 Grenier C., Deu M., Kresovich S., Bramel-Cox P.J., Hamon P. (2000): Assessment of genetic diversity in three subsets constituted from the ICRISAT sorghum collection using random vs non-random sampling procedures. B. Using molecular markers. Theoretical and Applied Genetics, 101: 197–202. Hartung K., Piepho H.P. (2005): A threshold model for multiyear genebank data based on different rating scales. Crop Science, 45: 1045–1051. Hu J., Zhu J., Xu H.M. (2000): Methods of constructing core collections by stepwise clustering with three sampling strategies based on the genotypic values of crops. Theoretical and Applied Genetics, 101: 264–268. IBPGR (1985): Forage Grass Descriptors. International Board for Plant Genetic Resources, Rome. Jansen J., van Hintum Th. (2007): Genetic distance sampling: a novel sampling method for obtaining core collections using genetic distances with an application to cultivated lettuce. Theoretical and Applied Genetics, 114: 421–428. Kaiser H.F. (1960): The application of electronic computers to factor analysis. Educational and Psychological Measurement, 20: 141–151. Kim K.W., Chung H.K., Cho G.T., Ma K.H., Chandrabalan D., Gwag J.G., Kim T.S., Cho E.G., Park Y.J. (2007): PowerCore: a program applying the advanced M strategy with a heuristic search for establishing core sets. Bioinformatics, 23: 2155–2162. Li C.T., Shi C.H., Wu J.G., Xu H.M., Zhang H.Z., Ren Y.L. (2004): Methods of developing core collections based on the predicted genotypic value of rice (Oryza sativa L.). Theoretical and Applied Genetics, 108: 1172–1176. Li Y., Shi Y., Cao Y., Wang T. (2005): Establishment of a core collection for maize germplasm preserved in Chinese National Genebank using geographic distribution and characterization data. Genetic Resources and Crop Evolution, 51: 845–852. Li Z., Zhang H., Zeng Y., Yang Z., Shen S., Sun C., Wang X. (2002): Studies on sampling schemes for the establishment of a core collection of rice landraces in Yunnan, China. Genetic Resources and Crop Evolution, 49: 67–74. Liu X.L., Cai Q., Ma L., Wu C.W., Lu X., Ying X.M., Fan Y.H. (2009): Strategy of sampling for pre-core collection of sugarcane hybrid. Acta Agronomica Sinica, 35: 1209–1216. Logozzo G., Donnoli R., Macaluso L., Papa R., Knu H., Spagnoletti Zeuli P. (2007): Analysis of the contribution of Mesoamerican and Andean gene pools to European common bean (Phaseolus vulgaris L.) germplasm and strategies to establish a core collection. Genetic Resources and Crop Evolution, 54: 1763–1779. Marita J., Rodriguez J.M., Nienhuis J. (2000): Development of an algorithm identifying maximumly diverse
46
core collections. Genetic Resources and Crop Evolution, 47: 515–526. Malosetti M., Abadie T. (2001): Sampling strategy to develop a core collection of Uruguayan maize landraces based on morphological traits. Genetic Resources and Crop Evolution, 48: 381–390. Neyman J. (1934): On the two different aspects on the representative method: The method of stratified sampling and the method of purposive selection. Journal of the Royal Statistical Society, 97: 558–606. Oliveira M.F., Nelson R.L., Geraldi I.O., Cruz C.D. (2010): Establishing a soybean germplasm core collection. Field Crops Research, 119: 277–289. Pessoa-Filho M., Rangel P.H., Ferreira M.E. (2010): Extracting samples of high diversity from thematic collections of large gene banks using a genetic-distance based approach. BMC Plant Biology, 10: 127. Piepho H.P., Möhring J. (2005): Best linear unbiased prediction of cultivar effects for subdivided target regions. Crop Science, 45: 1151–1159. R Development Core Team (2010): R: A Language and Environment for Statistical Computing. R Foundation for Statistical Computing, Vienna. Reddy L.J., Upadhyaya H.D., Gowda C.L.L., Singh S. (2005): Development of core collection in pigeonpea [Cajanus cajan L. Millspaugh] using geographic and qualitative morphological descriptors. Genetic Resources and Crop Evolution, 52: 1049–1056. SAS (2004): SAS OnlineDoc® 9.1.3. SAS Institute Inc., Cary. Spagnoletti Zeuli P.L., Qualset C.O. (1993): Evaluation of five strategies for obtaining a core subset from a large genetic resource collection of durum wheat. Theoretical and Applied Genetics, 87: 295–304. Upadhyaya H., Ortiz R., Bramel P.J., Singh S. (2003): Development of a groundnut core collection using taxonomical. geographical and morphological descriptors. Genetic Resources and Crop Evolution, 50: 139–148. Upadhyaya H., Dwivedi S., Gowda C., Singh S. (2007): Identification of diverse germplasm lines for agronomic traits in a chickpea (Cicer arietinum L.) core collection for use in crop improvement. Field Crops Research, 100: 320–326. Upadhyaya H., Gowda C.L.L., Reddy K.N., Singh S. (2009): Augmenting the pearl millet core collection for enhancing germplasm utilization in crop improvement. Crop Science, 49: 573–580. van Hintum Th., Von Bothmer R., Visser D.L. (1995): Sampling strategies for composing a core collection of cultivated barley (Hordeum vulgare s. lat.) collected in China. Hereditas, 122: 7–17. van Hintum Th. (1999): The general methodology for creating a core collection. In: Johnson R.C., Hodgkin T.
Czech J. Genet. Plant Breed., 49, 2013 (1): 36–47 (eds): Core Collections for Today and Tomorrow. IPGRI, Rome, 10–17. van Hintum Th., Brown A., Spillane C., Hodgkin T. (2000): Core collections of plant genetic resources. IPGRI Technical Bulletin No. 3, IPGRI, Rome. van Raamsdonk L.W.D., Wijnker J. (2000): The development of a new approach for establishing a core collection using multivariate analyses with tulip as case. Genetic Resources and Crop Evolution, 47: 403–416. Wang J., Hu J., Zhang C.F., Zhang S. (2007): Assessment on evaluating parameters of rice core collections constructed by genotypic values and molecular marker information. Rice Science, 14: 101–110. Xie W.G., Zhang X.Q., Cai H.W., Liu W., Peng Y. (2010): Genetic diversity analysis and transferability of cereal
EST-SSR markers to orchardgrass (Dactylis glomerata L.). Biochemical Systematics and Ecology, 38: 740–749. Xu H., Mei H., Hu J., Zhu J., Gong P. (2006): Sampling a core collection of Island cotton (Gossypium barbadense L.) based on the genotypic values of fiber traits. Genetic Resources and Crop Evolution, 53: 515–521. Yan W.G, Rutger J.N., Bryant R.J., Bockelman H.E., Fjellstrom R.G., Chen M.H., Tai T.H., McClung A.M. (2007): Development and evaluation of a core subset of the USDA rice germplasm collection. Crop Science, 47: 869–878. Zewdie Y., Tong N., Bosland P. (2004): Establishing a core collection of Capsicum using a cluster analysis with enlightened selection of accessions. Genetic Resources and Crop Evolution, 51: 147–151. Received for publication January 10, 2012 Accepted after corrections December 21, 2012
Corresponding author: Dr. Marcin Studnicki, Warsaw University of Life Sciences – SGGW, Faculty of Agriculture and Biology, Department of Experimental Design and Bioinformatics, Nowoursynowska 159, 02-776 Warsaw, Poland e-mail:
[email protected]
47