catalysts Article
Comparison between a Water-Based and a Solvent-Based Impregnation Method towards Dispersed CuO/SBA-15 Catalysts: Texture, Structure and Catalytic Performance in Automotive Exhaust Gas Abatement Qi Xin 1, *, Antonella Glisenti 2 , Constantine Philippopoulos 3 , Evangelos Poulakis 3 , Myrjam Mertens 4 , Jeff L. Nyalosaso 1 , Vera Meynen 1 and Pegie Cool 1 1
2 3
4
*
Laboratory of Adsorption & Catalysis, University of Antwerp, Universiteitsplein 1, 2610 Wilrijk, Belgium;
[email protected] (J.L.N.);
[email protected] (V.M.);
[email protected] (P.C.) Dipartimento di Scienze Chimiche, Università degli Studi di Padova, Via F. Marzolo, 1, 35131 Padova, Italy;
[email protected] Chemical Process Engineering Laboratory, Department of Chemical Engineering, National Technical University of Athens, 9 Heroon Polytechniou Str., Zografos Camphs, 15780 Athens, Greece;
[email protected] (C.P.);
[email protected] (E.P.) Flemish Institute for Technological Research (VITO N.V.), Boeretang 200, 2400 Mol, Belgium;
[email protected] Correspondence:
[email protected]; Tel.: +32-3-265-2354
Academic Editor: Jean-François Lamonier Received: 6 September 2016; Accepted: 14 October 2016; Published: 21 October 2016
Abstract: Supported copper oxide nanoparticles are a potential candidate for replacing the rare and expensive precious metals within the automotive three-way catalyst. However, a well-designed dispersion method is necessary to allow a stable high loading of active material, compensating its lower intrinsic activity and stability. In this work, a CuO-loaded SBA-15 catalyst has been manufactured by two methods. The ammonia-driven deposition precipitation (ADP) and the molecular designed dispersion (MDD) methods are both considered as efficient deposition methods to provide well-dispersed copper oxide-based catalysts. Their morphology, copper dispersion and the chemical state of copper were characterized and compared. Due to the differences in the synthesis approach, a difference in the obtained copper oxide phases has been observed, leading to a distinct behavior in the catalytic performance. The structure-activity correlation of both catalysts has also been revealed for automotive exhaust gas abatement. Results demonstrate that various copper species can be formed depending on the precursor–support interaction, affecting selectivity and conversion during the catalytic reaction. Keywords: copper; ammonia based impregnation; molecular designed dispersion; three-way catalyst
1. Introduction Automotive three-way catalysts (TWC) based on Pt, Pd and Rh have been designed and manufactured with the objective to improve air quality and protect human health. The presence of the platinum group metals (PGMs) provides a distinguishing effectiveness for the conversion of hydrocarbons (HCs), carbon monoxide (CO) and nitrogen oxides (NOx ) [1,2]. Furthermore, their outstanding stability guarantees a long catalyst on-road life span. Despite aforementioned advantages, the rising issue of PGMs is their increasing scarcity and, consequently, their high cost [3]. Hence,
Catalysts 2016, 6, 164; doi:10.3390/catal6100164
www.mdpi.com/journal/catalysts
Catalysts 2016, 6, 164
2 of 14
looking for other sustainable and economically beneficial alternatives is now a major priority and challenge for the automotive catalyst industry [4]. In this context, copper-based heterogeneous catalysts are a potential candidate for replacing Pd and Pt for vehicular oxidation of CO and HCs [5]. During the last decades, this type of catalyst has drawn a considerable amount of attention because of its remarkable redox activity, high recyclability and low cost [6,7]. This leads to its application in various reactions, for instance hydrogenolysis of glycerol to 1,2-propanediol [8–10], hydrogenation of dimethyl oxalate [11–13] and methanol synthesis [14–16]. However, in order to use copper as an active element for automotive emission control, two major limitations should be considered and overcome. First is its low intrinsic activity: copper has an activity that is 50 times lower than that of Pd for CO oxidation and even 100 times lower than that of Pt for HCs conversion [7]. Secondly, the high reaction temperature within the vehicle (up to 800 ◦ C) will accelerate the catalyst’s deactivation by the means of particle growth, leading to a low catalyst durability [17,18]. Literature suggests that these drawbacks can be mitigated by providing a well-designed deposition method with small and highly dispersed copper oxide nanoparticles decorating the substrate, which will enhance the active sites’ surface and suppress the particle agglomeration [19,20]. In the past, the molecular designed dispersion (MDD) method, based on the impregnation of metal acetylacetonate (acac) complexes on silica and alumina surfaces, was investigated and optimized [21–24]. The main principle of this method relies on the steric effect of the large acac ligands in the precursor, which guarantees a large spatial distance among the metal atoms during impregnation. The overall result is a catalyst with a highly dispersed copper oxide phase on the material’s surface. Studies show that during the complex deposition, interactions between the acac complex and the surface hydroxyl group of the support will be established [24]. These interactions determine the success of the whole synthesis since it restricts the metal atoms’ mobility during the ligand removal step at high temperature. Despite these benefits, an important drawback of this method is the need to work in a water-free environment with non- or weak- surface interacting solvents to prevent competitive adsorption and warrant sufficient loading. This makes the method less environmentally friendly and more difficult for further industrial upscaling. For this reason, we recently adapted and optimized a water-based method, the so-called ammonia-driven deposition precipitation (ADP), described by Guo et al. as a more eco-friendly alternative for copper-based catalyst preparation [25]. The concept of this approach relies on ammonia addition during the copper impregnation. Herein, the formed copper-ammonia complex replaces the metal acetylacetonate complex in its role as a steric hindrance provider. Furthermore, because of the ammonia addition, the pH of the solution (pH ≈ 10) rises far above the point of zero charge (PZC) of the support (≈2 for silica), creating a strong electrostatic complex–support interaction during the synthesis [26,27]. Although considerable research has demonstrated the effectiveness of both methods to provide well-dispersed copper oxide nanoparticles onto the catalyst support [23,28,29], less attention has been paid to the differences in the copper oxide formation and consequently their structural properties. Hence, the influence of these differences on the catalytic performance remains to be shown. In the present work, we applied both approaches for the preparation of a CuO/SBA-15 catalyst. The emphasis lies on the identification and comparison of the different CuO species formed by these deposition methods. Finally, the structure-activity relationship of both catalysts was elucidated by evaluating them for the automotive exhaust gas conversion. 2. Results 2.1. Textural Properties Textural properties of the synthesized catalysts were characterized using N2 -sorption analysis. The respective isotherms are illustrated in Figure 1. As a reference, the isotherm of the pure SBA-15
Catalysts 2016, 6, 164
3 of 14
is also shown in the figure. The pure SBA-15 silica support demonstrates a typical type IV isotherm Catalysts 2016, 6, 164 3 of 14 according to the International Union of Pure and Applied Chemistry (IUPAC) classification [30], according to by the Union of Pure and Applied Chemistry (IUPAC) classification [30], accompanied a International H1 type of hysteresis, referring to a porous material consisting of well-defined accompanied by a H1 type of hysteresis, referring to a porous material consisting of well‐defined cylindrical-like pore channels. The presence of material’s micro-porosity is derived by an initial cylindrical‐like pore pressure channels. (P/P The 0presence material’s micro‐porosity is derived at by P/P an 0initial ≈ 0.075),of while ≈ 0.75 uptake at low relative a steep capillary condensation uptake at low relative pressure (P/P 0 ≈ 0.075), while a steep capillary condensation at P/P 0 ≈ 0.75 is is associated with a high pore size uniformity of 6.2 nm (determined by the Barret–Joyner–Halenda associated with a high pore size the uniformity 6.2 hysteresis nm (determined by not the change Barret–Joyner–Halenda method). After metal deposition, shape ofof the loop did for both catalysts, method). After metal deposition, the shape of the hysteresis loop did not change for both catalysts, suggesting an effective impregnation of metal nanoparticles without pore blockage [29]. However, suggesting an effective impregnation of metal nanoparticles without pore blockage [29]. However, other properties did change: Table 1 gives an overview of the materials’ textural parameters derived other properties did change: Table 1 gives an overview of the materials’ textural parameters derived from their isotherms. The drastic loss of surface area of about 20% for the MDD sample and of more than from their isotherms. The drastic loss of surface area of about 20% for the MDD sample and of more 40% for the ADP sample indicates the presence of copper oxide within the micropores and mesopores than 40% for the ADP sample indicates the presence of copper oxide within the micropores and of the support. Although the micropores are blocked and no longer accessible, the mesopores are mesopores of the support. Although the micropores are blocked and no longer accessible, the still reachable. The existence of copper oxide particles inside the mesopores is advantageous for the mesopores are still reachable. The existence of copper oxide particles inside the mesopores is copper oxide dispersion, since pore confinement will prevent further metal oxide particle growth advantageous for the copper oxide dispersion, since pore confinement will prevent further metal within the pores [31]. Finally, when comparing the average pore size of the materials, a significant oxide particle growth within the pores [31]. Finally, when comparing the average pore size of the increase can be recognized for the ADP sample. This seems to originate from the dissolution of the materials, a significant increase can be recognized for the ADP sample. This seems to originate from silica’s outer layer in the pore, accomplished by the high solution pH (≈11) of the ADP method [27]. the dissolution of the silica’s outer layer in the pore, accomplished by the high solution pH (≈11) of Despite the significant loss in surface area and pore size increase due to this dissolution under basic the ADP method [27]. Despite the significant loss in surface area and pore size increase due to this conditions, theunder pore shape of the ADP the sample intact with sample a pore volume that of dissolution basic conditions, pore remains shape of the ADP remains comparable intact with to a pore thevolume comparable to that of the MDD sample. MDD sample.
Figure 1. N 2‐physisorption isotherms of SBA‐15 and CuO/SBA‐15 catalysts prepared by molecular Figure 1. N 2 -physisorption isotherms of SBA-15 and CuO/SBA-15 catalysts prepared by molecular designed dispersion (MDD) and ammonia‐driven deposition precipitation (ADP) methods. designed dispersion (MDD) and ammonia-driven deposition precipitation (ADP) methods. Table 1. Textual properties and copper loading of CuO/SBA‐15 catalysts. Table 1. Textual properties and copper loading of CuO/SBA-15 catalysts. Porosity Metal Composition Sample SBET 1 Vmeso 2 Porosity Cu Metal Composition Vmicro 3 VTotal 4 dp 5 3∙g−1) (nm) Sample (m2∙g−1) (cm3∙g2−1) (cm3∙g−1) (cm (wt %) 1 3 4 SBET V meso V micro V Total dp 5 Cu (wt %) SBA‐15 910 1.35 0.061 1.41 6.2 2 − 1 3 − 1 3 − 1 3 − 1 (m ·g ) (cm ·g ) (cm ·g ) (cm ·g ) (nm)– 6 MDD 737 1.36 0.010 1.37 6.7 7.1 SBA-15 910 1.35 0.061 1.31 1.41 6.29.8 – 7 537 1.30 0.011 9.7 ADP 6 737 1.36 0.010 1.37 6.7 7.1 MDD 1 Brunauer–Emmett–Teller (BET) surface area of the support only, excluding the weight of copper; 2 5373 1.30 0.011 1.31 9.7 9.8 ADP 7 4 mesopore volume; micropore volume via t‐plot method; total pore volume determined at P/P0 = 1 Brunauer–Emmett–Teller (BET) surface area of the support only, excluding the weight of copper; 2 mesopore 0.95; 5 average pore diameter by applying the Barret–Joyner–Halenda method (BJH) to the adsorption volume; 3 micropore volume via t-plot method; 4 total pore volume determined at P/P0 = 0.95; 5 average 6 MDD, molecular designed dispersion; 7 ADP, ammonia‐driven deposition branch of the isotherm; pore diameter by applying the Barret–Joyner–Halenda method (BJH) to the adsorption branch of the isotherm; 6precipitation. MDD, molecular designed dispersion; 7 ADP, ammonia-driven deposition precipitation.
2.2.2.2. Copper Oxide Dispersion Copper Oxide Dispersion Figure 2 shows the X‐ray diffraction (XRD) curves of the CuO/SBA‐15 catalyst prepared by the Figure 2 shows the X-ray diffraction (XRD) curves of the CuO/SBA-15 catalyst prepared by the MDD and ADP methods. For MDD the MDD sample, the diffraction peaks characteristic CuO MDD and ADP methods. For the sample, the diffraction peaks characteristic for CuO for crystallites
Catalysts 2016, 6, 164 Catalysts 2016, 6, 164
4 of 14 4 of 14
cannot be resolved in the diffractograms. On the other hand, the ADP sample shows very weak crystallites cannot be resolved in the diffractograms. On the other hand, the ADP sample shows very CuO peaks which are in proximity to the detection limit of the instrument. Since theSince XRDthe technique weak CuO peaks which are in proximity to the detection limit of the instrument. XRD cantechnique can only detect the crystallites within the material that are larger than a certain size, it is only detect the crystallites within the material that are larger than a certain size, it is most likely most likely that the copper oxide species on the materials are present in the form of amorphous/well‐ that the copper oxide species on the materials are present in the form of amorphous/well-dispersed dispersed CuO. Herein, the term well‐dispersed CuO is defined as non‐XRD‐detectable, small copper CuO. Herein, the term well-dispersed CuO is defined as non-XRD-detectable, small copper particles. particles. However, they can still possess divergent dimensions, which will be further identified However, they can still possess divergent dimensions, which will be further identified through through other techniques. other techniques.
Figure 2. X-ray diffraction patterns of the CuO/SBA-15 materials prepared by ADP method (top) and Figure 2. X‐ray diffraction patterns of the CuO/SBA‐15 materials prepared by ADP method (top) and MDD method (bottom). MDD method (bottom).
Evidently, the information provided by XRD analysis is in our case very limited for gaining a Evidently, the information provided by XRD analysis is in our case very limited for gaining good insight in the copper oxide dispersion. For this reason, X‐ray photoelectron spectroscopy (XPS) a good insight in the copper oxide dispersion. For this reason, X-ray photoelectron spectroscopy analysis was performed with the aim to identify the oxidation state of copper on the catalytic surface. (XPS) analysis was performed with the aim to identify the oxidation state of copper on the catalytic The Cu 2p3/2 core level peak is illustrated in Figure 3. In all samples, the copper is in an oxidation state surface. 2+The Cu 2p3/2 core level peak is illustrated in Figure 3. In all samples, the copper is in an of Cu , evidenced by the characteristic shake‐up satellite peak centered at 943.8 eV. However, by oxidation state of Cu2+ , evidenced by the characteristic shake-up satellite peak centered at 943.8 eV. comparing both spectra, some obvious differences can be noticed. The Cu 2p3/2 signal, situated However, by comparing both spectra, some obvious differences can be noticed. The Cu 2p3/2 signal, between 933.5 and 936.0 eV, can be deconvoluted into two peaks centered at 933.7 and 935.9 eV, situated between 933.5 and 936.0 eV, can be deconvoluted into two peaks centered at 933.7 and respectively. The peak at a lower binding energy (BE) is attributed to the CuO species distributed on 935.9 eV, respectively. The peak at a lower binding energy (BE) is attributed to the CuO species the surface, while the peak at a higher BE can be due to the formation of copper hydroxyl groups or distributed on the surface, the peak at bonds. Toupance a higher BE can et al. be due to thethe formation of copper to the interaction with the while neighboring Si–O reported existence of two hydroxyl groups or to the interaction with the neighboring Si–O bonds. Toupance et al. reported 2+ species when using the ammonia‐based method for metal impregnation, types of well‐dispersed Cu 2+ [27]. Copper phyllosilicate has a lamellar structure wherein thei.e., copper phyllosilicate and grafted Cu existence of two types of well-dispersed Cu2+ species when using the ammonia-based method forthe layers of SiO metal impregnation, i.e., copper phyllosilicate and grafted Cu2+ [27]. Copper phyllosilicate has 4 tetrahedra are sandwiched between discontinuous layers of CuO 6 octahedra [27,32]. a lamellar structure wherein the layers of reaction SiO4 tetrahedra between discontinuous It is a result of the hetero‐condensation between are the sandwiched Cu(OH)2(H2O) 4 and the silicic acid layers of CuO octahedra [27,32]. It is a result of the hetero-condensation reaction between the (Si(OH) 4) formed by the silica dissolution at basic pH [11,27,33]. The latter phenomenon is in line with 6 the support’s pore enlargement observed in the ADP sample by the N 2 physisorption (Table 1). In Cu(OH) at basic pH [11,27,33]. 2 (H2 O)4 and the silicic acid (Si(OH)4 ) formed by the silica dissolution Thecontrast, the grafted Cu latter phenomenon is 2+ in, in the form of Cu–O–Si, is formed due to the ion exchange between two line with the support’s pore enlargement observed in the ADP sample by 2+ ion. Since both phyllosilicate and grafted copper have a strong thesurface silanol groups and the Cu N2 physisorption (Table 1). In contrast, the grafted Cu2+ , in the form of Cu–O–Si, is formed due interaction towards the support matrix, silanol it suggests that and the the signal at ion. 935.9 Since eV is both likely to have a to the ion exchange between two surface groups Cu2+ phyllosilicate contribution of both copper oxides on the surface. On the contrary, the existence of copper and grafted copper have a strong interaction towards the support matrix, it suggests that the signal phyllosilicate is less probable in the MDD sample, since its synthesis is conducted under an aqueous‐ at 935.9 eV is likely to have a contribution of both copper oxides on the surface. On the contrary, the free environment. In other words, the signal at eV for the MDD is related to the existence of copper phyllosilicate is less probable in935.9 the MDD sample, sincesample its synthesis is conducted formation of copper hydroxyl or copper oxide which is grafted on the material due to the covalent under an aqueous-free environment. In other words, the signal at 935.9 eV for the MDD sample is Me–Osupport bond (Section 2.3). Another detail worth mentioning is the relative low intensity of the related to the formation of copper hydroxyl or copper oxide which is grafted on the material due to the shake‐up satellite at 943.8 eV for the MDD sample, which points out that a small part of the copper covalent Me–Osupport bond (Section 2.3). Another detail worth mentioning is the relative low intensity species are reduced. However, considering that the sample was thermally treated under air of the shake-up satellite at 943.8 eV for the MDD sample, which points out that a small part of the atmosphere, these reduced Cu species are more likely to be in the Cu+ and not in the Cu0 state. copper species are reduced. However, considering that the sample was thermally treated under air atmosphere, these reduced Cu species are more likely to be in the Cu+ and not in the Cu0 state.
Catalysts 2016, 6, 164 Catalysts 2016, 6, 164 Catalysts 2016, 6, 164
5 of 14 5 of 14 5 of 14
Figure X‐ray photoelectron spectroscopy spectroscopy (XPS) (XPS) spectra spectra of of Cu Cu 2p 2p3/2 region Figure 3. 3. X-ray photoelectron regionfor forthe theCuO/SBA‐15 CuO/SBA-15 Figure 3. X‐ray photoelectron spectroscopy (XPS) spectra of Cu 2p3/2 3/2 region for the CuO/SBA‐15 sample prepared by ADP method (top) and MDD method (bottom). sample prepared by ADP method (top) and MDD method (bottom). sample prepared by ADP method (top) and MDD method (bottom).
Temperature programmed reduction (TPR) analysis has been implemented in this investigation Temperature programmed reduction (TPR) analysis has been implemented in this investigation Temperature programmed reduction (TPR) analysis has been implemented in this investigation in in order to identify the dispersion state and the reduction behavior of the catalysts. The H2‐TPR in order to identify the dispersion state the and the reduction behavior the catalysts. H2profiles ‐TPR order to identify the dispersion state and reduction behavior of the of catalysts. The HThe 2 -TPR profiles of the calcined samples are shown in Figure 4. As a reference, the profile of a bulk CuO profiles of the calcined samples are shown in Figure 4. As a reference, the profile of a bulk CuO is of sample is also shown in the figure. For the MDD sample, two types of CuO can be distinguished: a the calcined samples are shown in Figure 4. As a reference, the profile of a bulk CuO sample sample is also shown in the figure. For the MDD sample, two types of CuO can be distinguished: a also shown in the figure. For the MDD sample, two types of CuO can be distinguished: a phase of phase of copper‐oxo‐cations indicated by the peak centered at 200 °C and the well‐dispersed copper phase of copper‐oxo‐cations indicated by the peak centered at 200 °C and the well‐dispersed copper copper-oxo-cations indicated by the peak centered at 200 ◦ C and the well-dispersed copper oxide oxide species at 215 °C [34,35]. Moreover, the fact that no reduction activity is visible above 300 °C oxide species at 215 °C [34,35]. Moreover, the fact that no reduction activity is visible above 300 °C ◦ species at 215 C [34,35]. Moreover, the fact that no reduction activity is visible above 300 ◦ C suggests suggests the absence of bulk CuO, in line with the observation from its XRD pattern. When compared suggests the absence of bulk CuO, in line with the observation from its XRD pattern. When compared thewith absence of bulk CuO,one in line theobserve observation from temperature its XRD pattern. When compared with the ADP sample, can with clearly its higher requirement for the CuO with the ADP sample, one can clearly observe its higher temperature requirement for the CuO thereduction. The main reduction of the ADP sample took place at 270 °C which is 55 °C higher than the ADP sample, one can clearly observe its higher temperature requirement for the CuO reduction. reduction. The main reduction of the ADP sample took place at 270 °C which is 55 °C higher than the ◦ C higher than the reduction The main reduction the ADP sample place at 270 ◦ Ctemperature which is 55 indicates reduction of the of MDD sample. The took higher reduction a higher energy reduction of the MDD sample. The higher reduction temperature indicates a higher energy for the metal reduction which is in our indicates case caused by the strong metal‐support of requirement the MDD sample. The higher reduction temperature a higher energy requirement for the requirement for the metal reduction which is in our case caused by the strong metal‐support interaction, as which evidenced XPS result. this, metal–support various literature reports suggest that a by metal reduction is in by ourthe case caused byBesides the strong interaction, as evidenced interaction, as evidenced by the XPS result. Besides this, various literature reports suggest that a thestrong metal‐support interaction often results in smaller metal oxide particles since it suppresses their XPS result. Besides this, various literature reports suggest that a strong metal–support interaction strong metal‐support interaction often results in smaller metal oxide particles since it suppresses their mobility [14,36]. Hence, it is reasonable to believe that the well‐dispersed CuO particles on the ADP often results in smaller metal oxide particles since it suppresses their mobility [14,36]. Hence, it is mobility [14,36]. Hence, it is reasonable to believe that the well‐dispersed CuO particles on the ADP sample (both phyllosilicate and grafted copper) exhibit smaller particle size than the MDD particles, reasonable to believe that the well-dispersed CuO particles on the ADP sample (both phyllosilicate sample (both phyllosilicate and grafted copper) exhibit smaller particle size than the MDD particles, although both are below the detection limit of the XRD. Additionally, this H 2‐TPR profile illustrates and grafted copper) exhibit smaller particle size than the MDD particles, although both are below the although both are below the detection limit of the XRD. Additionally, this H 2‐TPR profile illustrates also a certain asymmetry of this reduction peak caused by two small reduction shoulders on its left detection limit of the XRD. Additionally, this H2 -TPR profile illustrates also a certain asymmetry of also a certain asymmetry of this reduction peak caused by two small reduction shoulders on its left (≈250 °C) and right (≈310 °C) side. The shoulder at 250 °C indicates the presence of well‐dispersed this reduction peak caused by two small reduction shoulders on its left (≈250 ◦ C) and right (≈310 ◦ C) (≈250 °C) and right (≈310 °C) side. The shoulder at 250 °C indicates the presence of well‐dispersed CuO loosely bonded on the surface because of its lower reduction energy requirement. On the other side. The shoulder at 250 ◦ C indicates the presence of well-dispersed CuO loosely bonded on the CuO loosely bonded on the surface because of its lower reduction energy requirement. On the other hand, the reduction signal at the right side is representative for larger CuO, as evidenced by the TPR surface because of its lower reduction energy requirement. On the other hand, the reduction signal hand, the reduction signal at the right side is representative for larger CuO, as evidenced by the TPR profile of the bulk CuO (Figure 4, bottom) and its weak CuO diffraction peak on the XRD spectra at profile of the bulk CuO (Figure 4, bottom) and its weak CuO diffraction peak on the XRD spectra the right side is representative for larger CuO, as evidenced by the TPR profile of the bulk CuO (Figure 2). (Figure 2). (Figure 4, bottom) and its weak CuO diffraction peak on the XRD spectra (Figure 2).
Figure 4. H2‐TPR (temperature programmed reduction) profile of the CuO/SBA‐15 materials prepared Figure 4. H 2‐TPR (temperature programmed reduction) profile of the CuO/SBA‐15 materials prepared Figure 4. H2 -TPR (temperature programmed reduction) profile of the CuO/SBA-15 materials prepared by ADP (top) and MDD (middle) methods and the bulk CuO (bottom). by ADP (top) and MDD (middle) methods and the bulk CuO (bottom). by ADP (top) and MDD (middle) methods and the bulk CuO (bottom).
Catalysts 2016, 6, 164
6 of 14
Catalysts 2016, 6, 164 Based on the H2 -TPR results of both samples, it can be concluded that both materials 6 of 14 exhibit a superior copper dispersion upon the support accomplished by the well-designed dispersion Based on the H ‐TPR results of both samples, it can be concluded that both materials exhibit a methods. However, it 2is clear that these well-dispersed copper oxides have a significant difference in superior copper dispersion upon the support accomplished by the well‐designed dispersion methods. their structural property and metal–support interaction, leading to their unique reduction behavior. However, it is clear that these well‐dispersed copper oxides have a significant difference in their To further elucidate the structural differences of the copper phases, UV–Vis diffuse reflectance structural property and metal‐support interaction, leading to their unique reduction behavior. To (UV–Vis-DR) measurements were carried out. The UV–Vis-DR spectra of the samples are shown further elucidate the structural differences of the copper phases, UV–Vis diffuse reflectance (UV–Vis‐ in Figure 5. Generally, the signals can be divided into three regions ranging between 230–300 nm, DR) measurements were carried out. The UV–Vis‐DR spectra of the samples are shown in Figure 5. 300–500 nm and 600–800 nm. The band situated at 230–300 nm has been assigned to the charge transfer Generally, the signals can be divided into three regions ranging between 230–300 nm, 300–500 nm between mononuclear Cu2+ and oxygen [28,37], whereas the band at 300–500 nm has been attributed and 600–800 nm. The band situated at 230–300 nm has been assigned to the charge transfer between to mononuclear Cu the presence of 2+[Cu–O–Cu] n -type clusters (oligomeric species) different from the bulk CuO [23]. and oxygen [28,37], whereas the band at 300–500 nm has been attributed to the Finally, the signal at 600–800 nm corresponds to the d–d transition of Cu2+ situated in an octahedral presence of [Cu–O–Cu] n‐type clusters (oligomeric species) different from the bulk CuO [23]. Finally, environment, which is, innm other words, theto typical band for bulkof CuO For both MDD and ADP the signal at 600–800 corresponds the d–d transition Cu2+[37]. situated in an octahedral samples, the copper signals are mainly situated between the region of monomeric and oligomeric environment, which is, in other words, the typical band for bulk CuO [37]. For both MDD and ADP species while only a low intensity of the bulk CuO band is present. This observation suggests the samples, the copper signals are mainly situated between the region of monomeric and oligomeric species while only a low intensity of the bulk CuO band is present. This observation suggests the high copper oxide dispersion on the materials with a small amount of larger CuO, in line with the H2high copper oxide dispersion on the materials with a small amount of larger CuO, in line with the -TPR results. However, as demonstrated by the previous results, the well-dispersed copper oxide 2‐TPR results. However, as demonstrated by the previous results, the well‐dispersed copper oxide onHboth materials is a compilation of different copper oxide species, which can be clearly observed on both materials is a compilation of different copper oxide species, which can be clearly observed here. The ADP sample contains mainly mononuclear CuO species in the 230–300 nm region and only a here. The ADP sample contains mainly mononuclear CuO species in the 230–300 nm region and only small percentage are present in the 300–500 nm region, while the MDD sample has both mononuclear a small percentage are present in the superimposed 300–500 nm region, while up the toMDD sample both and oligomeric CuO visible with a broad UV-DR signal 550 nm. Whenhas analyzing mononuclear and oligomeric CuO visible with a broad superimposed UV‐DR signal up to 550 nm. the results in more detail, it can be noticed that the band ranging between 230 and 300 nm of both When analyzing the results in more detail, it can be noticed that the band ranging between 230 and samples can be deconvoluted into two separate signals, located respectively at 246 and 276 nm for 300 nm of both samples can be deconvoluted into two separate signals, located respectively at 246 the ADP sample and at 250 and 286 nm for the MDD sample. Besides this, the oligomeric species and 276 nm for the ADP sample and at 250 and 286 nm for the MDD sample. Besides this, the present on the MDD sample can also be discriminated into two bands at 330 and 380 nm. The relative oligomeric species present on the MDD sample can also be discriminated into two bands at 330 and intensities of these bands are clearly much higher in the MDD sample as compared to the ADP material, 380 nm. The relative intensities of these bands are clearly much higher in the MDD sample as enhancing the hypothesis of smaller species present on the ADP sample, as evidenced by the TPR compared to the ADP material, enhancing the hypothesis of smaller species present on the ADP results. The appearance of these separate bands strongly suggests that both synthesis methods do sample, as evidenced by the TPR results. The appearance of these separate bands strongly suggests notthat both synthesis methods do not only yield in a majority of well‐dispersed copper oxide species, only yield in a majority of well-dispersed copper oxide species, but also result in diverse types of but also result in diverse types of well‐dispersed copper species with different copper coordination well-dispersed copper species with different copper coordination and environment. Although the exact of these species the remains be investigated, is expected thatto these copper oxides will and structure environment. Although exact tostructure of these itspecies remains be investigated, it is lead to a different behavior during the activity test. expected that these copper oxides will lead to a different behavior during the activity test.
Figure 5. UV–Vis diffuse reflectance spectra of Cu/SBA‐15 materials prepared by ADP method (top) Figure 5. UV–Vis diffuse reflectance spectra of Cu/SBA-15 materials prepared by ADP method (top) and MDD method (bottom). and MDD method (bottom).
2.3. The Formation of Copper Oxide 2.3. The Formation of Copper Oxide The formation of various well‐dispersed copper oxide phases on both samples originates from The formation of various well-dispersed copper oxide phases on both samples originates from the the difference in the Cu2+–support interaction. The reported mechanisms for ammonia‐based difference in the Cu2+ –support interaction. The reported mechanisms for ammonia-based impregnation impregnation describe that after the sample is dried, the majority (about 90%) of Cu2+ on the ADP
Catalysts 2016, 6, 164
7 of 14
Catalysts 2016, 6, 164
7 of 14
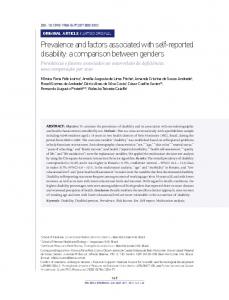
describe that after the sample is dried, the majority (about 90%) of Cu2+ on the ADP sample undergoes undergoes an ion‐exchange process where two NH3 ligands of the copper tetra‐ammonia ansample ion-exchange process where two NH 3 ligands of the copper tetra-ammonia complex are replaced − ligands (Figure 6a) [38]. However, in the case of the MDD complex are replaced by two ≡Si–O − by two ≡Si–O ligands (Figure 6a) [38]. However, in the case of the MDD method, the interaction method, interaction between complex the metal acetylacetonate and the support is hydrogen mostly between thethe metal acetylacetonate and the support iscomplex mostly established through established through hydrogen bonding between acac ligands and the hydride of the surface silanol bonding between acac ligands and the hydride of the surface silanol group (Figure 6b left) [23,24]. group (Figure 6b left) [23,24]. Nevertheless, the interaction via a ligand exchange with the formation Nevertheless, the interaction via a ligand exchange with the formation of a covalent Me–Osupport bond of a covalent Me–Osupport bond is also a possible pathway (Figure 6b, right [24]). is also a possible pathway (Figure 6b, right [24]).
Figure 6. Interactions between Cu Figure 6. Interactions between Cu2+2+ species and silica during and after the impregnation for (a) ADP species and silica during and after the impregnation for (a) ADP method and MDD method. (Figure (Figure 6a: from Trouillet et. et al al. [38]. method and (b)(b) MDD method. 6a: reproduced reproducedwith withpermission permission from Trouillet [38]. Copyright Royal Society of Chemistry, 2000.) Copyright Royal Society of Chemistry, 2000.)
Figure 7 illustrates the result of the differential thermogravimetric (DTG) analysis for the Figure 7 illustrates the result of the differential thermogravimetric (DTG) analysis for the uncalcined MDD sample. It can be noticed that the catalyst demonstrates a sharp weight loss between uncalcined MDD sample. It can be noticed weight that theloss catalyst demonstrates sharp weight loss can between 180 and 200 °C, associated with a small from 230 to 500 °C. aThe weight losses be 180assigned respectively to the decomposition of the acac group bonded by hydrogen bonding (at 200 °C) and 200 ◦ C, associated with a small weight loss from 230 to 500 ◦ C. The weight losses can be assigned respectively tosupport the bond (>200 °C) [23]. Thus, the result reveals that the vast majority of the decomposition of the acac group bonded by hydrogen bonding (at 200 ◦ C) and a covalent Me–O and a covalent Me–Osupport bond (>200 ◦ C) [23]. Thus, the result reveals that the vast majority of the metal–acac complex is interacting with the support through a hydrogen bonding mechanism while metal–acac complex is interacting with the support through a hydrogen bonding mechanism while only a small part was covalently bonded with the support. In order to confirm this assumption, the only a small part was covalently bonded with the support. In order to confirm this assumption, the R‐value has been calculated to elucidate the reaction mechanism. The R‐value is defined as: R-value has been calculated to elucidate the reaction mechanism. The R-value is defined as: (mmol of acac)/(g of support) R= (mmol of Cu)/(g of support) of acac) / (g of support) (mmol R= of Cu) / (g by of support (mmol ) loss (from 180 to 500 °C) in herein, the amount of acac ligands can be determined the weight thermogravimetric analysis (TGA) while the content of copper was obtained by electron microprobe herein, the amount of acac ligands can be determined by the weight loss (from 180 to 500 ◦ C) in analysis (EPMA). The R‐value for the MDD sample is in our case 1.7 ± 0.1, which is close to the thermogravimetric analysis (TGA) while the content of copper was obtained by electron microprobe number of acetylacetonate ligands present in the parent complex. Therefore, it should be concluded analysis (EPMA). The R-value for the MDD sample is in our case 1.7 ± 0.1, which is close to the that the Cu–acac complexes react with the surface mainly by hydrogen bonding, resulting in mostly number of acetylacetonate ligands present in the parent complex. Therefore, it should be concluded loosely bonded, well‐dispersed CuO, evidenced by XPS and H 2‐TPR. This observation is in contrast that the Cu–acac complexes react with the surface mainly by hydrogen bonding, resulting in mostly with the one reported by the literature which demonstrates a comparable share of both mechanisms loosely bonded, well-dispersed CuO, evidenced by XPS and H2 -TPR. This observation is in contrast in the material [23]. A possible explanation for this deviation between our sample and that from the with the one reported by the literature which demonstrates a comparable share of both mechanisms literature might originate from the washing step which is not performed in our case for maximizing in the copper content. For the ADP sample, the DTG curve shows a two‐step decomposition occurring the material [23]. A possible explanation for this deviation between our sample and that from the at 240 and 260 °C, which respectively corresponds to the decomposition of nitrate originating from literature might originate from the washing step which is not performed in our case for maximizing 2+ [39–41]. the copper precursor and NH 3 ligands complexed with Cu the copper content. For the ADP sample, the DTG curve shows a two-step decomposition occurring at ◦ 240 and 260 C, which respectively corresponds to the decomposition of nitrate originating from the copper precursor and NH3 ligands complexed with Cu2+ [39–41].
Catalysts 2016, 6, 164 Catalysts 2016, 6, 164
8 of 14 8 of 14
Figure 7. Differential thermogravimetric profiles of Cu/SBA‐15 materials prepared by ADP and MDD Figure 7. Differential thermogravimetric profiles of Cu/SBA-15 materials prepared by ADP and MDD methods with the enlargement of the 200–600 °C region for the MDD sample. methods with the enlargement of the 200–600 ◦ C region for the MDD sample.
Combining these results and previous observations, the reason for the loosely bonded CuO Combining these results and previous observations, the to reason for the loosely bonded CuO formation on the MDD sample can be given. Firstly, it is due the interaction between the acac formation on the MDD sample can be given. Firstly, it is due to the interaction between the acac ligands and the support’s silanol groups through hydrogen bonding. This indirect metal‐support ligands and the support’s silanolof groups through hydrogen bonding. This indirect metal–support interaction limits the formation Cu–O–Si≡ during the calcination, resulting in the formation of interaction limits the formation of Cu–O–Si ≡ during the calcination, resulting in the formation mainly copper oxides, more weakly bonded to the support surface, as also observed via XPS and H2‐ of mainly copper oxides, more weakly bonded to the support surface, as also observed via XPS and TPR. Secondly, since the hydrogen bond is generally a weaker interaction in comparison with the 2+ ions can be significantly higher in the H2electrostatic interaction (as in ADP), the mobility of the Cu -TPR. Secondly, since the hydrogen bond is generally a weaker interaction in comparison with the 2+ ions can be significantly higher in the MDD electrostatic interaction inthermal ADP), the mobility of the Cu MDD sample during (as the treatment. Thus, this can lead to a partial clustering of the mononuclear copper oxides on the surface during calcination, resulting in larger as sample during the thermal treatment. Thus, this can lead to a partial clustering of theparticles, mononuclear observed in UV‐DR and suggested by TPR. The overall result is thus the presence of loosely bonded, copper oxides on the surface during calcination, resulting in larger particles, as observed in UV-DR mononuclear copper oxides and result oligomeric copper oxides ([Cu–O–Cu] n) resulting from copper the and suggested by TPR. The overall is thus the presence of loosely bonded, mononuclear agglomeration of mononuclear copper particles due to their low metal‐support interaction. In case of oxides and oligomeric copper oxides ([Cu–O–Cu]n ) resulting from the agglomeration of mononuclear the ADP method, the silica dissolution during the deposition and the ionic interactions at play cause copper particles due to their low metal–support interaction. In case of the ADP method, the silica a much stronger interaction of the Cu with the support already in its initial stages of preparation. dissolution during the deposition and the ionic interactions at play cause a much stronger interaction Moreover, the higher temperature required for the ligand removal warrants a lower mobility of the of the Cu with the support already in its initial stages of preparation. Moreover, the higher temperature copper oxide species, postponed to higher temperatures and allowing stronger condensation required for the ligand removal warrants a lower mobility of the copper oxide species, postponed reactions before its removal and loss of steric hindrance. to higher temperatures and allowing stronger condensation reactions before its removal and loss of steric hindrance. 2.4. Catalytic Activity
2.4. Catalytic Activity To study the influence of various types of CuO on the catalytic performance, the two catalysts were evaluated under the automotive stoichiometric exhaust gas condition, as shown in Figure 8a,b. To study the influence of various types of CuO on the catalytic performance, the two catalysts The light‐off temperature (temperature required for 50% of reactant’s conversion, T50) and the were evaluated under the automotive stoichiometric exhaust gas condition, as shown in Figure 8a,b. maximum conversion (Cmax) of each component are summarized in Table 2. In the case of CO The light-off temperature (temperature required for 50% of reactant’s conversion, T50 ) and the conversion, the sample prepared through the ADP method exhibits a convincible higher activity than maximum conversion (Cmax ) of each component are summarized in Table 2. In the case of CO the MDD sample, with a maximum conversion of 100% reached at 300 °C and a light‐off temperature conversion, the sample prepared through the ADP method exhibits a convincible higher activity than of around 200 °C. On the other hand, the MDD catalyst reached only a maximum conversion of 80% theunder the tested conditions, with a light‐off temperature of 400 °C, which is two‐fold higher than that MDD sample, with a maximum conversion of 100% reached at 300 ◦ C and a light-off temperature ofof the ADP method. A similar trend can be noticed for the HCs oxidation. The ADP sample provides around 200 ◦ C. On the other hand, the MDD catalyst reached only a maximum conversion of 80% under the tested conditions, with a light-off temperature of 400 ◦ C, which is two-fold higher than the best performance in all hydrocarbons conversion. Furthermore, in the case of C 3H6, its light‐off that of the ADP method. A similar trend can be noticed for the HCs oxidation. The ADP sample temperature (≈260 °C) is about 65 °C lower than that of the MDD sample, although both catalysts provides best performance in allof hydrocarbons conversion. Furthermore, in the case of C3 H6a , its reached the a maximum conversion 100%. Additionally, the ADP catalyst also demonstrates convincing C 3H8 oxidation capacity with a maximum conversion of 85% and T of 430 °C, while the light-off temperature (≈260 ◦ C) is about 65 ◦ C lower than that of the MDD 50sample, although both MDD sample reached only a C max of 25% at 500 °C. The MDD sample does seem to lead to a slightly catalysts reached a maximum conversion of 100%. Additionally, the ADP catalyst also demonstrates a convincing C3 H8 oxidation capacity with a maximum conversion of 85% and T50 of 430 ◦ C, while the MDD sample reached only a Cmax of 25% at 500 ◦ C. The MDD sample does seem to lead to a slightly
Catalysts 2016, 6, 164 Catalysts 2016, 6, 164
9 of 14
9 of 14
better NO reduction activity with a maximum conversion of 8% at 400 °C compared to 4% in the case better NO reduction activity with a maximum conversion of 8% at 400 ◦ C compared to 4% in the case of ADP. of ADP.
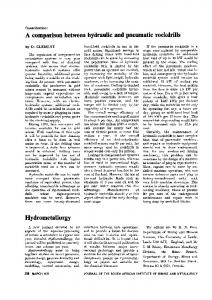
Figure 8. Catalytic performance under stoichiometric condition for Cu/SBA-15 catalyst prepared by Figure 8. Catalytic performance under stoichiometric condition for Cu/SBA‐15 catalyst prepared by (a) ADP, (b) MDD method and (c) commercial precious metal-loaded three-way catalyst. (a) ADP, (b) MDD method and (c) commercial precious metal‐loaded three‐way catalyst. TableHence, despite the presence of highly dispersed CuO phases obtained via both methods, both 2. Light-off temperature (T50 ) and maximum conversion (Cmax ) of each component for ADP, MDD and three-way catalyst (TWC) catalysts. catalysts demonstrate a dissimilar catalytic performance: the catalyst prepared by the ADP method represents an improved behavior in CO and HCs conversion while the MDD sample has a slightly COcapacity. The Cdivergent NO to the better NO reduction results Cof catalysts CH are 3 H6 3 Hboth 8 4 obviously related Catalyst diverse types of CuO species on the materials. Combining the previously obtained characterization T 50 CMax T 50 CMax T 50 CMax T 50 CMax T 50 CMax C) generally (%) derived (◦ C) that (%) (◦ C) a strong (%) metal–support (◦ C) (%) interaction (◦ C) (%) to results, it can (◦be CuO with seems promote the automotive oxidation reaction, while the presence of Cu(I) oxide and weak support‐ MDD 410 80 325 100 – 25 – 0.6 – 8.0 interacting Cu(II) oxide seems more important for the NO reduction, although its conversion is still ADP 202 100 260 100 430 85 – 10.7 – 4.0 TWC 222 100 225 100 370 89 – 9.7 – 40 very poor. We took a step further in the catalyst evaluation and compared the ADP sample with a commercial platinum group metal‐loaded three‐way catalyst (PGM‐TWC, Johnson Matthey, Reading, Hence, despite the presence of highly dispersed CuO phases obtained via both methods, both UK) (Figure 8c). The CO conversion of the ADP catalyst shows an outstanding result with a catalysts demonstrate a dissimilar catalytic performance: the catalyst prepared by the ADP method comparable light‐off temperature (at 200 °C) to the commercial catalyst (Table 2). The maximum represents an improved behavior in CO and HCs conversion while the MDD sample has a slightly conversion towards the propene, propane and methane conversion is also similar between both better NO reduction capacity. The divergent results of both catalysts are obviously related to the catalysts, although the light‐off temperature is about 40 °C lower in PGM‐TWC than in ADP for diverse types of CuO species on the materials. Combining the previously obtained characterization propene conversion and even 60 °C lower for propane. On the other hand, the PGM‐TWC results, it can be generally derived that CuO with a strong metal–support interaction seems to promote demonstrates a much higher NO (40%) conversion. Here, it is important to mention that the catalytic the automotive oxidation reaction, while the presence of Cu(I) oxide and weak support-interacting activity of the standard PGM‐TWC is reinforced by the various catalytic promoters present in the Cu(II) oxide seems more important for the NO reduction, although its conversion is still very poor. material [42], while this is not the case for our CuO/SBA‐15 materials. This means that its behavior is We tookcomparable a step further the catalyst evaluation and can compared ADPimproved sample with a already to the in PGM‐TWC for some gases and even be the further by the commercial platinum group metal-loaded three-way catalyst (PGM-TWC, Johnson Matthey, Reading, addition of promotors and co‐catalysts in the future. UK) (Figure 8c). The CO conversion of the ADP catalyst shows an outstanding result with a comparable light-off temperature (at 200 ◦ C) to the commercial catalyst (Table 2). The maximum conversion towards the propene, propane and methane conversion is also similar between both catalysts, although the light-off temperature is about 40 ◦ C lower in PGM-TWC than in ADP for propene conversion and even
Catalysts 2016, 6, 164
10 of 14
60 ◦ C lower for propane. On the other hand, the PGM-TWC demonstrates a much higher NO (40%) conversion. Here, it is important to mention that the catalytic activity of the standard PGM-TWC is reinforced by the various catalytic promoters present in the material [42], while this is not the case for our CuO/SBA-15 materials. This means that its behavior is already comparable to the PGM-TWC for some gases and can even be further improved by the addition of promotors and co-catalysts in the future. 3. Materials and Methods 3.1. Support Preparation Mesoporous silica SBA-15 was synthesized according to its verified synthesis [43]. Generally, Pluronic P123 triblock copolymer (P123, molecular weight 5800 g/mol, Sigma Aldrich, Diegem, Belgium) was firstly dissolved in a 1 M aqueous solution of HCl (37 wt %, Acros, Geel, Belgium) at 30 ◦ C. After a complete dissolution of the copolymers, the temperature was raised to 40 ◦ C and tetraethyl orthosilicate (TEOS, Acros) was added dropwise into the solution under vigorous stirring. The final molar composition is 1.0 TEOS/0.017 P123/2.1 HCl/116 H2 O. After 24 h of stirring, the gel was hydrothermally treated at 100 ◦ C for 72 h. The solid was filtered and washed with deionized water and dried at 60 ◦ C overnight. Finally, the material was calcined at 550 ◦ C for 6 h with a heating rate of 1 ◦ C·min−1 in ambient atmosphere. 3.2. Catalysts Preparation The MDD catalyst was prepared by the adapted molecular designed dispersion method. Prior to the synthesis, the SBA-15 support was dried at 200 ◦ C for 6 h in air. Consequently, 1 g of the thermally treated support was stirred in 10 mL anhydrous chloroform solution (CHCl3 , ≥99%, Sigma Aldrich) containing 1.6 mmol of copper acetylacetonate (Cu(acac)2 , 99%, Acros) in a dry air flushed glove box, to achieve a final Cu loading of 10 wt %. The whole mixture was stirred for 48 h at room temperature, followed by a drying step at 60 ◦ C overnight. The washing and filtration step was skipped in order to maintain the maximum amount of copper loading. Finally, the dried samples were calcined at 550 ◦ C for 6 h with a heating rate of 1 ◦ C·min−1 in ambient temperature. The ADP catalyst was prepared by an adapted and optimized ADP procedure according to Guo et al. [25]. Typically, 1 g of SBA-15 support was suspended into a 50 mL, 0.03 M aqueous copper nitrate solution (Cu(NO3 )2 ·3H2 O, >99%, Merck, Overijse, Belgium) to achieve a 10 wt % final Cu loading. Then, ammonia (NH4 OH, 28%–30%, Acros) was added into the mixture to gain a molar Cu/NH3 ratio of 1/6. The suspension was stirred for 48 h at room temperature, followed by the same drying and calcination procedure as by MDD (dried at 60 ◦ C overnight without washing or filtration and calcined at 550 ◦ C for 6 h with of 1 ◦ C·min−1 in ambient atmosphere). 3.3. Catalysts Characterization N2 -physisorption was carried out with a Quantachrome Quadrasorb SI automated gas adsorption system. Prior to the measurements, the samples were outgassed at 200 ◦ C for 16 h. The specific surface area was calculated using the Brunauer–Emmett–Teller (BET) equation. For the metal loaded samples, its specific area was calculated by using the weight of the supports only, excluding the metal content in the total sample weight. The Barret–Joyner–Halenda method was applied to estimate the pore size distribution. The total pore volume was determined at P/P0 = 0.95 while the micro pore volume was obtained via t-plot method. Wide angle X-ray diffraction was performed using a Panalytical X’PERT Pro diffractometer (Panalytical, Almelo, The Netherlands) with an anode X-ray generator (operating at 40 kV, 40 mA, Cu-filtered Cu Kα radiation, scanning speed 0.04◦ /4s). UV–Vis diffuse reflectance (UV–Vis-DR) analysis was carried out on a Nicolet Evolution 500 spectrophotometer (ThermoFischer Scientific, Waltham, MA, USA) equipped with an integrating sphere. The spectra were taken in the range of 200–800 nm with a scan speed of 120 nm/min. The samples were diluted to 2 wt % with
Catalysts 2016, 6, 164
11 of 14
dried KBr. TPR measurements of the catalysts were performed by a Quantachrome iQ (Quantachrome Instrument, Odelzhausen, Germany). About 20 mg of the sample was outgassed at 200 ◦ C for 16 h. After cooling, the sample was first pretreated at 250 ◦ C under a He flow for 1 h. Subsequently, the samples were reduced with 5 vol % H2 /Ar at a flow rate of 25 mL·min−1 and the temperature was increased from 50 to 600 ◦ C with a heating rate of 10 ◦ C·min−1 . The hydrogen consumption was continuously monitored using a thermal conductivity detector (TCD). The chemical composition of the samples was identified by electron microprobe analysis (EPMA) on a JEOL JXA 733 (JEOL, Peabody, MA, USA). The materials were grinded and dispersed on a copper grid coated with a carbon film. For each sample, three measurement points were taken to calculate the average metal loading. XPS was carried out by means of a PerkinElmer PHI 5600ci Multi Technique System (PerkinElmer, Waltham, MA, USA), using Al Kα radiation (1486.6 eV) working at 250 W. The spectrometer was calibrated by assuming the BE of the Au 4f7/2 line to be 84.0 eV with respect to the Fermi level. The standard deviation in the BE values of the XPS line is 0.10 eV. The peak positions were corrected for the charging effects by considering the C1s peak at 285.0 eV and evaluating the BE differences. Thermogravimetric experiments (TGA) were conducted on a Mettler Toledo TA 851 (Mettler Toledo, Zaventem, Belgium). Samples were heated in an oxygen flow from 30 to 600 ◦ C with a heating rate of 10 ◦ C·min−1 . 3.4. Catalytic Activity Test The catalytic performance of the materials was tested in a fixed bed continuous stainless steel reactor with a gas hourly space velocity of 60,000 mL·h−1 and a total gas flow rate of 200 NmL·min−1 . Prior to the measurement, the catalytic powder was pelletized using an IR pelletizer and crushed in order to have a particle size between 500 and 1000 µm. The pressure applied to the pelletizer was about 200 MPa which does not affect the textural property of the material [44]. Afterwards, 200 mg of the sieved catalyst was aged by passing atmospheric air (50 mL·min−1 ) through the reactor at 500 ◦ C for 2 h. Consequently, the reactor was cooled to 50 ◦ C and the catalyst was then exposed to vehicle exhaust gas under stoichiometric condition (λ = 1) with 0.7 vol % CO, 0.00225 vol % CH4 , 0.045 vol % C3 H6 , 15 vol % CO2 , 10 vol % H2 O, 0.233 vol % H2 , 0.777 vol % O2 and 0.1 vol % NO. The conversion performance was recorded every 50 ◦ C from 50 to 500 ◦ C (5 ◦ C·min−1 ). For the analysis of the gas stream leaving the reactor, a Shimadzu GC-17A gas chromatograph (Shimadzu, Duisburg, Germany) equipped with FID detector was used for the hydrocarbons conversion analysis. While a Dräger X-am 7000 CO analyzer (Dräger, Lübeck, Germany) was utilized for the CO gas quantification. A ThermoFischer Scientific NOx analyzer (ThermoFischer Scientific) was also used for monitoring the NO conversion during the catalytic reaction. The catalytic activity of the catalysts was calculated for the conversion of respectively CO, CH4 , C3 H6 , C3 H8 and NO in function of the reaction temperature. 4. Conclusions CuO-loaded SBA-15 catalysts have been compared based on two preparation methods known to create a high dispersion degree of metals on the support surface: the molecular designed dispersion (MDD) and ammonia-driven deposition precipitation (ADP) methods. We evaluated the differences in structural and textural properties, as well as the copper dispersion state of both materials and revealed the differences in the formed CuO phase on the support. XPS spectra revealed the existence of Cu2+ on both materials’ surfaces, which can be further divided into two entities: The sample prepared by the ADP method consists of copper phyllosilicate and copper oxide/hydroxide distributed on the surface. On the other hand, mainly copper oxide/hydroxide particles are evidenced on the MDD sample. H2 -TPR showed that the ADP method results in the formation of the CuO phase with a smaller size and/or a stronger metal–support interaction brought by the phyllosilicate and grafted copper formation, while the MDD approach provides mainly well-dispersed CuO, loosely bonded on the SBA-15 surface. Such deviations are explained by the complex–support interaction during the synthesis, which is an electrostatic interaction
Catalysts 2016, 6, 164
12 of 14
in the case of ADP and a hydrogen-bonding interaction in the case of MDD, as well as the temperatures of ligand removal. Moreover, the UV–Vis-DR characterization of the individual samples pointed to a more complex copper composition on the catalysts. For both samples, the UV–Vis-DR spectrum revealed at least two different species within the monomeric copper oxide and a clear presence of various oligomeric species in case of the MDD sample. Although further investigation is necessary to unravel the exact identity of these structures, it is a fact that those entities have a strong influence on the material’s catalytic activity: CuO/SBA-15 by ADP demonstrated an outstanding oxidation activity towards the automotive emission abatement, whereas a slightly higher NO conversion was assessed for the MDD sample. Furthermore, the ADP sample has a comparable oxidation activity as the commercial TWC for CO and a slightly inferior activity for hydrocarbons, even without the presence of promotors. Besides this, the ADP material is expected to have an enhanced thermal stability compared to the MDD sample since the strong metal–support interaction will suppress the mobility of copper particles at elevated temperature. These results provide strong evidence that copper can be used for precious metal replacement in the automotive catalyst by using an appropriate preparation method such as the ADP approach. The importance of the local structure of the copper oxide clusters that are present has been clearly demonstrated. However, since SBA-15 is not the most optimal candidate for the support due to its low hydrothermal stability [44], future work identifying a more robust and stable support, as well as further catalyst optimization, will be necessary. Acknowledgments: The authors kindly acknowledge the EU-FP 7 Next-Gen-Cat project (grant agreement number: 280890) for its financial support. Johnson Matthey is also acknowledged for providing the commercial precious metal loaded three-way catalyst. Author Contributions: Qi Xin conceived and designed the experiments; Qi Xin and Jeff L. Nyalosaso performed the experiments; Antonella Glisenti performed and analyzed the XPS data; Constantine Philippopoulos and Evangelos Poulakis conducted and performed the catalytic performance tests; Myrjam Mertens performed and analyzed the XRD data; Qi Xin analyzed the data; Qi Xin wrote the paper; Antonella Glisenti, Vera Meynen and Pegie Cool guided the work, modified the paper and discussed the results and explanations. Conflicts of Interest: The authors declare no conflict of interest.
References 1. 2. 3.
4. 5. 6. 7. 8. 9.
Twigg, M.V. Catalytic control of emissions from cars. Catal. Today 2011, 163, 33–41. [CrossRef] Muroi, T. Role of precious metal catalysts. In Noble Metals; Su, Y.H., Ed.; InTech: Rijeka, Croatia, 2012; pp. 301–330. Matthey, J. Forecast of Platinum Supply & Demands in 2014. Available online: www.platinum.matthey.com/ documents/new-item/pgm%20market%20reports/pgm%20market%20report%20november%202015. pdf&usg=AFQjCNFcHLV5hPhuFOyFS2G7l19nhZEWBA&sig2=ZjbjI1fYY11VzQXbAezbNg&cad=rja (accessed on 22 August 2016). Fechete, I.; Wang, Y.; Védrine, J.C. The past, present and future of heterogeneous catalysis. Catal. Today 2012, 189, 2–27. [CrossRef] Ertl, G.; Knozinger, H.; Schutl, F.; Weitkamp, J. Handbook of Heterogenous Catalysis, 2nd ed.; Wiley-VCH: Weinheim, Germany, 2008; pp. 2237–2331. López-Suárez, F.E.; Bueno-López, A.; Illán-Gómez, M.J. Cu/Al2 O3 catalysts for soot oxidation: Copper loading effect. Appl. Catal. B 2008, 84, 651–658. [CrossRef] Kummer, J.T. Catalysts for automobile emission control. Prog. Energy Combust. Sci. 1980, 6, 177–199. [CrossRef] Vila, F.; López Granados, M.; Ojeda, M.; Fierro, J.L.G.; Mariscal, R. Glycerol hydrogenolysis to 1,2-propanediol with Cu/γ-Al2 O3 : Effect of the activation process. Catal. Today 2012, 187, 122–128. [CrossRef] Zhu, S.; Gao, X.; Zhu, Y.; Fan, W.; Wang, J.; Li, Y. Highly efficient and robust Cu/SiO2 catalyst prepared by the ammonia evaporation hydrothermal method for glycerol hydrogenolysis to 1,2-propanediol. Catal. Sci. Technol. 2015, 5, 1169–1180. [CrossRef]
Catalysts 2016, 6, 164
10.
11.
12. 13.
14.
15.
16. 17. 18. 19. 20. 21. 22. 23.
24.
25.
26. 27. 28.
29. 30.
13 of 14
Huang, Z.; Cui, F.; Kang, H.; Chen, J.; Xia, C. Characterization and catalytic properties of the CuO/SiO2 catalysts prepared by precipitation-gel method in the hydrogenolysis of glycerol to 1,2-propanediol: Effect of residual sodium. Appl. Catal. A 2009, 366, 288–298. [CrossRef] Chen, L.; Guo, P.; Qiao, M.; Yan, S.; Li, H.; Shen, W.; Xu, H.; Fan, K. Cu/SiO2 catalysts prepared by the ammonia-evaporation method: Texture, structure, and catalytic performance in hydrogenation of dimethyl oxalate to ethylene glycol. J. Catal. 2008, 257, 172–180. [CrossRef] Li, F.; Lu, C.-S.; Li, X.-N. The effect of the amount of ammonia on the Cu0 /Cu+ ratio of Cu/SiO2 catalyst for the hydrogenation of dimethyl oxalate to ethylene glycol. Chinese Chem. Lett. 2014, 25, 1461–1465. [CrossRef] Zhu, Y.Y.; Wang, S.R.; Zhu, L.J.; Ge, X.L.; Li, X.B.; Luo, Z.Y. The influence of copper particle dispersion in Cu/SiO2 catalysts on the hydrogenation synthesis of ethylene glycol. Catal. Letters 2010, 135, 275–281. [CrossRef] van den Berg, R.; Parmentier, T.E.; Elkjær, C.F.; Gommes, C.J.; Sehested, J.; Helveg, S.; de Jongh, P.E.; de Jong, K.P. Support functionalization to retard ostwald ripening in copper methanol synthesis catalysts. ACS Catal. 2015, 5, 4439–4448. [CrossRef] Kasatkin, I.; Kurr, P.; Kniep, B.; Trunschke, A.; Schlögl, R. Role of lattice strain and defects in copper particles on the activity of Cu/ZnO/Al2 O3 catalysts for methanol synthesis. Angew. Chemie Int. Ed. 2007, 46, 7324–7327. [CrossRef] [PubMed] Zuo, Z.J.; Wang, L.; Han, P.D.; Huang, W. Methanol synthesis by CO and CO2 hydrogenation on Cu/γ-Al2 O3 surface in liquid paraffin solution. Appl. Surf. Sci. 2014, 290, 398–404. [CrossRef] Jos van Dillen, A.; Terorde, R.; Lensveld, D.J.; Geus, J.W.; de Jong, K.P. Synthesis of supported catalysts by impregnation and drying using aqueous chelated metal complexes. J. Catal. 2003, 216, 257–264. [CrossRef] Twigg, M.V.; Spencer, M.S. Deactivation of supported copper metal catalysts for hydrogenation reactions. Appl. Catal. A 2001, 212, 161–174. [CrossRef] Prieto, G.; Zeˇcevi´c, J.; Friedrich, H.; de Jong, K.P.; de Jongh, P.E. Towards stable catalysts by controlling collective properties of supported metal nanoparticles. Nat. Mater. 2013, 12, 34–39. [CrossRef] [PubMed] Farmer, J.A.; Campbell, C.T. Ceria maintains smaller metal catalyst particles by strong metal–support bonding. Science 2010, 329, 933–936. [CrossRef] [PubMed] Kenvin, J.C.; White, M.G.; Mitchell, M.B. Preparation and characterization of supported mononuclear metal complexes as model catalysts. Langmuir 1991, 7, 1198–1205. [CrossRef] Lindblad, M.; Peter, L.; Suntola, T. Preparation of Ni/A12 O3 catalysts from vapor phase by atomic layer epitaxy. Catal. Letters 1994, 27, 323–336. [CrossRef] Ku´strowski, P.; Chmielarz, L.; Dziembaj, R.; Cool, P.; Vansant, E.F. Modification of MCM-48-, SBA-15-, MCF-, and MSU-type mesoporous silicas with transition metal oxides using the molecular designed dispersion method. J. Phys. Chem. B 2005, 109, 11552–11528. [CrossRef] [PubMed] Segura, Y.; Cool, P.; Van Der Voort, P.; Mees, F.; Meynen, V.; Vansant, E.F. TiOx -VOx mixed oxides on SBA-15 support prepared by the designed dispersion of acetylacetonate complexes: Spectroscopic study of the reaction mechanisms. J. Phys. Chem. B 2004, 108, 3794–3800. [CrossRef] Guo, X.; Yin, A.; Dai, W.L.; Fan, K. One pot synthesis of ultra-high copper contented Cu/SBA-15 material as excellent catalyst in the hydrogenation of dimethyl oxalate to ethylene glycol. Catal. Letters 2009, 132, 22–27. [CrossRef] Jiao, L.; Regalbuto, J.R. The synthesis of highly dispersed noble and base metals on silica via strong electrostatic adsorption: I. Amorphous silica. J. Catal. 2008, 260, 329–341. [CrossRef] Toupance, T.; Kermarec, M.; Louis, C. Conditions of formation of copper phyllosilicates in silica-supported copper catalysts prepared by selective adsorption. J. Phys. Chem. B 2002, 106, 2277–2286. [CrossRef] Dziembaj, R.; Cool, P.; Vansant, E.F. Catalytic performance of various mesoporous silicas modified with copper or iron oxides introduced by different ways in the selective reduction of NO by ammonia. Appl. Catal. B 2006, 62, 369–380. García-Trenco, A.; Martínez, A. A simple and efficient approach to confine Cu/ZnO methanol synthesis catalysts in the ordered mesoporous SBA-15 silica. Catal. Today 2013, 215, 152–161. [CrossRef] Thommes, M.; Kaneko, K.; Neimark, A.V.; Olivier, J.P.; Rodriguez-Reinoso, F.; Rouquerol, J.; Sing, K.S.W. Physisorption of gases, with special reference to the evaluation of surface area and pore size distribution (IUPAC Technical Report). Pure Appl. Chem. 2015, 87, 1051–1069. [CrossRef]
Catalysts 2016, 6, 164
31.
32. 33. 34.
35.
36. 37.
38.
39.
40. 41.
42. 43. 44.
14 of 14
Prieto, G.; Shakeri, M.; de Jong, K.P.; de Jongh, P.E. Quantitative relationship between support porosity and the stability of pore-confined metal nanoparticles studied on CuZnO/SiO2 methanol synthesis catalysts. ACS Nano 2014, 8, 2522–2531. [CrossRef] [PubMed] Van Der Grift, C.J.G.; Elberse, P.A.; Mulder, A.; Geus, J.W. Preparation of silica-supported copper catalysts by means of deposition-precipitation. Appl. Catal. 1990, 59, 275–289. [CrossRef] Toupance, T.; Kermarec, M.; Louis, C. Metal particle size in silica-supported copper catalysts. Influence of the conditions of preparation and of thermal pretreatments. J. Phys. Chem. B 2000, 104, 965–972. [CrossRef] Huang, Z.; Cui, F.; Xue, J.; Zuo, J.; Chen, J.; Xia, C. Cu/SiO2 catalysts prepared by hom- and heterogeneous deposition–precipitation methods: Texture, structure, and catalytic performance in the hydrogenolysis of glycerol to 1,2-propanediol. Catal. Today 2012, 183, 42–51. [CrossRef] Zhang, B.; Hui, S.; Zhang, S.; Ji, Y.; Li, W.; Fang, D. Effect of copper loading on texture, structure and catalytic performance of Cu/SiO2 catalyst for hydrogenation of dimethyl oxalate to ethylene glycol. J. Nat. Gas Chem. 2012, 21, 563–570. [CrossRef] Khodakov, A.Y.; Lynch, J.; Bazin, D.; Rebours, B.; Zanier, N.; Moisson, B.; Chaumette, P. Reducibility of cobalt species in silica-supported Fischer–Tropsch catalysts. J. Catal. 1997, 168, 16–25. [CrossRef] Praliaud, H.; Mikhailenko, S.; Chajar, Z.; Primet, M. Surface and bulk properties of Cu–ZSM-5 and Cu/Al2 O3 solids during redox treatments. Correlation with the selective reduction of nitric oxide by hydrocarbons. Appl. Catal. B 1998, 16, 359–374. [CrossRef] Trouillet, L.; Toupance, T.; Villain, F.; Louis, C. In situ characterization of the coordination sphere of Cu II complexes supported on silica during the preparation of Cu/SiO2 catalysts by cation exchange. Phys. Chem. Chem. Phys. 2000, 2, 2005–2014. [CrossRef] Munnik, P.; Wolters, M.; Gabrielsson, A.; Pollington, S.D.; Headdock, G.; Bitter, J.H.; de Jongh, P.E.; de Jong, K.P. Copper nitrate redispersion to arrive at highly active silica-supported copper catalysts. J. Phys. Chem. C 2011, 115, 14698–14706. [CrossRef] Ryu, S.K.; Lee, W.K.; Park, S.J. Thermal decomposition of hydrated copper nitrate [Cu(NO3 )2 ·3H2 O] on activated carbon fibers. Carbon Sci. 2004, 5, 180–185. De Dobbelaere, C.; Mullens, J.; Hardy, A.; Van Bael, M.K. Thermal decomposition and spectroscopic investigation of a new aqueous glycolato(-peroxo) Ti(IV) solution–gel precursor. Thermochim. Acta 2011, 520, 121–133. [CrossRef] Farrauto, R.J.; Bartholomew, C.H. Evironmetnal catalysis: Mobile souces. In Fundamentals of Industrial Catalytic Processes; Wiley: New York, NY, USA, 2004; pp. 705–741. Meynen, V.; Cool, P.; Vansant, E.F. Verified syntheses of mesoporous materials. Microporous Mesoporous Mater. 2009, 125, 170–223. [CrossRef] Smeulders, G.; Meynen, V.; Silvestre-Albero, A.; Houthoofd, K.; Mertens, M.; Silvestre-Albero, J.; Martens, J.A.; Cool, P. The impact of framework organic functional groups on the hydrophobicity and overall stability of mesoporous silica materials. Mater. Chem. Phys. 2012, 132, 1077–1088. [CrossRef] © 2016 by the authors; licensee MDPI, Basel, Switzerland. This article is an open access article distributed under the terms and conditions of the Creative Commons Attribution (CC-BY) license (http://creativecommons.org/licenses/by/4.0/).