Oct 23, 2009 - compression by moment feature includes converting the RGB model system to ... 1) Load BMP image and put it in (R,G,B) arrays (i.e., three 2D ...
(IJACSA) International Journal of Advanced Computer Science and Applications, Vol. 6, No. 5, 2015
Comparison Fractal Color Image Compression using YIQ and YUV Color Model Eman A. Al-Hilo
Rusul Zehwar
Physics Department/ College of Education for Girls Kufa University/ Iraq
Physics Department/ College of Education for Girls Kufa University/ Iraq
Abstract—The principle of fractal image coding is that the image converges to a stable image by iterating the contractive transformations on an arbitrary initial image. This algorithm Partition the image into a number of range blocks and domain blocks. For every range block, the best matching domain block is searched for among all domain blocks by performing a set of transformations on each block. For color image compression, the Fractal coding is applied on different planes of color image independently by treating each plane as gray level image. The coordinate systems used for color image are RGB, YIQ and YUV. To encode a color image the main idea is to divide the image into its three different layers or components (RGB, YIQ and YUV). It is then possible to compress each of these layers separately, handle each of the layers as an independent image. In this paper the data of the color component (R,G,B) are transformed two times in two program separately, ones for YIQ and other for YUV color space. The results show that using (YUV) color space is more useful and efficient than using YIQ in fractal image compression, where PSNR increase 0.1% , CR increase 0.31% and ET decrease 2.321%. Keywords—Compression image; fractal compression and iterated function system
I.
color
image
INTRODUCTION
Colors are important for human for communicating with the daily encountered objects as well as his species, these colors should be represented formally and numerically within a mathematical formula so it can be projected on device computer storage and applications, this mathematical representation is known as color model that can hold the color space, by the means of color’s primary components (Red, Green, and Blue) the computer can visualizes what the human does in hue and lightness. Most of these techniques reduce the redundancies between color components by transforming the color primaries into a decorrelated color model such as YUV and YIQ. [1] The YIQ color space has been used in NTSC (National Television System Committee) color TV system and has been employed in USA, Canada, Japan and Korea. The Y stands for luminance components, and I and Q stand for chrominance information for representing color. [2] RGB values can be transformed to YIQ color space using equation (1), while YIQ values can be converted back to RGB using equation (2). [3,4]
[ ]
[
] [ ]……………..(1)
[ ]
[
] [ ]….…………(2)
The YUV color space defines is a term of one luminance (Y channel) and two chrominance components (UV channels).U represents the color difference between blue signal and luminance (B−Y) and V represents the difference between red and luminance (R−Y). RGB values can be transformed to YUV color space using equation (3), while YUV values can be converted back to RGB using equation (4). [3,4] [ ]
[
] [ ] ,...............…(3)
This is the inverse matrix to get the RGB components out of the YUV color: [ ]
[
] [ ] ,...…………(4)
Many researches study the color image compression. Porat [2001] study the effect of intercolor correlation on color image compression. He has been compare color compression techniques that take advantage of this inter color correlation. Most of these techniques reduce the redundancies between color components by transforming the color primaries into a de correlated color space, such as YIQ or YUV. [5] Kasambe and Patel [2007] they have to provide a method that uses genetic algorithms to speed up. The coordinate systems used for color image are RGB, YIQ and YUV. The time required for the account in fractal image compression with acceptable Image quality for color and gray scale images. [2] Al-Hilo [2007] has studied speeding fractal color image compression by moment feature includes converting the RGB model system to YUV model and minimize of the rang of U and V because of most of the image data are concentrated in the range of Y [6]
112 | P a g e www.ijacsa.thesai.org
(IJACSA) International Journal of Advanced Computer Science and Applications, Vol. 6, No. 5, 2015
(2)
II. MATCHING PROCESS After the generation of the range and domain pools; one takes each range block listed in the range pool and map it with all the domain blocks listed in the domain pool. At each mapping instance one determines the mapping coefficients, i.e., scale (s) and offset (o), which are called the IFS coefficient. These parameters (s) and (o) are determined by applying the least sum X2 of square errors between ri′ and ri according to following equation: [7] ∑ The minimum of
……………...…….…(5)
The domain must be partitioned into overlapping blocks, using specific step size, to generate the domain blocks (d1,…,dn). They should have the same size of range blocks. d) Searching: (1) Pick up a domain block from the domain pool. (2) Perform one of the isometric mappings. (3) Calculate the scale (s) and offset (o) coefficient using equations (7-8). (4) Apply the following condition to bound the value of (s) and offset (o) coefficient:
occurs when:
If s< smin then s=smin
….…………………....(6)
and
Else if s >smax then s=smax If o< omin then o=omin
Substituting equation (5) in (6) and using equations (7) one gets: ∑
∑ ∑
∑ (∑
……………….….. (7)
)
Else if o >omax then o=omax (5) (6)
∑
∑
∑
∑
[∑
(∑
∑
∑
…. ……….......(8)
)
∑
(7)
∑ ]………......(9)
∑
sopt=is; oopt=io, χ2min= χ2
where, di is the ith pixel value of the matched domain block.
PosI=domain block index
ri is the ith pixel value of the range block. n is the number of pixels in each block (i.e. the block size).
Sym=symmetry index
III. ENCODING TECHNIQUE The implementation encoding summarized by the following steps:
method
Quantize the value (s) and offset (o) using equations (7-8). Compute the approximation error (χ2) using equation (9). After the computation of IFS code and the sum of error (χ2) of the matching between the range and the tested domain block., the (χ2) is compared with registered minimum error (χ2min); such that: If χ2< (χ2min) then
End if could
be
If χ2min < then the search across the domain blocks is stopped, and the registered domain block is considered as the best matched block (9) Repeat steps (4) to (10) for all symmetry states of the tested domain block. (10) Repeat steps (3) to (11) for all the domain blocks listed in the domain pool. (11) The output is the set of IFS parameters i.e., is , io , posI , Sym which should be (8)
1) Load BMP image and put it in (R,G,B) arrays (i.e., three 2D arrays). 2) Convert (R,G,B) arrays to (Y,I,Q) arrays in first program and convert to (Y,U,V) in second program. 3) Down sample (I and Q) to quarter of its original size in first program and to to (U and V) in second program. 4) For each component (i.e., the original Y, and the down sampled (I,Q) for first program and (the original Y, and the down sampled (U,V) for second program) do: a) Establish the range array b) Down sample the range image to produce the domain array. c) Partitioning: (1) The range array must be partitioned into nonoverlapping fixed blocks, to generate the range blocks (r1,….,rn).
registered as a set of fractal coding parameters for the tested range block. (12) Repeat steps (1) to (12) for all range blocks listed in the range pool (13) Store all IFS mapping parameters as an array of record. The length of this array is equal to the number of range blocks in the range pool.
113 | P a g e www.ijacsa.thesai.org
(IJACSA) International Journal of Advanced Computer Science and Applications, Vol. 6, No. 5, 2015
IV. DECODING TECHNIQUE
V. TESTS RESULTS
The decoding process by YIQ and YUV model can be summarized in the following steps:1) Generating arbitrary domain pool. The domain pool could be initialized as a blank image or a piece of image extracted from any available image. 2) The values of the indices of (is) and (io) for each range block should be mapped to reconstruct the quantized values of the scale (sq) and offset (oq) coefficients. This step is called the dequantization step. 3) Choosing the number of possible iterations, and the threshold value of the mean square error (TMSE). At each iteration the following steps are performed: a) For each range block one determines the coordinates (xd, yd), of the best matched domain, from the IFS parameters (posI), in order to extract the domain block (d) from the arbitrary domain image. b) For each range block, its approximation ri′ is obtained by multiplying the corresponding best matched domain block (d) by the scale value (sq) and adding to the result the offset value (oq), according to equation:.
This work is carried out in Visual Basic 6.0 version on Laptop (hp): intel (R) Core (TM) i5-2430M CUP @ 2.40 GHz Processor, 64-bit Operating System and 6.00 GB RAM. To evaluate the performance of the established colour FIC system by YIQ and YUV model, the proposed system has been tested using Lena image (256x256 pixel, 24bits) as test image. These tests explore the effect of the following coding parameters on the compression performance parameters of the established system of YIQ color space and YUV color space: A. Maximum and Minimum Scale Tests This set of tests was conducted to study the effect of MinScale, and MaxScale on the compression performance parameters of the reconstructed image in YIQ and YUV models. Table (1) and (2) show the effects of this test on compression performance parameters for YIQ and YUV respectively. TABLE I. EFFECTS OF MAXSCALE AND MINSCALE ON THE COMPRESSION PERFORMANCE PARAMETERS USING (YIQ) COLOR MODEL MaxScale
………………..…...............................….(10) 1
c) The generated block is transformed (rotated, reflected, or both) according to its corresponding IFS symmetry parameter value (Sym). d) The generated block is placed in its position in the decoded image array (range image). e) Checking whether there is another range block, if yes then steps (b,c,d) are repeated. f) Down sampling the reconstructed image (range pool) in order to produce the domain pool by using the averaging (or integer) sampling. g) Calculating the mean square error (MSE) between the reconstructed range and the previous reconstructed range image. If the MSE is greater than (TMSE) value then the iteration continued and the above steps (a-f) should repeated; this iteration is continued till reaching the attractor state (i.e.; the newly reconstructed range image is very similar to the previous reconstructed image), otherwise the iteration continue till reaching the predefined maximum number of iterations (m), in our program used (m=20). 4) The above (steps 3a-3g) should be implemented upon the three components (Y,I,Q in first program and Y,U,V to second program) to produce the attractor of each component. 5) Converting the reconstructed (YIQ color components in first program and YUV in second program) to RGB components sing the inverse (YIQ and YUV) transform equations respectively (2,4). 6) Calculating the fidelity criteria for each RGB component, then determines the overall value of the fidelity criteria for the RGB reconstructed image.
2
3
MinScale -1 -1.5 -2 -2.5 -3 -1 -1.5 -2 -2.5 -3 -1 -1.5 -2 -2.5 -3
PSNR 30.85 30.94 30.94 30.92 30.90 31.02 31.05 31.03 31.02 31.01 31.04 31.04 31.05 31.04 30.98
CR 8.73 8.73 8.73 8.73 8.73 8.73 8.73 8.73 8.73 8.73 8.73 8.73 8.73 8.73 8.73
ET(sec) 54.65 54.34 54.26 54.46 53.96 54.99 54.17 54.36 53.99 54.97 54.25 54.19 54.76 56.56 55.27
TABLE II. EFFECTS OF MAXSCALE AND MINSCALE ON THE COMPRESSION PERFORMANCE PARAMETERS USING (YUV) COLOR MODEL MaxScale
1
2
3
MinScale -1 -1.5 -2 -2.5 -3 -1 -1.5 -2 -2.5 -3 -1 -1.5 -2 -2.5 -3
PSNR 30.93 31.02 31.02 31.02 31.02 31.11 31.14 31.15 31.15 31.12 31.11 31.13 31.14 31.13 31.13
CR 9.04 9.04 9.04 9.04 9.04 9.04 9.04 9.04 9.04 9.04 9.04 9.04 9.04 9.04 9.04
ET(sec) 58.59 57.98 57.72 58.33 57.52 57.75 58.10 57.50 57.87 57.91 58.83 58.41 57.64 55.33 58.33
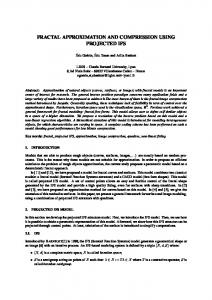
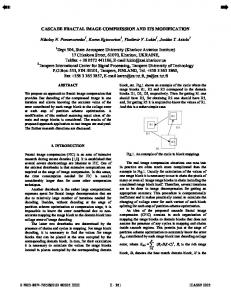
1) Step Size Tests In this set of tests the effect of the shift StepSize parameter is studied. Figures (1) and (2) show the effects of this test using YIQ and YUV models respectively.
114 | P a g e www.ijacsa.thesai.org
(IJACSA) International Journal of Advanced Computer Science and Applications, Vol. 6, No. 5, 2015 Original image
StepSize (1)
StepSize (2)
StepSize (3)
StepSize (4)
Original image
DomSize (128x128)
DomSize (64x64)
DomSize (32x32)
DomSize (16x16)
PSNR CR ET
31.5 8.73 208.23
31.05 8.73 53.45
30.71 8.73 24.08
30.48 8.73 14.20
PSNR
31.05
30.49
29.49
27.80
CR
8.73
8.73
8.73
8.73
ET
53.75
13.24
3.48
1.14
Fig. 1. Effect of StepSize parameter on the compression performance parameters using (YIQ)
Fig. 5. The effects of DomSize on the compression performance parameters using YIQ
Original image
StepSize (1)
StepSize (2)
StepSize (3)
StepSize (4)
Original image
DomSize (128x128)
DomSize (64x64)
DomSize (32x32)
DomSize (16x16)
PSNR
31.60
31.15
30.83
30.57
PSNR
31.15
30.55
29.95
27.85
CR ET
9.04 223.88
9.04 54.68
9.04 24.69
9.04 14.46
CR
9.04
9.04
9.04
9.04
ET
54.85
13.68
4.56
1.23
Fig. 2. Effect of StepSize parameter on the compression performance parameters using (YUV)
Fig. 6. The effects of DomSize on the compression performance parameters using YUV
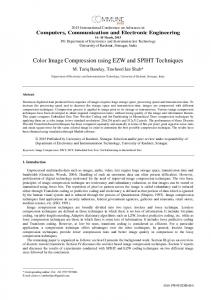
2) Block Size Tests This set of conducted tests aimed to investigate the effects of the BlockSize parameter on the compression performance parameters. Figures (3) and (4) show the effects of this test using YIQ and YUV models respectively.
3) Domain Size Tests This set of tests was performed to define the effect of the DomSize on the compression parameters. Figures (5) and (6) show the effects of this test using YIQ and YUV models respectively
Original image
BlockSize (2×2)
BlockSize (4×4)
BlockSize (8×8)
BlockSize(16×16)
4) Permissible Error Value (εo) Tests This set of tests was performed to study the effects of permissible error level (εo) on the compression performance parameters. Tables (3) and (4) show the effects of this test using YIQ and YUV models respectively
PSNR CR ET
34.32 2.04 30.68
31.05 8.73 53.57
27.15 37.46 31.27
23.68 161.68 24.17
TABLE III. EFFECTS OF PERMISSIBLE ERROR VALUE (Ε) ON THE COMPRESSION PERFORMANCE PARAMETERS USING (YIQ)
Fig. 3. Effects of BlockSize parameter on the compression performance parameters using (YIQ) Original image
BlockSize (2×2)
BlockSize (4×4)
BlockSize (8×8)
BlockSize(16×16)
PSNR CR ET
28.80 2.11 101.70
31.15 9.04 57.62
27.19 38.89 31.34
23.68 168.32 23.59
Fig. 4. Effects of BlockSize parameter on the compression performance parameters using (YUV)
εo 0.1 0.2 0.3 0.4 0.5 0.6 0.7 0.8 0.9 1 2 3 4 5
PSNR 31.048 31.048 31.048 31.047 31.048 31.047 31.045 31.044 31.041 31.033 30.826 30.367 29.959 29.534
CR 8.73 8.73 8.73 8.73 8.73 8.73 8.73 8.73 8.73 8.73 8.73 8.73 8.73 8.73
ET(sec) 54.72 55.36 54.49 54.27 54.27 53.62 55.33 55.00 51.67 50.32 33.21 20 14.22 10.10
115 | P a g e www.ijacsa.thesai.org
(IJACSA) International Journal of Advanced Computer Science and Applications, Vol. 6, No. 5, 2015 TABLE IV. Original image
SHOWS THE DIFFERENT BETWEEN YUV, YIQ MODEL FOR LENA IMAGE YIO
TABLE VI. EFFECTS OF PERMISSIBLE ERROR VALUE (Ε) ON THE COMPRESSION PERFORMANCE PARAMETERS USING (YUV)
YUV
εo Percentage Error %
PSNR
31.05
31.15
Increase 0.10%
CR
8.73
9.04
Increase 0.31%
ET
53.75
57.62
increase 2.23%
TABLE V. Original image
SHOWS THE DIFFERENT BETWEEN YUV, YIQ MODEL FOR SUN CHILD IMAGE YIO
YUV
Percentage Error %
PSNR
35.2
36.32
Increase 1.12%
CR
8.73
9.04
Increase 0.31%
ET
51.48
55.14
Increase 3.66%
VI. CONCLUSIONS
[1]
[2] [3]
The results indicate that using YUV model is more efficient than YIQ model as in following: 1) The PSNR is increase 0.10% in YUV model than in (YIQ) model. 2) The CR is increase 0.31% than in YUV model than in (YIQ) model. 3) The ET parameter in the (YUV) is increase 2.23% than in (YIQ) model. Table (5) and (6) summarizes the results for Lena and sun child image respectively.
[4] [5] [6]
[7]
0.1
PSNR 31.1466
CR 9.04
ET(sec) 53.68
0.2
31.1465
9.04
54.95
0.3
31.145
9.04
54.41
0.4
31.144
9.04
54.26
0.5
31.140
9.04
56.67
0.6
31.142
9.04
55.59
0.7
31.140
9.04
54.54
0.8
31.136
9.04
57.74
0.9
31.133
9.04
51.00
1
31.120
9.04
50.72
2
30.862
9.04
33.42
3
30.151
9.04
20.19
4
29.540
9.04
14.19
5
28.994
9.04
5.05
REFERENCES Ibraheem, N., Hasan, M., Khan, R., Mishra, P., " Understanding Color Models: A Review", ARPN Journal of Science and Technology, VOL. 2, NO. 3, April 2012. Kasambe p.v. and Patel M., "Modified Fractal Image Compression Using Genetic Algorithms", Mumbai, India, Vol. 1, 134, 2007. Ford A., Roberts A., "Color Space Conversions", August11, 1998(b). González J. M. C., Rodríguez M. A. V., Pulido J. A. G., and Pérez J. M. S., "Digital Signal Processing", Available online 23 October 2009. Porat M., "The Effect of Inter Color Correlation on Color Image Compression", M.Sc., Electrical Engineering, January 2001. Al-Hilo, E.A., "Speeding-up Fractal Colored Image Compression using Moments Features", PhD Thesis, College of Science, AL-Mustansiriyah University, Baghdad, 2007. Fisher, Y., "Fractal Image Compression Theory and Application", Book, University of California, Institute for Nonlinear Science, Springer-Verlay, New York, Inc, 1995.
116 | P a g e www.ijacsa.thesai.org