2012 IEEE Conference on Sustainable Utilization and Development in Engineering and Technology (STUDENT) Universiti Tunku Abdul Rahman, Kuala Lumpur, Malaysia. 6 - 9 October 2012
Comparison of Boiler Plant Model and Real Plant Responses Based on Proportional Integral Controller
Abdulrahman A.A. Emhemed
Rosbi Bin Mamat
Dirman Hanafi
Department of Automatic Control Engineering
Faculty of Electrical Engineering Universiti Teknologi Malaysia Johor, Malaysia
[email protected]
Faculty of Electrical Engineering Universiti Tun Hussein Onn Malaysia Batu Pahat, Malaysia
[email protected]
College of Electronics Technology Bani WAlid, Libya
abdo
[email protected] _
Abstract-System model is very useful to study the response of a system for different input variations and for the control design schemes in both real time application and in the simulation. The concept of a model refers to entities varying from mathematical descriptions of a process to a replica of an actual system. The model of a boiler plant is derived and compared to the real plant response. In this paper the proportional and Integral (PI) controller applied for controlling the real and model of a boiler plant. The boiler plant model is derived based on the boiler plant dynamics.
The experimental results show that the model
developed able to represent the real boiler plant dynamic which proves by the similarity of the PI controller responses for both.
Keywords- System model, real boiler plant, PI control
I.
INTRODUCTION
There are many models of drum-boilers in literature [1,2]. In this paper the mass and heat balance equations are created from real plant. The main purposes of the paper are to modeling and simulate the control liquid level in the boiler and describe temperature which is heated in the boiler. Essentially, this paper consist of two control loops, firstly the loop that PI controls the liquid level in the boiler, and secondly the loop that ON-OFF control the liquid temperature in the boiler. By comparing the experimental results from the plant with those obtained from the simulation model the accuracy of the model can be evaluated. II. BOILER PLANT DESCRIPTION The purpose of the boiler in the plant is to heat up the liquid inside the boiler at about 70°C. Fig. I shows the schematic diagram of the boiler plant. Initially, the liquid inflow into the boiler Til and the outflow is pumped through pump P11. The inflow of the liquid is measured by the flow transducer and transmitted by the transmitter FTI2. Valve LCVII controls the manipulated variable (the inflow rate) to the boiler. This is to ensure that the controlled variable (the liquid level) in the boiler drum always approaches the set point [3].
�WJ
,-----------------
'"
Figure I. Level and temperature control loops of boiler drum.
III.
DYNAMIC PROCESS MODEL OF THE
BOILER
The differential equation of level depends on the accumulation of mass as below Accumulation = Mass inflow rate - Mass outflow rate. dM dt =p[fi(t) - fo(t)]
(1)
dM is the rate accumulation of mass kg/sec, fi(t)is dt inflow rate into the boiler cmo /sec , fo(t) is outflow rate from the boiler cm3/sec, p is the liquid density kg/cm3. Mass of liquid is given by Where,
0
M=pXV
(2)
Then mass balance become as
978-1-4673-1705-4/12/$31.00 ©2012 IEEE
117
pA
d
:;t) = p[fi(t) -fa(t)]
(3)
Where, V is the volume of the boiler cm3, A is the cross area of the boiler cm2, H(t) is the liquid level in the boiler cm. The liquid outflow from the boiler depends on the pump P11, therefore the liquid outflow is always at constant flow rate. Equation (4) represents the liquid flow rate. A
d
:;
t
) = fi(t)
O=fi-fo
(5)
Where 1; represent the constant inflow rate into the boiler. Subtracting equation (5) from equation (4) yields d(
h
�:-h) = [fi(t) - 1;] -[To - To ]
(6)
Where, h is the constant level.
dTo(t dt
) = fin (t)[T n(t)- T (t )] t 0 AH
fin(t) = fi(t)
To(s) = - -[T in(S)- T o(s)] A,H,s fin (s)
1
IV.
The boiler plant consists of two loops, firstly level control loop and second temperature control loop. A.
Boiler Level Control Loop
The liquid level in the boiler is measured by the level transducer and transmitted by the level transmitter Gt then the result is compared with the set point. The difference between the set point and the measured output produces an error signal (Error set point - feedback). The controller uses this error to make an appropriate decision whether to open or close the valve (LCVl l ) in order to control the water flow rate into the boiler. =
The control loop block diagram is shown by Fig. 2. LCV11
(7)
- 1;
(8) LTll
Substitute equation (7) and equation (8) into equation (4) and the level of the boiler is yields as dt
_
fin (t) A
fin (5)
1
A5
-p.fa(t). To
d(H,T)
A--;:u- = p·fin(t). Tin - p·fo(t)· To d t d t +AH T( )=f"in (t).Tm(t)-f,.T(t) A H( )T(t) o o dt 0 dt
(11) (12) (13)
Now if we combine equation (13) with equation (9), we get equation (14).
Gain for conversion the level to voltage" GHV" : GHV =
(10)
Temperature equation can be obtained from heat balance equation [5] as the following formula
;
Where, the parameters of the boiler plant control system above are determined as below •
Where, R(s) is the Laplace transform water level height of the boiler and fin (s) is the Laplace transform inflow rate of the boiler which is defined in the form of transfer function.
d ,T t = p.fin(t). Tin
Figure 2. The level control loop of boiler drum.
(9)
Laplace transform of equation (9) is dH(5)
(16)
BOILER PLANT CONTROL
Where, H(t) is the liquid level height of the boiler and fin(t) is the inflow rate of the boiler.
dH(t )
(15)
By taking Laplace transform equation (15) become
So, the deviation variables are as below H(t) = h(t) - h
(14)
Then, the temperature equation is as below
(4)
- To
Where, fa is the constant outflow rate. In a steady-state condition, the inflow and outflow rates are constant. In this situation, the constant inflow and outflow cause the level of the boiler to be at a constant level. Therefore, the rate of accumulation of mass in the boiler is zero as shown in equation (5), which is a steady-state mass balance on the contents of the boiler[2,4].
A
dT(t) +AH ---;u = fin (t).Tin (t)- fa· T(t) (fin (t)-fa)T(t) o o
output range"voltage" ..2.:!.... 4 = = 0.0 V/em input range"Level" 100-0
•
Gain for conversion the voltage to current" GVi" : ' output range"current " 20-4 4 GVi = = = mA/V input range"voltage" 5-1
•
Gain current to pressure converter" GIIP": 4p i GIIP = 0.7 s = 0.0527 kg/em2.mA
•
Gain transmitter "Gt":
•
Gain Valve" Gv. Level" :
rnA
Gt = 0.16 mA/em
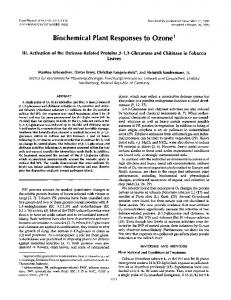
The inflow into the boiler drum is controlled by valve LCVl l , which is a linear valve. Fig. 3 illustrates the simulation responses for relation between valve position (%) and flow rate (em3 /see ). By calculating the slope of the curve we get the level control valve variable (Gv. Level)
118
Valveflowrale
Versus
Valve%
"VALVE LCV11"
1600 1400 1200 1000 800 600 400 200
30
40
50
60
70
80
90
100
valveopening(%)
Figure 3. The valve flow rate vs. valve position
B. Boiler Temperature Control Loop The water in the boiler is heated by the heater which is controlled by an ON-OFF relay switch. The hot temperature liquid in the boiler is pumped out to heat exchanger by pump P11. The block diagram of this control is represented by Figure 4.
Figure 4. The temperature control loop of boiler drum.
Where, the parameters of the controller block diagram above are defIned as following •
Gain for conversion between the temperatures to voltage Grv
•
output range"voltage"
=
input range"temperature"
=
5- 1 _ a
75
=
0.053 V Ie
Gain for conversion between the voltages to current" GVi ":
. output range"current " 20-4 4 Gv = = = mAjV , input range"voltage" 5-1 •
Gain transmitter" Gt" :
Gt =
C.
current - mA
4
20 =-- =0.213mAjC ° Temperature - CO 75 - 0 ON/OFF Controller Scheme
An ON/OFF controller is the simplest form of temperature control device. The output from the device is either ON or OFF, with no middle state. An on-off controller will switch the output only when the temperature crosses the set point. For heating control, the output is on when the temperature is below the set point, and off above set point. Since the temperature crosses the set point to change the output state, the process temperature will be cycling continually, going from below set point to above, and back below [3]. There electric heater and the temperature control of the liquid are controlled using ON/OFF controller. The temperature sensor is TEll and controller is TC. The temperature is controlled in order not upper than 70 C o.
Figure 5. The ON-OFF temperature response of boiler drum.
V.
PROPORTIONAL PLUS INTEGRAL CONTROL
The proportional control mode produces a change in the controller output proportional to the error signal. Proportional action is the correction action of the valve position that is directly proportional to deviation between the actual values with desired value and the error proportional band is given by equation (17). Proportional Band%
Error
=
desired value
.
valve position correction
X
100
(17)
The integral mode is frequently combined with the proportional mode to provide an automatic reset action that eliminates the proportional offset. The combination is referred to as the proportional plus integral (PI) control mode. The integral mode provides the reset action by constantly changing the controller output until the error is reduced to zero. The proportional mode provides change in the controller output that additional change in the output that is proportional to the integral of the error signal. The reciprocal of integral action rate (I) is the time required for the integral mode to match the change in output produce by the proportional mode. One problem with the integral mode is that it increases the tendency for oscillation of the controller variable. The gain of the proportional controller must be reduced when it is combined with the integral mode. This reduces the ability of controller to respond to rapid load changes. If the process has a large dead time lag, the error signal will not immediately reflect the actual error in the process. This delay often results in overcorrecting by the integral mode that is the integral mode continues to change the controller output after the error is actually reduced to zero, because it is acting on signals. The proportional plus integral control mode is used on processes with large load changes when the proportional mode along is not capable of reducing the offset to an acceptable level. The integral mode provides a reset action that eliminates the proportional offset. The time domain equation of the proportional plus integral mode [3,6,9] is as equation (18).
l1MV(t) =kc e(t) +
(
� f; e(t)dt)
(18)
I
By taking Laplace transform for equation (18) MV (s) = k 1 +.2... c E (s) TiS
(
)
(19)
The step in the control variable is U = 45% from uO = 20% to 65%. Where, L=IO.5 sec and R can be calculated from the slope of the level response. From Fig. 6 we will fInd that the level increases approximately 25% during 79 sec, giving a
119
slope of R = 0.32 %/sec. Using these values for L and R in Table I gives the following PI parameters:
k c - 12', T"I - 34.7sec,. PB
100
-
k;
100_8
-
33o/to. U- '
Table 1 represents the value of PID controller gain related with Fig. 6 below [10]. TABLE I. Ziegler-Nucleus for Transient Response Controller
Kc
1
P
Ti
Td
00
0
LR/U 0.9
PI
LRIU 1.2
PID
LR/U
3.3L 2L
0
VI.
RESULTS AND DlSSCUSION
After run the simulation and the results are compared with the real plant response at same parameters of PI controller that it has been installed on the boiler QAD MODEL921 .The comparison of the level (cm) is shown by Fig. 7. The behavior of the level 1 (20-40 cm) is overshoot existed more than (40-55 cm) because first higher is (20 cm) more than second higher (15 cm) ,but forth higher(20 to 55 cm=35cm) is more overshoot than first and second higher but third higher (55 to 20 cm) is the morest overshoot ,because the response is started from highest value dropped to the lower all that for both cases real time and simulation responses, and the (in lout-flow rate) by (cm3/sec) response show in Fig. 8.
O.5L
Equation (19) is a transfer function for designed PI controller and this equation will be used to form another type of simulation model for the plant. (20) Figure 7. Comparison real result with simulation result of level of boiler plant.
By using equation (17) and (20) and Fig. 6(a) we can get values of PB and Ti. PB=8% ; Ti = 35 sec. Flo"" in
--. ...e---
Level
-Fin - - -
•
@PB-