a 5% of bit rate saving can be achieve for luminance component, especially for 720p ... used in previous video standards, like the variable block size used in the ...
1
Comparison of compression performance of 10-bit vs. 8-bit depth, under H.264 Hi422 Profile Ruiz C. Damian, Srdjan Sladojevic, Dubravko Culibrk, Gerardo FernandezEscribano Abstract—H.264 is one of the first video coding standard incorporating coding formats with bit-depth above 8 bits. This paper presents the results of compression comparison tests for the H.264 “High 422” profile, between 10-bits and 8-bit sample depths. The simulations were run on five 720p and 1080i high definition sequences. PSNR and SSIM metrics were used to evaluate the objective quality performance of both bit-depth, and with the aim to enable a fair comparison, both metrics was computed with 10-bit precision, up-scaling the 8-bit decoded sequences to 10-bits. Some works have been published in this field based on the evaluation of commercial 10-bits H.264 implementations. In this work we carry out a neutral evaluation of H.264 standard performance, using the official H.264 Reference Software. Unlike expected 10-bits coding gain, the results show unnoticeable differences between both sample depth in terms of objective quality, lower 0.1dB for PSNR and 0.002 for SSIM, with a 5% of bit rate saving can be achieve for luminance component, especially for 720p format, and negligible quality improvement for Y and V chroma components. Keywords—H.264, Fidelity Range Extensions, Internal Bit Depth Increase, Bit-depth, contouring, banding artifacts High 422 Profile.
I. INTRODUCTION
A
VC/H264 coding standard represents today the state of the art in video coding, for both, user consume and professional environment. Although its complexity is greater than that shown in previous standards, like MPEG-2, and MPEG-4 Part 2, the H.264 bit rate savings are greater than 50%, for same perceptual quality, specially for the new high definition formats. The high coding efficiency of H.264 has been achieved through the introduction of new tools like a new Intra-frame prediction, in-loop filter, new high efficient entropy coding (CABAC), and the improvement of the already tools used in previous video standards, like the variable block size used in the motion estimation, the 4x4 and 8x8 integer DCT transforms, the use of hierarchical B frames. The advantages that H.264 standard offered to multimedia and broadcasting services, arose the development of new professional profiles, known as FRExt [2], targeted for live contribution services, media edition, and storage and archiving.
These new profiles allow the use of 10-bits depth, 4:2:2 chroma subsampling format, and all-intra coding scheme. It’s commonly accepted , that the use of bit-depth beyond 8 bits improve the subjective quality for no-compressed formats, preventing traditional distortions like contouring, banding artifacts or smearing for scenes with smooth areas. The 10-bits depth support has been also adopted for new video coding standard HEVC (High Efficiency Video Coding), recently approval by ITU-T and ISO [3][12], in January 2013. The compression standards, from the beginning, were designed with 8-bit depth encoding due to arduousness to perceive the subjective quality improvement that more than 8bits encoding could provide, under common visualization conditions. The tradeoff between quality and computational complexity of 10-bits sample depth, is not yet enough justified for professional environments. This work presents the results of compression comparison tests between 10-bis vs. 8-bit sample depth encoding using the H.264 High 422 Profile (Hi422), targeted for high definition format used for current contribution services. The simulations has been run using the JM 18.0 H.264 reference software [4], coding five original 10-bit@422 high definition sequences, from both 720p and 1080i format. It is well known, the PSNR (Peak Signal to Noise Ratio) metric, under certain circumstances, could not offer a good correlation with subjective quality. SSIM [5] metric (Structural Similarity Index) is accepted at scientific community like better perceptual quality approach than PSNR, and taking into the count the impact of 10-bits vs. 8-bits is largely in terms of perceptual quality, the SSIM metric is also computed in addition to PSNR in this work. The rest of this paper is organized as follows, FRExt H.264 profiles is presented in Section II. Then, in Section III we describe the test bed model and the methodology used to compute both metrics, including the 10-bits to 8-bits sample conversion and vice versa process. Section IV presents the simulations results in terms of PSNR, Rate and SSIM. Finally, the conclusions of this paper are presented at Section V.
2
II. PROFESSIONAL H.264 PROFILES AND FUTURE EVOLUTION Professional production and contribution media require a higher visual quality compared to those required at the end of the chain, just for user visualization. Typically, the production process suffers different post-production and editing stages. For this reason, a two or three times H.264 bit rate over diffusion bit rates (around 10Mbps for high definition formats) is required, as well as a 4:2:2 color subsampling scheme, to allow a high color fidelity performances. MPEG-2 [6] [7] was the first standard that included a profile supporting 4:2:2 subsampling chroma format, and it was widely accepted by the professional industry to store and exchange of audiovisual content. Similarly, the following standard, MPEG-4 Part 2 [8], included a new set of tools for professional applications, defining a “Studio Profile” to use in acquisition, edition and post-production applications. None of these standards supported formats beyond 8-bits depth. H.264 was the first to do it, supporting bit-depths even above 10bits, with its “FRExt Profiles” [9], including “High 10” and “High 422” profiles, subject of evaluation in this work. “High Profiles” family also add new improvements, like 8x8 Intra prediction, integer 8x8 DCT transform, and perceptual quantization matrix. These tools achieve a better subjective quality compared to basic profiles, but it is relevant to stand out 10-bit depth supporting is not considered like a new tool that improves coding efficiency, it is just an additional feature that those profiles offer [10]. In digital signal processing, is well known that increasing the internal arithmetic precision over the resolution of the incoming data, more accurate results can be achieved. This fact motivated the use of a new tool in video compression called IBDI (Internal Bit Depth Increase), increasing the processing internal precision above 8-bits. At [11] shows how using a 10-bits internal precision applied to H.264 for 720p format, can achieve a bit rate savings up to 5%, and up to 10% using 12 bits, compared to an arithmetic internal precision of 8-bits. That experiment works with inverse scenery to ours, where the input bit-depth is upscaled 2 bits, instead to subsample 2 bits, impacting in different way in terms of compression efficiency.
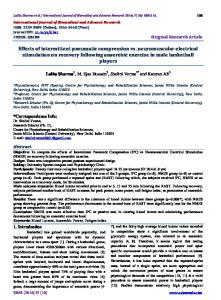
III. SIMULATIONS METHODOLOGY Fig. 1 depicts the encoding architecture used to carry out the simulations in this work, where the 10-bits source sequences are downscaling to 8-bits by rounding, saturating, and shifting right by 2 bits, and the inverse up-scaling process is applied to 8-bits
decoded sequences, performed by 2 bits left shifting and 2 less bit filling, following the procedure described in [13]. These procedures allow us to perform a fair evaluation of the PSNR and SSIM quality metrics, comparing sequences with the same bit-depth (10-bits), therefore both metrics will use a peak value of 1023 instead of 255 (8-bits), as is showed at (1).
This methodology represents a real contribution scenario with high fidelity, where original 10-bits sequences are downscaled to 8-bits previously to be 8-bit depth encoded (422@8b) stored and transmitted, and upscaled newly to 10bits at decoder side.
PSNR /SSIM 10b@10b
PSNR/SSIM 10b@10b
Sequence 10b
> 2
Sequence 8b
H.264 Hi422@8b
Fig. 1. Experiments architecture for 422@10b and 422@8b
The aim of this experiment is evaluate the coding performance of Hi422 profile of H.264, for 10-bits and 8-bits pixel depth sequences, and not to evaluate custom implementations [14][15]. For this reason, the whole simulations have been run using the AVC/H.264 reference software JM, version 18.0, available from [4].
3
IV. EXPERIMENTAL RESULTS Five original 10-bits@422 high definition sequences, widely used by the research community, have been used in this experiment, with a 10 second length each (500 frames for 720p50 and 250 frames for 1080i25). Four of them, CrowdRun, Ducks, IntoTree and ParkJoy are supplied by SVT [16], and the last one, Dancer, is available at [17], supplied by EBU (European Broadcasting Union), shown at fig 2.
Fig 2. HD sequences used in experiments (422@10b)
To run the simulations, the authors followed the Common Simulation Conditions, recommendations made by ITU-T in [18], for the analysis of H.264 coding of high resolution sequences, fitting them to the current professional scenario for live transmissions that use fix GOP, so Hi422 profile and GOP length 32 was used. Other relevant parameters used in this work, are shown at following Table 1: TABLE I COMMON SIMULATION CONDITIONS FOR H.264 Parameter CABAC BFrames PyramidCoding ExplicitPyramidFormat RDOptimization SearchRange UseFME NumberReferenceFrames QPISlice QPPSlice QPBSlice
Value On 7 3 b3r0b1r1b0e2b2e2b5r1b4e2b6e2 1 64 3 4 22, 27, 32, 37 23, 28, 33, 38 24, 29, 34, 39
To compute the objective difference between 422@10b and 422@8b simulations, we used the Bjøntegaard Delta methodology defined by ITU at [19], which computes the BDRate, BD-PSNR and BD-SSIM. This method calculates the average difference between two Rate-Distortion curves (Rate vs. PSNR or Rate vs. SSIM) “a” and “b”, fitting each of these curves through 4 data points obtained for each QP (22, 27, 32 and 37).The convention used in this work, implies that a negative BD-PSNR or BD-SSIM value means a lower quality performance of Hi422@8b regarding Hi422@10b, for the same bit rate, and therefore a positive value means a highest 8-bits coding performance. Concerning BD-Rate, a negative value means that, for the same quality, a lower bit rate is obtained from Hi422@8b
coding regarding Hi422@10b, consequently 8-bits depth gets a bit rate saving for the same 10-bits quality. BD-Rate is measure as a % of bit rate between bit rates of curve “a” and “b”.The following table shows the BD-PSNR and BD-Rate simulations results for 720p format: TABLE II BD-PSNR (720p50) PSNR 720p50 CrowdRun Ducks IntoTree ParkJoy Dancer TOTAL
Y BD-Rate (%)
-0.0918 -1.3139 -0.0225 -0.9126 0.1798 -0.43
U BD-PSNR (dB)
0.0020 0.0516 0.0014 0.0386 -0.0070 0.02
BD-Rate (%)
4.0450 1.1551 5.4909 0.3849 4.7290 3.16
V BD-PSNR (dB)
-0.0916 -0.0282 -0.0629 -0.0400 -0.1099 -0.07
BD-Rate (%)
4.0188 3.5450 8.4008 2.0398 7.2565 5.05
BD-PSNR (dB)
-0.0935 -0.0325 -0.0801 -0.0586 -0.1665 -0.09
Can be observed as the luminance component from first four sequences, shows a slight PSNR improvement for 8-bits coding, and hence a slight bit rate saves. Only the “Dancer” sequence shows an insignificant luminance improvement for 10-bit encoding. The average BD-PSNR performance for luminance component is negligible (0.02dB), with a small 0.43% of bit rate saving for 422@8b encoding. In the other hand, the results for chroma U and V chroma components, obtains a slightly better performance for 10-bits encoding, with also a negligible PSNR improvement (0.02 and 0.07dB) and a rate saving around 5%. Considering that U and V color component statistically spent significant fewer bits than luminance component from total encoded stream; no straight conclusions can be derived from bit savings (3% and 5% respectively) for color components. In order to appreciate the small difference between both bit depths coding, the fig. 2 depict a zoom of PSNR for luminance component of “Parkjoy” sequence, from 20Mbps to 35Mbps, those are a common bit rates used for HDTV contribution services. Figures 3, shows the global PSNR-Rate simulation results obtained from U component for Parkjoy sequence, where practically unnoticeable difference can be observed.
4 component (3.3% and 6.1%), achieve best performance for 10bits encoding. The Table V shows the 1080i25 SSIM-Rate results obtained for the components Y, U, V components, in which can be observed no noticeable SSIM difference, and only slight bit rate saving similar to 720p50 format. TABLE IV BD-PSNR results (1080i25) PSNR 1080i25
Fig. 2. PSNR-Y, ParkJoy@720p50, zoom from 20-35Mbps
CrowdRun Ducks IntoTree ParkJoy Dancer TOTAL
Y
U
V
BD-Rate (%)
BD-PSNR (dB)
BD-Rate (%)
BD-PSNR (dB)
BD-Rate (%)
BD-PSNR (dB)
-0.2208 0.2301 0.6380 -0.3607 -2.3228 -0.4072
0.0065 -0.0082 -0.0149 0.0105 0.0989 0.0186
3.4337 4.2152 8.3053 2.7265 -2.1784 3.3005
-0.0712 -0.0762 -0.0801 -0.0624 0.0517 -0.0476
3.0257 10.9798 12.3458 5.7560 -1.4362 6.1342
-0.0632 -0.0832 -0.0986 -0.0642 0.0359 -0.0547
TABLE V BD-SSIM results (1080i25) SSIM 1080i25 CrowdRun Ducks IntoTree ParkJoy Dancer TOTAL
Y
U
V
BD-Rate (%)
∆ SSIM
BD-Rate (%)
∆ SSIM
BD-Rate (%)
∆ SSIM
0.0975 0.0927 0.9010 0.2084 0.5702 2.3048
-0.0063 0.0002 -0.0006 0.0000 -0.0002 -0.0014
-0.5927 2.7838 9.2103 3.3945 4.0392 3.7670
0.0007 -0.0018 -0.0019 -0.0020 -0.0013 -0.0013
-4.1455 7.7800 15.2666 6.0989 6.1847 6.2369
0.0023 -0.0015 -0.0015 -0.0016 -0.0014 -0.0007
V. CONCLUSIONS Fig. 3. PSNR-U, ParkJoy@720p50
In analogous way, the 720p SSIM results are depicting on Table III, and similar trend can be derived. No noticeable quality differences are showed (lower than 0.003) between both 422@10b and 422@8b encoding profiles, and only a slight bit rate saving, 0.27% for luminance and 4% and 5% for color components, can be obtained from 10-bits depth coding. TABLE III BD-SSIM results (720p50) SSIM
Y
U
The experiment results revel that the hypothetical efficiency improvement obtained using 10-bits Hi422 profile against 8bits, is reduced to a no noticeable gain in terms of bit rate saving, but exclusively for color video components, round 5%, but not for luminance component. Even the most of the sequences, especially for 720p format, luminance component achieves better PSNR and bit rate saving figures. It is well known that the human visual perception system is more sensitive to luminance information that color one. Both quality metrics, PSNR and SSIM used in experiment, show a same trend, and it does not confirm that 10-bits H.264 coding offers a better perceptual quality than 8-bits sample depth coding, under these specific test conditions.
V
720p50
BD-Rate (%)
∆ SSIM
BD-Rate (%)
∆ SSIM
BD-Rate (%)
∆ SSIM
CrowdRun Ducks IntoTree ParkJoy Dancer TOTAL
0.3779 -0.2068 0.1029 0.6824 0.4334 0.2780
-0.0001 0.0004 0.0001 -0.0002 -0.0002 0.0000
6.7057 1.9941 5.6341 2.8037 3.2694 4.0814
-0.0056 -0.0015 -0.0017 -0.0019 -0.0011 -0.0024
6.9034 3.5571 8.8491 4.2846 4.6582 5.6505
-0.0047 -0.0010 -0.0013 -0.0016 -0.0013 -0.0020
Regarding 1080i format, Tables IV depicts the BD-PSNR and results, where over once more the luminance component obtain a slight best performance in terms of PSNR (0.4dB) and bit rate saving for 422@8b-bits encoding, and U and V color
REFERENCES [1]
[2]
[3]
[4]
Draft ITU-T Recommendation and Final Draft International Standard of Joint Video Specification (ITU-T Rec. H.264 | ISO/IEC 14496-10 AVC) Joint Video Team (JVT), Mar.2003, Doc. JVT-G050. Gary J. Sullivan, Pankaj Topiwala, and Ajay Luthra, “The H.264/AVC Advanced Video Coding Standard: Overview and Introduction to the Fidelity Range Extensions (FRExt),” SPIE Conference on Applications of Digital Image Processing XXVII, Special Session on Advances in the New Emerging Standard: H.264/AVC, August 2004. Benjamin Bross, Woo-Jin Han, Jens-Rainer Ohm, G. J. Sullivan, and Thomas Wiegand. High efficiency video coding (HEVC) text specification draft 6. Document JCTVCH1003 of JCT-VC, February 2012. ftp://standards.polycom.com/reference_software/
5 [5]
[6]
[7]
[8]
[9]
[10]
[11] [12]
[13]
[14] [15] [16] [17] [18]
[19]
Z. Wang, A. C. Bovik, H. R. Sheikh, and E. P. Simoncelli, “Image quality assessment: From error visibility to structural similarity,” IEEE Trans. Image Process., vol. 13, no. 4, pp. 600–612, Apr. 2004. ITU-T and ISO/IEC JTC 1, “Generic coding of moving pictures and associated audio information – Part 2:Video,” ITU-T Rec. H.262 and ISO/IEC 13818-2 (MPEG-2), Nov. 1994. Dumic, E.; Mustra, M.; Grgic, S.; Gvozden, G.; , "Image quality of 4:2:2 and 4:2:0 chroma subsampling formats," ELMAR, 2009. ELMAR '09. International Symposium , vol., no., pp.19-24, 28-30 Sept. 2009 ISO/IEC JTC 1, “Coding of audio-visual objects – Part 2: Visual,” ISO/IEC 14496-2 (MPEG-4 Part 2), Jan.1999 (with several subsequent amendments and corrigenda). Marpe, D.; Wiegand, T.; Gordon, S.; , "H.264/MPEG4-AVC fidelity range extensions: tools, profiles, performance, and application areas," Image Processing, 2005. ICIP 2005. IEEE International Conference on, vol.1, no., pp. I- 593-6, 11-14 Sept.2005. T. Wedi and Y. Kashiwagi, “Subjective quality evaluation of H.264/AVC FRExt for HD movie content,” Joint Video Team document JVT-L033, July, 2004. T. Chujoh, R. Noda, “Internal bit depth increase for coding efficiency,” ITU-T SG16 Q.6 Document, VCEG-AE13, Marrakech, Jan. 2007. Joint Call for Proposals on Video Compression Technology, ITU-T SG16 Q6 document VCEG-AM91 and ISO/IEC JTC1/SC29/WG11 document N11113, ITU-T SG16 Q6 and ISO/IEC JTC1/SC29/WG11, Kyoto, Japan, Jan. 2010. Walter Gish; Haoping Yu; " Extended Sample Depth: Implementation and Characterization," ISO/IEC JTC1/SC29/WG11 and ITU-T SG16 Q.6 Document JVT-H016, Geneva, Switzerland, May, 2003. Pierre Larbier, “Using 10-bits AVC/H.264 Encoding with 4:2:@ for Broadcast Contribution”, ATEME, Bievres, France Mathew Compton, “10 bit high quality MPEG-4 AVC video compression”, Tandberg Television, Southampton, UK. ftp://vqeg.its.bldrdoc.gov/HDTV/SVT_MultiFormat/ http://www.ebu.ch/fr/technical/hdtv/test_sequences.php TK Tan; Gary Sullivan; Thomas Wedi;, " Recommended Simulation Common Conditions for Coding Efficiency Experiments," ITU-T SG16 Q.6 Document, VCEG-AA10, Nice, France, October, 2005. G. Bjøntegaard, "Calculation of average PSNR differences between RDcurves", ITU-T SG16 Q.6 Document, VCEG-M33, Austin, US, April 2001.