individual sugars extracted from apple samples using methanol and .... Table I. Sugar Profiles of Apple Sample (16.5°Bx) ... Sugar profiles of Spanish unifloral.
Journal of Chromatographic Science, Vol. 41, July 2003
Comparison of Different Extraction and Detection Methods for Sugars Using Amino-Bonded Phase HPLC Mustafa Karkacier, Mustafa Erbas, Mustafa K. Uslu, and Mehmet Aksu Akdeniz University Faculty of Agriculture, Department of Food Engineering, 07070 Antalya, Turkey
Abstract In this study, different methods are compared in order to quantitate individual sugars extracted from apple samples using methanol and water. Glucose, fructose, and sucrose are separated in 20 min using an amino-bonded carbohydrate column and a 75:25 acetonitrile–water mobile phase, followed by UV (190 nm) and refractive index detection. Variations in the sugar profiles are observed using different extraction or detection methods (or both) at a 1.4-mL/min flow rate. The data obtained show differences (p < 0.01) from both extraction or detection methods. The highest contents of free sugars studied occur in samples extracted with water.
Introduction
phase composition and detectors, as well as preparing the samples for HPLC. Extraction with water of some samples that include β-amylase has been a major problem in quantitating the individual sugars. In this case, water is effective in extracting the fructose, glucose, sucrose, and maltose. However, maltose levels may fluctuate widely between simultaneously injected samples because during the water-extraction process dextrins can be reduced to maltose. On the contrary, when alcohols are used for extraction, enzymatic saccharification activity can be prevented (2). The scope of this study was to compare the application of methanol and water for extraction and quantitation of free sugars by UV–vis and RI detection in order to ensure optimal conditions for utilizing amino-bonded phases.
Experimental
Various chromatographic procedures including thin-layer chromatography (TLC), gas–liquid chromatography (GLC), and high-performance liquid chromatography (HPLC) have been used for the analyses of sugars. In addition, automated enzyme assays have been used to determine carbohydrates for over a decade (1). Traditional colorimetric and iodometric methods, as well as other methods, however, are unable to quantitate sugars individually (2). GLC is successful for determining individual sugars, but it requires a derivatization procedure with its inherent problems and the formation of anomers. In addition, the application of the GLC method is not suitable to all foods (3), and the low thermal stability and volatility of sugars hinder the use of GLC (4). HPLC has been extensively used for sugar separation and quantitation (1,5). The main drawback to HPLC is that sugars do not absorb UV light at a wavelength longer than 200 nm. Despite this limitation, improvements in refractive index (RI) detectors have resulted in the routine use of HPLC for sugar analysis (4). As previously reported, different modes of HPLC are used to identify the sugar profile in foods (6–10). They include cationexchange and anion-exchange chromatography, chromatography utilizing amino-bonded stationary phases, and classical reversedphase chromatography on alkylated silica gels (4). Obtaining satisfactory results depends on optimizing the associated mobile
Chemicals and reagents
Acetonitrile and methanol used were purchased from J.T. Baker (Deventer, the Netherlands). The sugar standards were from Sigma (St. Louis, MO) and the membrane filters and Sep-Pack C18 cartridges were from Alltech (Deerfield, IL). Apple samples were obtained from a local fruit-juice factory. Chromatographic system
Chromatographic analyses were carried out with a Varian HPLC equipped with a model 9010 solvent delivery system and a Marathon autosampler with 20-µL loop (Varian, Harbor City, CA). Two detectors, a Varian 9050 UV–vis detector and Varian 9040 RI were used for detection. An Alltech amino-bonded carbohydrate column (10 µm, 300- × 4.1-mm i.d.) was used with an acetonitrile–water (75:25) mobile phase for isocratic elution. The flow rate was 1.4 mL/min. RI and UV detection (190 nm wavelength) were performed at ambient temperature. Sample preparation
For methanol extraction, 10 g of apple sample that was previously homogenized (Ultraturrax T-25, IKA Labortechnik, Stauten, Germany) was blended with 40 mL methanol. The resulting mixture was stirred in a magnetic mixer (Barnstead Thermolyne, Dubuque, IA) for 20 min at 300 rpm at ambient
Reproduction (photocopying) of editorial content of this journal is prohibited without publisher’s permission.
331
Journal of Chromatographic Science, Vol. 41, July 2003
temperature, and the supernatants were increased to 50 mL with methanol. This extract was reduced in volume by a rotary vacuum evaporator (Janke-Kunkel, IKA Labortechnik) to separate the methanol. The extract residue was diluted to 50 mL with methanol (6). For water extraction, 10 g of homogenized sample was directly mixed with 40 mL of water. The mixture was homogenized using Table I. Sugar Profiles of Apple Sample (16.5°Bx) Obtained from Different Extraction and Detection Methods and Individual Sugar/Total Ratios (n = 4)
Results and Discussion
Extraction solvent Water Detector Fructose (%) Glucose (%) Sucrose (%) Total sugar (%) Fructose/total sugar Glucose/total sugar Sucrose/total sugar
an ultraturrax at 24,000 rpm and centrifuged at 6000 rpm for 30 min at ambient temperature. The supernatant was filtered through Whatman 42 filter paper (Whatman, Kent, U.K.). All extracts obtained by methanol and water extractions were filtered through a Sep-Pack C18 cartridge. An amount of 2.5 mL of filtrate was blended with 7.5 mL of acetonitrile; subsequently, the mixture was filtered through a 0.45-µm membrane before 20 µL was injected. Standard sugar solutions, prepared to contain 5–100 µg/mL, were injected into the HPLC system.
Methanol
RI
UV–vis
RI
UV–vis
10.36a 2.73a 2.61a 15.70a 0.66 0.17 0.17
8.53b 0.75b 0.32c 9.60c 0.89 0.08 0.03
8.60b 2.47a 1.85b 12.92b 0.67 0.19 0.14
7.35c 0.79b 0.29c 8.43c 0.87 0.09 0.03
* Mean values in a column followed by different letters are significantly (p < 0.01) different (Duncan’s Multiple Range test).
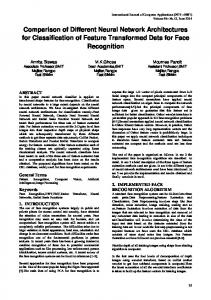
The levels of fructose, glucose, and sucrose, as well as the free sugars/total sugar ratios determined in samples are presented in Table I. Typical chromatograms of the samples are shown in Figure 1. There were significant differences in the sugar profiles in relation to extraction and detection types. However, the amounts of fructose extracted with water and detected using UV–vis detection were not significantly (p > 0.01) different than those obtained using methanol extraction and RI detection. Consistent results can be obtained by determining the ratio of individual sugars to total sugars in order to compare detection methods. For water extraction, fructose, glucose, and sucrose composed 66%, 17%, and 17%, respectively, of the total sugars when quantitated by RI. But they were 89%, 8%, and 3%, respectively, when quantitated by UV–vis detection. Additionally, results for both sugar extracts determined by UV–vis detection were lower than those found using the RI detector. The reason for these results may be attributable to detection absorbance wavelengths for the sugars. During methanol extraction, some sugars may not have adequately dissolved in proportion to their true concentration because of methanol vaporization, even at low temperatures. Consequently, water is a more effective solvent for sugar extraction, which yields more reliable results.
Acknowledgments This research work was supported by Akdeniz University Research Fund, project no. 20.01.0104.11.
References
Figure 1. (A) RI detection and (B) UV–vis detection (190 nm). The peaks represent (1) fructose, (2) unknown, (3) glucose, (4) sucrose, and (5) unknown.
332
1. M.L. Richmond, S.C.C. Brandao, J.I. Gray, P. Markalis, and C.M Stine. Analysis of simple sugars and sorbitol in fruit by high-performance liquid chromatography. J. Agric. Food Chem. 29: 4–7 (1981). 2. L.M. Langemeier and D.E. Rogers. Rapid method
Journal of Chromatographic Science, Vol. 41, July 2003
3. 4. 5. 6.
for sugar analysis of dough and baked products. Cereal Chem. 72(4): 349–51 (1995). J.L. Iverson and M.P. Bueno. Evaluation of high-pressure liquid chromatography and gas chromatography for quantitative determination of sugars in foods. J. Assoc. Off. Anal. Chem. 64(1): 139–43 (1981). A. Berthod, S.S.C. Chang, S.P.S. Kullman, and D.W. Armstrong. Practice and mechanism of HPLC oligosaccharide separation with a cyclodextrin bonded phase. Talanta 47: 1001–12 (1998). D.L. Dunmire and S.E. Otto. High-pressure liquid chromatographic determination of sugars in various food products. J. Assoc. Off. Anal. Chem. 62(1): 176–85 (1979). M.M. Camara, C. Diez, and M.E. Torija. Free sugars determination by HPLC in pineapple products. Z. Lebensm. Unter Forsch. 202: 233–37 (1996).
7. J.P. Yuan and F. Chen. Simultaneous separation and determination of sugars, ascorbic acid and furanic compounds by HPLC-dual detection. Food Chem. 64: 423–27 (1999). 8. I. Ferreira, A.M.P.Gomes, and M.A. Ferreira. Determination of sugars and some other compounds in infant formulae, follow-up milk and human milk by HPLC-UV/RI. Carbohydr. Polym. 37: 225–29 (1998). 9. R. Mateo and B.R. Francisco. Sugar profiles of Spanish unifloral honeys. Food Chem. 60(1): 33–41 (1997). 10. S.D. Senter, G.W. Chapman, W.R. Forbus, and S.A. Payne. Sugar and nonvolatile acid composition of persimmons during maturation. J. Food Sci. 56(4): 989–91 (1991). Manuscript accepted May 16, 2003.
333