Rev Inst Adolfo Lutz DOI: 10.18241/0073-98552014731586
Artigo Original/Original Article
Comparison of different statistical approaches used to evaluate the performance of participants in a proficiency testing program Comparação de diferentes métodos estatísticos utilizados para avaliar o desempenho de participantes em um programa de ensaio de proficiência
RIALA6/1586 Camila Cardoso de OLIVEIRA*, Paulo TIGLEA, José Carlos OLIVIERI, Maria de Fátima Henriques CARVALHO, Márcia Liane BUZZO, Alice Momoyo SAKUMA, Maria Cristina DURAN, Miriam Solange Fernandes CARUSO, Daniel GRANATO *Endereço para correspondência: Instituto Adolfo Lutz, Coordenadoria de Controle de Doenças, Secretaria de Estado da Saúde de São Paulo. Av. Dr Arnaldo, nº 355, 01246-902, São Paulo, SP, Brazil. Tel: (+55) 11 3068-2821. E-mail:
[email protected] Recebido: 26.06.2013 - Aceito para publicação: 31.03.2014
ABSTRACT Five statistical approaches were applied for assessing the performance of participants in 19 rounds (2007-2011) of the Proficiency Testing Program for lead in blood determination (PEP-Pbs), conducted by Instituto Adolfo Lutz. The performance evaluation was provided by using the z-score. The following statistical approaches were tested: 1 – mean and standard deviation, after rejecting outliers; 2 – median and normalized inter-quartile range; 3 – robust mean and robust standard deviation; 4 – robust mean and standard deviation for proficiency assessment of 3 µg/100 mL (for concentrations up to 40 µg/100 mL and a standard deviation for proficiency assessment of 7.5 % of the assigned value (for concentrations above 40 µg/100 mL); 5 – robust mean and standard deviation for proficiency assessment of 2 µg/100 mL (for concentration up to 40 µg/100 mL) or 5 % of the assigned value (for concentrations above 40 µg/100 mL). The approach 4 showed to be the most adequate statistical methodology to assess the performance of participating laboratories in the PEP-Pbs. Keywords. proficiency testing program, inter-laboratory comparison programs, z-score, statistical techniques. RESUMO Cinco abordagens estatísticas foram aplicadas para avaliar o desempenho dos participantes em 19 rodadas (2007-2011) do Programa de Ensaio de Proficiência para determinação de chumbo em sangue (PEP-Pbs), organizado pelo Instituto Adolfo Lutz. A avaliação de desempenho foi realizada utilizando-se o índice-z, e as seguintes abordagens estatísticas foram testadas: 1 - média e desvio padrão, após a exclusão dos valores dispersos; 2 - mediana e intervalo interquartil normalizado; 3 - média robusta e desvio padrão robusto; 4 - média robusta e desvio padrão de proficiência de 3 µg/100 mL (para concentrações de até 40 µg/100 mL) e desvio padrão de proficiência de 7,5 % do valor designado (para concentrações superiores a 40 µg/100 mL); 5 - média robusta, desvio padrão de proficiência de 2 µg/100 mL (para concentrações de até 40 µg/100 mL) e desvio padrão de proficiência de 5 % do valor designado (para concentrações acima de 40 µg/100 mL). A abordagem 4 mostrouser mais adequada para avaliar o desempenho dos laboratórios participantes do PEP-Pbs. Palavras-chave. ensaio de proficiência, comparação interlaboratorial, índice-z, técnicas estatísticas.
26
Rev Inst Adolfo Lutz. 2014; 73(1):26-31
Oliveira CC, Tiglea P, Oliveira JC, Carvalho MFH, Buzzo ML, Sakuma AM, et al. Comparison of different statistical approaches used to evaluate the performance of participants in a proficiency testing program. Rev Inst Adolfo Lutz. São Paulo, 2014; 73(1):26-31.
INTRODUCTION Proficiency testing programs are designed to evaluate the analytical performance of participating laboratories, making it possible to accomplish a critical evaluation of the validity of experimental assays carried out routinely and also to identify analytical problems and facilitate the implementation of necessary corrective actions1,2. A Proficiency Testing Program provider (PT schemes) is responsible for conducting the statistical analysis and supply an indicator of the performance of all participants. The participation of laboratories in proficiency testing activities is usually evaluated in the process of accreditation of assays by ISO/IEC 17025 or ISO 151893,4. In order to meet this metrological demand in Brazil, in 2004, Instituto Adolfo Lutz (IAL) was authorized as a provider of Proficiency Testing Program for Lead in Blood (PEP-Pbs) by the Rede Brasileira de Laboratórios Analíticos em Saúde (REBLAS) from Gerência Geral de Laboratórios de Saúde Pública (GGLAS) from the Agência Nacional de Vigilância Sanitária (ANVISA). In 2011, Instituto Adolfo Lutz was accredited by the Instituto Nacional de Metrologia, Qualidade e Tecnologia (INMETRO) as the first provider of proficiency testing program for lead in blood in Brazil, according to ISO/ IEC170435. Currently, the PEP-Pbs has financial support from the Instituto Adolfo Lutz and from the Rede de Sangue e Hemoderivados (REDSANG-SIBRATEC/ FINEP), and therefore, the participating laboratories have no expenses by adhering to the PEP-Pbs. The frequency of the PEP-Pbs is quarterly and the participation is open to public and/or private laboratories. In each round, three test items (sufficiently homogeneous and stable) are sent to laboratories. The test samples consist of bovine blood spiked with lead at concentrations ranging from 10 to 100 µg/100 mL. This concentration range covers the reference values established as clinically important for the evaluation of environmental and occupational human exposure. The exposure of children to lead is evaluated based on the reference established by the Centers for Disease Control and Prevention (CDC), which associates adverse effects in children even at blood lead concentrations below 10 µg/100 mL6. The uncertainty associated with results in this concentration range should be carefully evaluated by clinical laboratories, because the analytical results are used to provide reliable
data that can direct individual treatment interventions appropriately. Likewise, the laboratory must provide adequate answers to occupational exposure issues in order to describe correctly the exposed individuals. It is, therefore, recommended that laboratories that conduct epidemiological and occupational studies look for information regarding tools that check for performance assessment of their measurements. Regarding PT schemes, it is of paramount importance to assess the performance of each participating laboratory by using statistical methods. In this sense, the PEP-Pbs provider established a statistical criterion based on the following: the assigned value was obtained from the mean of participants results within the range of ± 2 standard deviations from the overall average and the criterion for acceptance was defined by + 6 µg/100 mL of the assigned value for concentrations up to 40 µg/100 mL or ± 15 % of the assigned value when the lead concentration was higher than 40 µg/100 mL7. The data from each laboratory were considered satisfactory when the results were within this range, whereas the performance was considered unsatisfactory when data were outside the range.The tolerance range adopted by PEP-Pbs provider was the same employed by other programs, such as Programa interlaboratorios de control de calidad (PICC) – plomo en sangre from the Instituto Nacional de Seguridad e Higiene en el Trabajo – Zaragoza (Spain), Korean analytical quality assurance program (KAQUA) from Industrial Health Research Institute in Korea and by the Blood Lead proficiency testing program from Occupational Safety & Health Administration (OSHA), USA8-10. As well outlined by Kisets11, a correct choice of proper performance indicator sometimes presents drawbacks, which come from the lack of international consensus and well-founded criteria of proving the choice of an optimal method, including the statistical procedures. Indeed, from a methodological standpoint, both statistical approach and its application are far from being perfect. Therefore, the assessment of different statistical methods is essential to evaluate the performance of laboratories in PT schemes. The need to promote the continuous improvement of laboratories implies that the statistical methods used to assess the performance of laboratories in proficiency testing program be improved in order to assure the quality of the analytical results. Certainly, it is important to PT scheme providers and participants to know if there would be any significant 27
Oliveira CC, Tiglea P, Oliveira JC, Carvalho MFH, Buzzo ML, Sakuma AM, et al. Comparison of different statistical approaches used to evaluate the performance of participants in a proficiency testing program. Rev Inst Adolfo Lutz. São Paulo, 2014; 73(1):26-31.
difference in the evaluation results when different performance statistics methods are applied12. Based on these considerations, this study compared the suitability of different statistical approaches for determining the assigned value and the standard deviation for proficiency assessment, considering three concentration ranges of lead in blood. This work also aimed to improve the statistical approach that has been currently used by this proficiency testing program. MATERIAL AND METHODS Samples In PEP-Pbs, three samples with different concentration levels of lead in blood were sent to the laboratories in each round, in which an average of 20 laboratories participated. This study evaluated data from19 rounds in the period between 2007 and 2011, totaling 57 samples with different lead concentrations (within the rangeof 10 to 100 µg/100 mL). The participating laboratories could use the analytical technique of their choice to determine lead in blood. The used techniques wereas follows: graphite furnace atomic absorption spectrometry (ETAAS), flame atomic absorption spectrometry (FAAS) or inductively coupled argon plasma mass spectrometry (ICP-MS). Each laboratory provided three results (replicates) for each sample. Different statistical approaches were assessed in relation to their suitability in three concentration ranges: I (10 - 30 µg/100 mL); II (30 - 50 µg/100 mL); III (50 - 100 µg/100 mL). Data treatment The result of each laboratory was converted to the z-score, according to Equation (1):
z=
xi − X (1) σˆ
Where is the mean of the values reported by the laboratory is the assigned value and the standard deviation for proficiency assessment13. The criteria used to assess the performance of each laboratory were z ≤ 2 , satisfactory; 2 < z < 3 , questionable; z ≥ 3 , unsatisfactory.
28
The assigned value was obtained by consensus among participants of the round for each sample. Estimates of the assigned value and the standard deviation for proficiency assessment, considered in the z-score expression, were calculated using five statistical approaches, as described below: Approach 1 The assigned value and standard deviation for proficiency assessment were obtained by the arithmetic mean and standard deviation of the means of results from laboratories, after rejecting outliers detected by Cochran and Grubbs tests14,15. Approach 2 The assigned value and the standard deviation for proficiency assessment were obtained by the median and by the normalized interquartile range (NIQR) from the results of each laboratory16. In the current work, NIQR was used to estimate the SD once this method is recommended by NATA and many PT providers in Brazil use this statistical criterion. Approach 3 The assigned value and the standard deviation for proficiency assessment were obtained by the robust mean and robust standard deviation. The robust parameters were determined by using the Algorithm A13,17. Approach 4 The assigned value was obtained by the robust mean as calculated by the Algorithm A (approach 3). The standard deviation for proficiency assessment was assigned at 3 µg/100 mL for concentrations up to 40 µg/100 mL and also a value of 7.5 % of the robust mean for concentrations above 40 µg/100 mL was assessed. These tolerance ranges are currently employed by other international PT providers, such as OSHA10. Approach 5 The assigned value was obtained by the robust mean as calculated by the Algorithm A (approach 3). The standard deviation for proficiency assessment was assigned at 2 µg/100 mL for concentrations up to 40 µg/100 mL or 5.0 % of the robust mean for concentrations above 40 µg/100 mL. These tolerance ranges are currently employed by the Clinical Laboratory Improvement Amendments (CLIA)18.
Oliveira CC, Tiglea P, Oliveira JC, Carvalho MFH, Buzzo ML, Sakuma AM, et al. Comparison of different statistical approaches used to evaluate the performance of participants in a proficiency testing program. Rev Inst Adolfo Lutz. São Paulo, 2014; 73(1):26-31.
Comparison of the percentage of acceptable z-scores in the concentration ranges The z-test for dependent samples was used in order to compare the percentage of acceptable z-scores for each approach for the three concentration ranges of lead in blood. A p-value above 0.05 showed that there were no significant statistical differences between percentages. RESULTS AND DISCUSSION The objective of this article was to discuss the use of five different statistical approaches to assess the performance of participating laboratories in PEP-Pbs, including a traditional approach with outlier detection (approach 1), another one based on the median and NIQR (approach 2), another approach based on the algorithm A - recommended by ISO 13528 (approach 3) - and finally, a practical approach that takes into account a fit-for-purpose criterion to establish a specified target value (approaches 4 and 5) for improvement of PEP-Pbs statistical analysis. It is worthy to state that the IUPAC encourages basing the scoring methods on fitness for purpose criterion19. The methods took into account the different concentration ranges that the participating laboratories routinely analyze. The influence of different concentration levels on the performance of measurement methods to quantify lead in blood was also considered. From the experimental results, about 50 % of data (29 mean data sets) did not present a normal distribution and, approximately, 70 % (45 mean data sets) presented outliers, according to Shapiro-Wilk and Cochran/Grubbs tests, respectively. Furthermore, all data sets presented unimodality and most part of them were roughly symmetric. The statistical approach 1, which uses a classical statistics, provides the best estimate of the true value and the dispersion of the population for a data set only when the results are normally distributed with no outliers. Therefore, this approach was unsuitable to evaluate the performance of participating laboratories of PEP-Pbs, because even if outliers are removed, the data still may not follow a normal distribution. Furthermore, this procedure has the disadvantage that simple versions of the outlier tests may mislead if two or more outliers are present20. Thus, the approaches 2, 3, 4 and 5, which used robust methods, were more
suitable to the data because they are not significantly influenced by the presence of outliers in the data sets and are unaffected by deflection of the normal distribution21. Even though the z-score calculated by the conventional method (mean and standard deviation) provides a valid indicator to assess the performance of laboratories in interlaboratory comparison programs, it is recommended that other statistical approaches be tested to determine the assigned values (measures of central tendency and dispersion)22. In the current study, the statistical approach 2 was considered not adequate for PEP-Pbs because this method is more robust for asymmetric data, which is not the case of most part of the PEP-Pbs data23. Furthermore, it presented z-score values slightly higher than the values calculated with approach 3. When the concentration of lead in blood was in the range of 10 to 30 µg/100 mL, the NIQR value was low. Indeed, the standard deviation (SD) obtained by NIQR was lower than the considered fitness for purpose, in other words, 28 % of the NIQR were lower than the SD adopted in the approach 4 and 11 % of the NIQR were lower than the SD adopted in the approach 5, resulting in a considerably number of laboratories with unsatisfactory performance that would require the laboratories to improve performance unnecessarily. The statistical approach 3, recommended by ISO 13528, which uses the robust mean and the robust standard deviation calculated by Algorithm A, is more suitable to be applied when the distribution is approximately symmetrical. Based on this consideration, approach 3 presented no disadvantages such as approaches 1 and 2. The median is substantially more variable than the mean when the data are not outlier contaminated24. Thus, the robust mean calculated by the Algorithm A (approaches 4 and 5) was selected as an estimate to determine the assigned value for the PEP-Pbs. Srnkováand Zbíral25 compared the performance measured by the z-score of several laboratories in the determination of minerals in different materials in proficiency testing programs using three statistical techniques: i) mean and standard deviation, ii) robust mean and robust standard deviation; and iii) robust mean and standard deviation of Horwitz. The authors found that the procedure ii) was more suitable for the data matrix. The statistical approach 4 was adequate to assess the performance of laboratories. This approach is based 29
Oliveira CC, Tiglea P, Oliveira JC, Carvalho MFH, Buzzo ML, Sakuma AM, et al. Comparison of different statistical approaches used to evaluate the performance of participants in a proficiency testing program. Rev Inst Adolfo Lutz. São Paulo, 2014; 73(1):26-31.
30
100 a
80 Percentage of satisfactory z-score
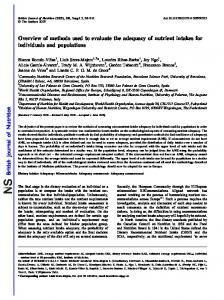
on fitness for purpose criterion as recommended by IUPAC19, where a maximum reproducibility standard deviation internationally adopted was considered for SD for proficiency assessment. In order to investigate whether SD of fitness for purpose could be reduced,were selected nine laboratories (expert) that presented at least 80 % of satisfactory z-scores in the last 10 rounds. The reproducibility SD of these expert laboratories results was calculated using the method proposed by ISO 572514. In this sense, the mean reproducibility SD was found to be 2.74 µg/100 mL for concentrations up to 40 µg/100 mL and 3.88 µg/100 mL (6.5 % of assigned value) for concentrations higher than 40 µg/100 mL. These results are slightly lower than the internationally employed, showing that the use of this reproducibility SD was suitable to be adopted by PEP-Pbs at all concentration levels. In other words, the internationally used criterion was deemed suitable to be applied in PEP-Pbs. The approach 5, used by some PT providers such as CLIA, considers the SD as 2 µg/100 mL for concentrations up to 40 µg/100 mL and 5.0 % of the robust mean for concentrations above 40 µg/100 mL. In the current work, this approach was studied in order to observe data behavior since this criterion is more stringent. In fact, by using the statistical approach 5, higher values of z-scores were obtained for 88 % of the data sets as compared to those obtained by the other statistical approaches and, consequently, presented the highest proportion of unsatisfactory results in all concentration levels of lead in blood. Figure 1 shows the percentages of laboratories that obtained a satisfactory performance in the PEP-Pbs and the percentages of satisfactory performance when different statistical approaches were used to evaluate the performance of the participating laboratories. It is possible to observe that the percentages of satisfactory performance as calculated by the statistical approaches 1 and 3, for the three concentration ranges, were similar (p > 0.05).The approach 2 presented similar percentages of satisfactory performance to approaches 1, 3 and 4, for the concentration ranges I and II. The percentages of satisfactory performance calculated by the approach 4 were similar to the ones obtained by the approach used in the PEP-Pbs, for all concentration ranges of lead in blood.
b
c
60
40
20
0 PEP Pbs
Approach 1
Approach 1
Approach 1
Approach 1
Approach 1
Statistical approaches
Figure 1. Percentages of acceptable z-scores in the concentration ranges of lead in blood, where Range I (light grey): 10-30 µg/100 mL; Range II (dark grey): 30-50 µg/100 mL and Range III (black): 50-100 µg/100 mL. Different letters for the same concentration range represent statistically different percentages (p < 0.05)
By using the statistical approach 5, the lowest percentages of satisfactory performance were obtained in all concentration ranges of lead in blood. Therefore, this procedure is more restrictive since it uses the smallest standard deviation for proficiency assessment, resulting in only 78.6 %, 64.7 % and 61.3 % of satisfactory results in the concentration ranges 10-30 µg/100 mL, 30-50 µg/100 mL and 50-80 µg/100 mL, respectively. In summary, it is widely known that one statistical approach should be used considering the distribution of data, resistance to outliers and closeness to expected values. CONCLUSION Data analysis and statistical treatments showed that the approach 1, which used classical statistics, was not considered suitable to estimate the central tendency and the standard deviation for PEP-Pbs results due to the fact that data distribution did not follow a normal distribution even if outliers were removed. The approach 2, which used the median and the normalized interquartile range, was considered unsuitable because most part of the data was not asymmetric, resulting in inadequate z-scores especially for samples with low concentrations of lead in blood (10 to 30 µg/100 mL). The approach 3 showed no disadvantages in relation to approaches 1 and 2, but the approach 4 is more suitable for the PEP-Pbs as compared to approach 3, once it uses a prescribed standard deviation for proficiency assessment, presenting a more appropriate performance assessment with regards to the purpose of
Oliveira CC, Tiglea P, Oliveira JC, Carvalho MFH, Buzzo ML, Sakuma AM, et al. Comparison of different statistical approaches used to evaluate the performance of participants in a proficiency testing program. Rev Inst Adolfo Lutz. São Paulo, 2014; 73(1):26-31.
the PT scheme. The approach 5 was more stringent than the others because it uses a lower standard deviation as compared to the deviations obtained by the other approaches for most part of the samples. If PT providers adopt the approach 5, one may induce an analytical quality improvement of participants test results. This is the goal when a proficiency test is organized, however, it may be not technically feasible for some of participating laboratories. Thus, the approach 4 was chosen to evaluate the analytical performance of laboratories that take part of the proficiency testing program for determination of lead in blood at concentrations ranging from 10 to 100 µg/100 mL from the 50th round onwards. Despite the performance evaluation of laboratories using the statistical method described by approach 4 be similar those obtained by PEP-Pbs, the statistical analysis was amended to use the z-score, widely disseminated and understood by participants which include questionable performance while the provider only assessed participants performance as satisfactory or unsatisfactory. Therefore, providers should conduct studies based on different approaches statistics in order to get an estimate more accurate of PT SD, and to assess the performance of laboratories since there is no international consensus on which methods more suitable to the experimental data. Overall, it is suggested that PT providers use a score to evaluate laboratories performance in which the assigned value is obtained independently of the participants data and also consider the uncertainty of the experimental results. REFERENCES 1.
Svegl F, Strupi JS, Svegl IG. Proficiency testing of chloride content in different types of Portland cement. Accred Qual Assur.2006;11:414-21.
2.
Senyuva HZ, Gilbert J. Assessment of the performance of pesticide-testing laboratories world-wide through proficiency testing. Trends Anal Chem.2006;25:554-62.
3.
ISO/IEC 17025. General requirements for the competence of testing and calibration laboratories. 2005.
4.
ISO 15189 - Medical laboratories - Requirements for quality and competence. 2012.
5.
ISO/IEC 17043. Conformity assessment - General requirements for proficiency testing.2010.
6.
Department of Health and Human Services (United States). Preventing lead poisoning in young children 2005. [access 2012 Jul]. Available in [http://www.cdc.gov/nceh/lead/publications/ PrevLeadPoisoning.pdf].
7.
Maio FD, Zenebon O, Tiglea P, Okura RIS, Sakuma AM. Evaluation of statistical criteria applicable to interlaboratory comparisons for lead in blood. Rev Inst Adolfo Lutz.2006;65:89-93.
8.
Instituto Nacional de Seguridad e Higiene em el Trabajo (Espanha). Programa interlaboratorios de control de calidad (PICC) – plomo en sangre. [access 2012 Jul]. Available in [http:// www.insht.es/portal/site/Insht].
9.
Yang JS, Lee MY, Park IJ, Moon YH, Kang SK. Korean analytical quality assurance (KAQUA) program for biological monitoring. Int Arch Occup Environ Health.1997;69:361-6.
10. Occupational Safety & Health Administration (United States). [access 2012 Jul]. Available in [http://www.osha.gov/SLTC/ bloodlead/protocol.html]. 11. Kisets D. Performance indication improvement for a proficiency testing. Accred Qual Assur.2006;10:461-5. 12. Wong SK. A comparison of performance statistics for proficiency testing programmes. Accred Qual Assur. 2007;12:59-66. 13. ISO 13528. Statistical methods for use in proficiency testing by interlaboratory comparisons. 2005. 14. ISO 5725-2. Accuracy (trueness and precision) of measurement methods and results. Part 2 - Basic method for the determination of repeatability and reproducibility of a standard measurement method. 1994. 15. Chui QSH, Barros CB, Silva TD. Parâmetros r e R obtidos de programa interlaboratorial - Como usá-lo. Quím. Nova.2009;32:2209-13. 16. National Association of Testing Authorities (Australia). Guide to NATA Proficiency Testing. [access 2012 Jul].Available in [http:// www.dicocare.org/Bibliografia/B_4_Summary_Statistics_ NATA_PT_2004_Feb.pdf]. 17. ISO 5725-5. Accuracy (trueness and precision) of measurement methods and results. Part 5 - Alternative methods for the determination of the precision of a standard measurement method. 1994. 18. Bio-Rad Laboratories, Inc. (United States). [access 2012 Jul]. Available in[http://www.qcnet.com/Portals/0/PDFs/ CLIALimits%283-3-04%29.pdf]. 19. Thompson M, Ellison SLR, Wood R. The International Harmonized Protocol for the Proficiency Testing of Analytical Chemistry Laboratories (IUPAC Technical Report).Pure Appl Chem.2006;78:145-96. 20. Royal Society of Chemistry (United Kingdom). Analytical Methods Committee No.6 Robust statistics: a method of coping with outliers. 2001. 21. Willink R. What is Metrologia.2008;45:442-7.
robustness
in
data
analysis?
22. Elftheriou P, Papastefanou H. Measuring performance in analytical measurements. Accred Qual Assur.2009;14:67-71. 23. Rosario P, Martínez JL, Silván JM. Comparison of different statistical methods for evaluation of proficiency test data. Accred Qual Assur.2008;13:493-9. 24. Ellison SLR., Barwick VJ, Farrant TJD. Practical statistics for the analytical scientist – A Bench Guide.2th ed. Cambridge (UK):RSC Publishing;2009. 25. Srnková J, Zbíral J. Comparison of different approaches to the statistical evaluation of proficiency tests. Accred Qual Assur.2009;14:467-71.
31