further analysis and image or signal processing for therapeutic necessities. ... For an M Ã N digital image f (x, y), its two-dimensional discrete cosine transform ...
Special Issue of International Journal of Computer Applications (0975 – 8887) International Conference on Computing, Communication and Sensor Network (CCSN) 2012
Comparison of FFT, DCT, DWT, WHT Compression Techniques on Electrocardiogram & Photoplethysmography Signals Anamitra Bardhan Roy
Debasmita Dey
Devmalya Banerjee
Programmer Analyst Trainee, Cognizant Technology Solution, Kolkata, WB, India
B.Tech. Student, Dept. of CSE, JIS College of Engineering Kolkata, WB, India,
Asst. Professor, Dept. of EIE College of Engineering, WB, India
Bidisha Mohanty B.Tech. Student, Dept. of ECE, JIS College of Engineering, WB, India.
ABSTRACT Compression technique plays an important role indiagnosis, prognosis and analysis of ischemic heart diseases.It is also preferable for its fast data sending capability in the field of telemedicine.Various techniques have been proposed over years for compression. Among those Discrete Cosine Transformation(DCT), Discrete Wavelet Transformation(DWT), Fast Fourier Transformation(FFT) andWalsh Hadamard Transformation(WHT) are mostly used.In this paper a comparative study of FFT, DCT, DWT, and WHT is proposed using ECG and PPG signal, whichshows a certain relation between them as discussed in previous papers[1]. Image processing depends on compression which helps in reduction of file size for large data transmission in a stipulated and reduced time. Wavelet analysis provides one of the common goals of image compression, i.e. the signal or image clearance and simplification, which are part of denoising or filtering. Wavelet analysis uses and thus provides long term intervals. In this modern era medicinal therapies has evolved drastically which requires transmission of medical data over long distances under high security with maintaining efficacy. This paper delivers a comparative study based on compression ratio and Peak-Signal-to-Noise-Ratio(PSNR) values of image qualities for corresponding techniques .This study alsoascertains the least distortion of PPG signal among 1D signals after retrieval and information extraction from it and ECG signal based on the intermittent relations among ECG and PPG signals as discussed in other papers.
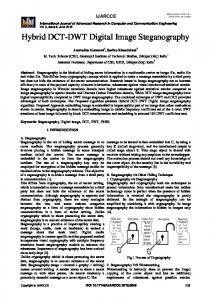
media requires high security and authentication [1]. This concept of telemedicine basically and foremost needs image compression as a vital part of image processing techniques to manage with the data capacity to transfer within a short and stipulated time interval. The therapeutic remedies are derived from the minutiae’s of the biomedical signals shared worldwide through telelinking. This communication of exchanging medical data through wireless media requires high level of compression techniques to cope up with the restricted data transfer capacity and rate. Compression of signals and images can cause distortion in them. As the medical signals and images contains and relays information required for detection of diseases, hence any kind of distortion can result in erroneous diagnosis which can turn fatal. However, for fast and efficient transmission of large amount of the information a little amount of distortion can be overlooked. So achieving compression technique with lesser amount of distortion in biomedical data is a challenging task. An ECG signal is composed of successive repetition of PQRST in monotony. In the beginning, a crust is generated from the linear signal to form the P wave.The declining linear wave soon gets a downward deflection labeled as Q wave. A sudden upright deflection can be observed just beyond the Q wave to form a high cone that is, the R wave. On its decline a slight downward defection is the S wave. A noticeable hinge after the S wave is known as T wave that marks the end of a segment of the ECG signal [2,3] normally.
Keywords FFT, DCT, DWT, WHT, ECG, PPG.
1.
INTRODUCTION
In the present mechanized age, globalization has influenced the medical field as well. At present most of the popular diagnostic centers and hospitals globally are being habituated in exchanging of bio-medical information through wireless media for mutual availability of therapeutic case studies as well as for improvement of diagnostic results. This communication of exchanging medical data through wireless
Fig.1: PQRST Components of ECG Signal
6
Special Issue of International Journal of Computer Applications (0975 – 8887) International Conference on Computing, Communication and Sensor Network (CCSN) 2012
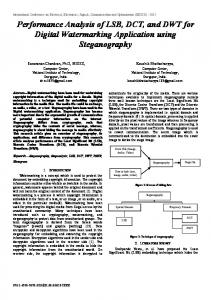
Photoplethysmography (PPG) is a non-invasive method to detect cardio-vascular pulse wave that propagates through the body using a light source and a detector [3,4]. It is actually a technique capable of measuring relative blood volume changes in the blood vessels close to the skin. In recent years, it has developed into a popular non-invasive method for assessing mean arterial blood pressure and oxygen saturation (Pulse Oximeter). Plethysmograph can be distinguished in different types, depending on the type of transducers used. The common types include air, impedance, photoelectric, and strain gauge plethysmograph. Each type of plethysmograph measures the change in blood volume in a different manner and is used in different types of applications.
In this paper a comparative study is performed on the FFT, DCT, DWT and WMH based compression techniques for compressing the ECG and PPG signals basic requirement for further analysis and image or signal processing for therapeutic necessities. Compressing of the signals facilitates transmission of the original and imperative information of patient’s biomedical information. Comparison of various compression techniques provides with a scope for the selection and usage of the better compression mechanism to provide ways of transmission to analyse patient’s biomedical information. Every compression scheme, being able to compress for communication, should provide a way of recovering the signal. Every compression technique should be able to recover and should provide a way for retrieving diagnostic information from the signal to form patient’s report of the medical case study. If, in addition, it is possible to determine the extent of degradation of the transmitted signal leading to lose and distortion of medical data that can be conveyed through an appropriate analysis, then a scheme should be developed that provides acheck on: (i) the authenticity of the data, and (ii) its fidelity.
2. 2.1
METHODOLOGY Fast
Fourier
Transform
A Fast Fourier Transform(FFT) is a faster, computational, efficient algorithm to compute the discrete Fourier transform(DFT) [5]and its inverse. Fig. 2: Extracted PPG pulse amplitude (AMP) and timing (PTTf) characteristics, with cardiac timing reference ECG.
Let x0, ....,xN-1be complex numbers. The DFT is defined by the formula :
..(1)
Discrete Fourier Transform (DFT) is the transformation of the discrete signal taking in time domain into its discrete frequency domain representation[6]. The functions Y = fft(x) and y = ifft(X) implement the transform and inverse transform pair given for vectors of length N by:
..(2)
The FFT algorithm reduces the computational burden to O(nlog n) arithmetic operation. FFT requires the number of data points to be a power of 2(usually padding is used to make this true).FFT requires evenly spaced time series.
2.2 Discrete Cosine Transformation
7
Special Issue of International Journal of Computer Applications (0975 – 8887) International Conference on Computing, Communication and Sensor Network (CCSN) 2012
A discrete cosine transform (DCT) is a technique for converting a signal into elementary frequency components[7,8]. It expresses a sequence of finitely numerous data points in terms of a sum of cosine functions oscillating at different frequencies which is widely used in image compression. The application is pioneered by Chen and Pratt in 1984.
There, C (u, v) is the result of discrete transform, and also known as DCT coefficient. Where, u, v = 0, 1, 2 ... N-1 x, y = 0, 1, 2, ... N-1 α (u) is defined as follows:
The DCT is closely related to the Discrete Fourier Transform (DFT) with some dissimilarity. The DCT is more efficient in concentrating energy into lower order coefficients than what the DFT does for image data.
...(8)
The DCT is purely real whereas the DFT is complex (magnitude and phase).
2.3 Discrete Wavelet Transformation
Coefficients produced by a DCT operation on a block of pixels are similar to the frequency domain coefficients produced by a DFT operation. As an N point DCT is closely related to a 2N-point DFT, it has the same frequency resolution. The N frequencies of a 2N point DFT correspond to N points on the upper half of the unit circle in the complex frequency plane.
The wavelet transform describes a multi-resolution decomposition process in terms of expansion of a signal onto a set of wavelet basis functions. Discrete Wavelet Transformation has its own excellent space frequency localization property. Application of DWT in 1D signal corresponds to 1D filter in each dimension. The input Daubechies Wavelet as mother wavelet is divided into 8 nonoverlapping multi-resolution sub-bands by the filters, namely db1, db2, db3up to db8, where db is acronym for Daubechies. The sub-band is processed further to obtain the next coarser scale of wavelet coefficients, until some final scale “N” is reached. When a signal is decomposed into 8 levels, the db6 sub-band signal best reflects the original signal, since according to the wavelet theory, the approximation signal at level n is the aggregation of the approximation at level n-1 plus the detail at level n-1. [7,8].
Unlike DCT, the magnitude of the DFT coefficients is spatially invariant (phase of the input does not matter) assuming a periodic input. For processing one-dimensional signals such as speech waveforms one-dimensional DCT is used. For analysis of two dimensional (2D) signals such as images, a 2D version of the DCT is required. As the 2-Dimensional DCT can be computed by applying 1D transforms separately to the rows andcolumns, it can be said that the 2D DCT is separable in the two dimensions.
Its scaling function
can be described as
For an M × N digital image f (x, y), its two-dimensional discrete cosine transform and its inverse transformation is defined by the following equations [9].
…(9)
..(3)
Fig. 3: Three-phase decomposition using DWT
... (4) There, C (u, v) is the result of discrete transform, and also known as DCT coefficient. Where, u, v = 0, 1, 2 ... N-1 x, y = 0, 1, 2, ... N-1 α (u) is defined as follows:
.. (5)
. (6)
2.4 Walsh-Hadamard Transformation The Walsh-Hadamard transform (WHT)[10,11] is a suboptimal, orthogonal, symmetric, involutional and nonsinusoidal transformation that decomposes a signal into a set of orthogonal, rectangular waveforms called Walsh functions. The amplitude of Walsh (or Hadamard) functions has only two values, +1 or -1, i.e. this transformation is real and has no multipliers. WHTs have many different applications, such as filtering, processing speech and medical signals, characterizing non-linear signals, solving non-linear differential equations, and logical design and analysis, processing of ECG signal etc. It has also been found its application in the field of data encryption, as well as signal processing and data compression technique. Walsh functions are generally seen in rectangular or square waveforms. An important feature of Walsh functions is sequence which has a unique value.
... (7)
8
Special Issue of International Journal of Computer Applications (0975 – 8887) International Conference on Computing, Communication and Sensor Network (CCSN) 2012
The forward and inverse Walsh transform pair for a signal x(t) of length N are
…(10)
..(11) The Walsh matrix is symmetric. Therefore both the forward and inverse transformations are identical operations except for the scaling factor of 1/N. The functions fwht and ifwht implement the forward and the inverse WHT respectively.
3.
PROPOSED METHOD
3.1
Compression
using
Step1. The original ECG and PPG is transformed by using WHT compression. Step2. The informative data shifting with in the signal after compression is saved and plotted subsequently. Step3. Regeneration of the ECG and PPG signals are done from the compressed signals. Step4. Consecutively the original and retraced signals are plotted to measure the changes caused by compression. Step5. Sustainability of relevant features of the signals are measured by analysing the correlation ratio and psnr values among the original and regenerated signals.
4.
RESULT
AND
FFT
Step1. Loaded ECG and PPG signal. Step2. Applied FFT compression on each of the signals. Step3. The original and compressed signals are then plotted to visualize the variations. Step4. The compressed signals are decompressed to regenerate the ECG and PPG signal respectively. Step5. Compared the regenerated signals after compression with the original signals to measure the correlation factors. Step6. Computed psnr value to analyse the extent of distortion of the signals.
3.2 Compression
using
DISCUSSION
(a)
DCT
Step1. Similarly the DCT compression is also applied on the original ECG and PPG signal. Step2. Level of compression is modified to attain better result of signal modification. Step3. The signals with primitive values and structures are retrieved from the compressed data. Step4. The compressed signals are plotted along with the original signals to measure the changes. Step5. Computed the correlation ratio and psnr among the original and regenerated signals.
3.3 Compression
using
DWT
(b)
Step1. Repeated the compression of ECG and PPG signals using DWT compression, considering the signals as wavelet. Step2. The accumulation of the information values contained in the signal after the compression are measured. Step3. The ECG and PPG signals are regenerated from the compressed signals achieved. Step4. The resultant signals are plotted alongside the original signals. Step5. The extent of distortion is measured by calculating the correlation ratio and psnr values.
3.4 Compression
using
WHT
9
Special Issue of International Journal of Computer Applications (0975 – 8887) International Conference on Computing, Communication and Sensor Network (CCSN) 2012
(f) (c)
(g) (d)
Fig4. (a)FFT Compression of ECG Signal(b) DCT Compression of ECG Signal(c) DWT Compression of ECG Signal(d) WHT Compression of ECG Signal
(h)
Fig4.(e)FFT Compression of PPG Signal(f) DCT Compression of PPG Signal (g) DWT Compression of PPG Signal (h) WHT Compression of PPG Signal (e)
10
Special Issue of International Journal of Computer Applications (0975 – 8887) International Conference on Computing, Communication and Sensor Network (CCSN) 2012
Table 1. Comparison Table between Various Compression Techniques on ECG & PPG Signal
Complex Detection of ECG Signal,” International Journal of Engineering Research and Applications (IJERA), ISSN: 2248-9622, Vol. 2, Issue 3, May-Jun 2012, pp.2361-2365[DBLP Indexed] [3] Potdar, Vidysagar and Han, Song and Chang, Elizabeth, “A survey of digital image watermarking techniques”, Proceeding of 3rd IEEE-International Conference on Industrial Informatics, Frontier Technologies for the Future of Industry and Business, pp. 709-716, Perth, WA, Aug 10, 2005. [4] Analysis of P-QRS-T Components Modified by Blind Watermarking Technique Within the Electrocardiogram Signal for Authentication in Wireless Telecardiology Using DWT, Nilanjan Dey, Sayantan Mukhopadhyay, AchintyaDas, Sheli Sinha Chaudhuri, International Journal of Image, Graphics and Signal Processing, IJIGSP Vol.4, No.7, July 2012
5.
CONCLUSION
This paper is focused on the comparison among four important methods of image compression. In addition, the effect of those methods on ECG and PPG signal is also summarized.This recent studies reveals many assertive components associated with the signal compression techniques. The comparison of FFT, DCT, DWT and WHT thrust on the recovered signal after compression depending on the parameters like correlation ratio and PSNR to justify the purposeful outcome of each process. This paper states that PPG signal sustains its high efficacy on regeneration after compression. This gives a scope to preserve medical data relevancy of the bio-medical signals undergoing compression in any form. This in turns also helps to compare and measure distortion in ECG signal based on the intermittent relation with PPG signal, as discussed in earlier papers[1].From the above study it can be seen that DCT take more elapsed time than DWT and FFT have more compression ratio then DCT & DWT. But DCT have less PSNR than FFT and DWT.
6.
REFERENCE
[1] Nilanjan Dey, Anamitra Bardhan Roy, Achintya Das, Sheli Sinha Chaudhuri,” Stationary Wavelet Transformation Based Self-Recovery of BlindWatermark from Electrocardiogram Signal in the Wireless Telecardiology”, International Workshop on Intelligence and Security Informatics for International Security (IIS'12) , 11-12 October 2012, Trivandrum, India, [Springer in Communications in Computer and Information Science Series(CCIS), ISSN: 1865:0929. CCIS is abstracted/indexed in ISI Proceedings, Scopus, EI and DBLP]
[5] Frigo, M. and S. G. Johnson, "FFTW: An Adaptive Software Architecture for the FFT,"Proceedings of the International Conference on Acoustics, Speech, and Signal Processing, Vol. 3, 1998, pp. 1381-1384. [6]. Rader, C. M., "Discrete Fourier Transforms when the Number of Data Samples Is Prime,"Proceedings of the IEEE, Vol. 56, June 1968, pp. 1107-1108. [6] Nilanjan Dey, Tanmay Bhattacharya, S.R. Bhadra Chowdhury, “A Session based Multiple Image Hiding Technique using DWT and DCT”, International Journal of Computer Applications (0975 – 8887), Volume 38– No.5, January 2012. [7] Mei Jiansheng, Li Sukang. Tan Xiaomei,” A Digital Watermarking Algorithm Based On DCT and DWT”, Proceedings of the 2009 International Symposium on Web Information Systems and Applications (WISA’09) Nanchang, P. R. China, May 22-24, 2009, pp. 104-107. [8] An Overview of Non-contact Photoplethysmography, Peck Y S Cheang and Peter R Smith, ELECTRONIC SYSTEMS AND CONTROL DIVISION RESEARCH, 2003. [9] Discrete Walsh-Hadamard Transform, http://www.mathworks.in/products/signal/examples.html ?file=/products/demos/shipping/signal/walshhadamardde mo.html [10] T. Beer, Walsh Transforms, American Journal of Physics, Vol. 49, Issue 5, May 1981 [11] Analysis of Photoplethysmographic Signals Modified by Reversible Watermarking Technique using PredictionError in Wireless Telecardiology, Nilanjan Dey, Shouvik Biswas, Anamitra Bardhan Roy, Achintya Das*4, Sheli Sinha Chowdhury, 47th Annual National Convention Of Computer Society Of India, 2012, IEEE Indexed.
[2] Sayantan Mukhopadhyay, Shouvik Biswas, Anamitra Bardhan Roy, Nilanjan Dey, “Wavelet Based QRS
11