18th World IMACS / MODSIM Congress, Cairns, Australia 13-17 July 2009 http://mssanz.org.au/modsim09
Comparison of four expert elicitation methods: For Bayesian logistic regression and classification trees O’Leary, R.A. 12, K. Mengersen 1, J.V. Murray3 and S. Low Choy1 1
School of Mathematical Sciences, Queensland University of Technology, Brisbane, QLD 4001, Australia 2 Australian Institute of Marine Science, University of Western Australia (M096), Crawley WA 6009 3 School of Integrative Biology, University of Queensland, Brisbane QLD 4072, Australia Email:
[email protected]
Abstract: In the ecological field, expert opinion has been acknowledged as providing valuable information in modelling, particularly when the observed data are limited or unreliable. Indeed international recommendations are that expert-driven models are to be preferred to statistical models for habitat modelling (Langhammer et al., 2007). However expert-driven models are not calibrated to empirical data and therefore rely entirely on the credibility and expertise of the experts. Bayesian statistical modelling provides a useful bridge between purely expert-driven models and data-driven statistical models. Several methods are available for eliciting expert knowledge into Bayesian statistical models in a variety of contexts, in general (O’Hagan et al., 2006) and in ecology (Low Choy et al., 2009). For example logistic regression (LR) is a common choice for modelling the probability of presence or absence for a species and how this relates to a number of habitat covariates, e.g. vegetation, geology, topography and climate (Guisan and Zimmermann 2000). Recently the authors compared three elicitation methods for Bayesian regression in the context of habitat modelling (O’Leary et al., 2008a). These included a questionnaire-based method (similar to Kuhnert et al., 2005; Martin et al., 2005), which simply asks experts whether each covariate xj increases, decreases or has essentially no effect on the response y. Alternatively using a software tool (Kynn 2005), experts could also be asked to draw a species response curve showing how the probability of presence (on the y-axis) changed with a particular habitat covariate such as geology type (on the x-axis), with all other covariates held at their optimum. Finally an elicitation tool embedded within a GIS (Denham and Mengersen 2007) could be used to help experts select sites on a map, inspect the habitat characteristics at and surrounding each site, and then assess the probability of presence at each site. These three approaches were compared for habitat suitability modelling of the threatened Australian brush-tailed rock-wallaby Petrogale penicillata (O’Leary et al., 2008a). This comparison found substantial differences in the three elicitation approaches in how the expert knowledge translated into the Bayesian statistical model. In this paper we extend this comparison to consider a method, newly developed by the authors (O’Leary et al., 2008b), for elicitation of expert opinion into Bayesian classification trees. Logistic regression and classification trees are obvious contenders for modelling the relationship between a binary response (e.g. presence/absence) and several covariates. Indeed classification trees are another statistical modelling approach often applied in the habitat modelling context (Murray et al., 2008), popular since they provide an easily understood graphical representation of a decision tree. Until recently, however, no method was available for incorporating expert knowledge into classification trees. Using the new approach, elicitation questions focus on the size of the tree representing the number of decisions; the relative importance of the covariates; and the splitting rules for the most important covariates which quantify how decisions relate to variables (O’Leary et al., 2008b). Hence this paper compares four elicitation approaches for modelling the habitat suitability of the rockwallaby, using the same dataset: three Bayesian logistic regression methods and one Bayesian classification tree method. We found that there were some dissimilarities between the expert informed priors formulated using the different methods, but all approaches identified that northern aspects have the highest probability of presence. This paper demonstrates that combining expert informed priors with limited observed data using one or more of the elicitation approaches may improve scientific understanding and therefore contribute to conservation management planning. Keywords: Bayesian classification and regression trees; Bayesian logistic regression; expert elicitation; informative priors.
4276
O’Leary et al., Expert elicitation for Bayesian classification trees
1.
INTRODUCTION
An important phase in informative Bayesian analysis is the elicitation of expert information and its representation as prior distributions. Expert elicitation is a formal approach of acquiring experts’ prior beliefs about possible values of parameters in terms of probability, as comprehensively reviewed in general by O’Hagan et al. (2006) and in the psychological literature by Kynn (2008). An expert has been defined as someone who has knowledge of the subject of interest (e.g. Garthwaite et al., 2005) and gained through at least ten years’ education, training and experience in the field (Chi et al., 1988). There are many types of experts. In habitat modelling Denham and Mengersen (2007) identify field-based experts who prefer assessing probabilities at specific sites, and theoretical experts who prefer assessing trends across sites. Bayesian statistical modelling is valuable in research areas such as ecology, particularly useful when the data are limited in sample size or representativeness (Low Choy et al. 2009). For generalized linear models (GLMs), there are elicitation methods available for: zero inflated Poisson regression (Kuhnert et al., 2005; Martin et al., 2005), normal linear models (Kadane et al, 1980), and logistic regression (e.g. Denham and Mengersen, 2007). O’Leary et al. (2008a) compared three elicitation approaches for Bayesian logistic regression (Denham and Mengersen, 2007; Kynn, 2005; O’Leary 2008). However, to date, only one elicitation approach has been suggested for Bayesian classification trees (O’Leary et al., 2008b). In this paper we extend the comparison in O’Leary et al. (2008a) to include the expert elicitation approach for Bayesian classification trees (O’Leary et al., 2008b). These four elicitation methods were trialled on one expert in order to model the habitat suitability of the threatened Australian brush-tailed rock-wallaby (Petrogale penicillata). 2.
CASE STUDY
The Australian brush-tailed rock-wallaby (Petrogale penicillata) is listed as threatened in Queensland, endangered in New South Wales, critically endangered in Victoria and extinct in the Australian Capital Territory. Greater understanding of its habitat requirements is necessary for better management and conservation of this species. The study area was located in Southeast Queensland, along the Great Dividing Range. We focus on the dataset used as the basis for the previous comparison (O’Leary et al., 2008a), which contains 50 sites, with the species present at 41 sites. These data form a subset of a larger dataset of 200 sites, with survey design and protocol detailed in Murray et al. (2008). There are 11 habitat variables; the categorical variables are geology, habitat complexity, aspect (north, northwest, northeast and west versus other) and forest type; and continuous variables are height, elevation, slope and length. As is common in expert assessment of rare species (e.g. Denham and Mengersen 2007), only one knowledgeable expert was available. The expert we questioned is acknowledged as the best expert on this species, whilst other experts only have partial or historical knowledge. This expert had recent, local knowledge of the species, GIS experience and some statistical knowledge. 3.
BAYESIAN STATISTICAL MODELS 3.1.
Bayesian logistic regression (LR)
The habitat suitability of the rock wallaby can be modelled using logistic regression (LR) with overdispersion. The observed data are modelled as yi ~ Bernoulli ( pi ) , where yi is the observed presence (1) or absence (0) of the species at site i = 1,, n and pi is the probability of presence at site i.
Then
p logit( pi ) = log i = β 0 + β1 xi1 + + β J xiJ + ε i , where β is the intercept; β are the coefficients j=1,…,J 0 j 1 − pi
associated with each environmental habitat variables xi1 ,, xiJ ; and ε i ~ N (0,σ 2 ) allows for extra binomial variation across sites. Independent multivariate normal (MVN) priors can be placed on the regression coefficients β j ~ MVN ( μ j ,Σ ) , Σ = diag σ β , , σ β if no information about a coefficient is available or 1 j
(
)
non-informative priors are desired. If, however, expert opinion is available about the coefficients, either directly or indirectly, this can be used to refine the values of hyperparameters μ j and Σ .
4277
O’Leary et al., Expert elicitation for Bayesian classification trees
3.2.
Bayesian Classification Trees (CT) 3.3.
Forest =Closed/Dry
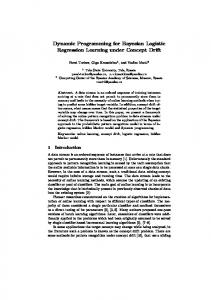
We explain the mathematical notation for trees by referring to the tree in Figure 1. The root node (k=1) is at the top, and the tree progressively branches to reach the K=5 terminal nodes found at the ends of the branches on the tree. This tree shows 4 variables of the 11 (J=11) fit in the model.
North = Yes Pres 8/0 Slope>31 Pres 21/0 Geology = not basalt
Consider the first branch at node S1=1. The variable forest defines the first split V1. The splitting rule R1 splits the data into a left and right branch, At respectively yi ∈ R1 = Closed/Dry forest or yi ∉ R1 . the left-most branch, we have a terminal node with estimated probability of presence p1 = 8/(8+0) = 1.0.
Abs 2/4 Pres 6/0
Notation
Abs 4/5
3.4.
Model
Figure 1. The best tree acquired using noninformed priors for BCART method.
Bayesian approaches to inference for classification and regression trees (BCART) were proposed by Chipman et al. (1998), Denison et al. (1998) and Buntine (1992). The joint distribution is p(K ,θ k , y ) = p(K ) p(θ k | K ) p( y | K ,θ k ) , where K is the tree size (number of terminal nodes), the parameter set θ k = { Rk , Sk ,Vk } depends on K, y is binary response variable taking values {0,1} with likelihood p ( y | K ,θ k ) . For classification trees (CT), observations are assumed to K
N
m have a multinominal distribution, so the likelihood is p( y | K ,θ k ) ∝ ∏∏ ( pkl ) . . Here mkl is the number of kl
k =1 l =1
data points at terminal node k, which are classified into category l, and pkl is the corresponding probability. A conjugate Dirichlet prior can be adopted for pkl. In the absence of other information, a uniform distribution can be used to define a non-informative prior so that π ( p k1 ,, p kJ ) = DirL-1 ( p k1 ,, p kL | 1,1). The full prior for the model is p (θ k | K ) p (K ) = p (Sk | K ) p (Vk | Sk , K ) p (Rk | Vk , Sk , K ) p (K ). Dirichlet priors may be allocated to
several elements of the prior: selecting possible splitting nodes via p(S k |, K ) = Dir (S k | α S ,α S ) ; specifying important variables Vk that determine the split at node Sk via p(Vk | Sk , K ) = Dir(Vk | αV ,αV ) ; defining splitting 1
1
k
k
rules Rk for variable Vk at node Sk via p (Rk | Vk , S k , K ) = Dir (Rk | α R ,α R ). A straightforward choice of prior λk . This prior imposes a left limit of k ≥ 1 p(K) is a truncated Poisson with parameter λ: p ( K ) = λ 1
k
(e − 1)k !
because the minimum model contains one terminal node. A previous computational approach for BCART adopted a stochastic search algorithm to efficiently explore part of the parameter space (Chipman et al. 1998). We apply the algorithm of O’Leary (2008b). This simulates the joint posterior distribution using reversible jump Markov chain Monte Carlo (Denison et al. 1998), considering four main transitions for tree structure θk: changing the splitting variable Vk or the splitting rule Rk at some node k, or adding or deleting a terminal node Sk. The stopping criterion and identification of good trees applied by O’Leary (2008b) is achieved through several accuracy measures (Fielding and Bell, 1997): the overall misclassification rate (MCR), the misclassification of presences or false negative rate (FNR) and the misclassification of absences or false positive rate (FPR). 4. 4.1.
EXPERT ELICITATION APPROACHES Elicitation for logistic regressions.
Method A: The approach of Denham and Mengersen (2007) is an indirect method of elicitation (Spetzler and Staël von Holstein, 1975) that was designed for environmental modelling. This method takes advantage of the geographic nature of these problems by embedding the elicitation in a Geographic Information System (GIS), or map-based software. The expert is asked to predict the response at several sites, one at a time, each with known covariate values. This interactive map-based tool is used to elicit site-based predictions from a
4278
O’Leary et al., Expert elicitation for Bayesian classification trees single expert for a LR model (although the approach can be extended to all generalised linear models (GLM)). To aid the expert during the elicitation, statistical and graphical feedback was automated by the software. Method B: Kynn (2005) developed an interactive indirect graphical tool called ELICITOR, which is now an add-in to WinBUGS (www.winbugsdevelopment.org.uk). By asking experts to graph the univariate relationship between the response and one covariate (with all others held constant), it elicits species response curve predictions from a single expert for the LR model, and more recently for all GLM models. This method was inspired by Bedrick et al. (1996) and Garthwaite (1998). Method C: Martin et al. (2005) proposed a direct approach for eliciting opinion, using questionnaires, from multiple experts on a single covariate for zero inflated Poisson regression. O’Leary (2008) adapted this approach to single or multiple experts and multiple covariates in the LR context and extended the questionnaire to include elicitation of measures of confidence. Experts are simply asked whether each covariate increases, decreases or has no effect on the response. This simple elicitation method does not require experts to know about probabilities or distributions. 4.2.
Elicitation for classification trees (CT)
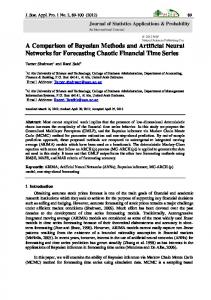
Figure 2. Prior (dashed line) & posterior (solid line) plots of aspect parameter in model, in which expert informed priors are black lines and weakly informative priors grey. Expert informed priors were obtained from method A (top plot), method B (middle) and method C (bottom) for logistic regression model.
Method D: O’Leary et al. (2008) developed an elicitation approached for CT for a single expert. The expert is questioned about the size of tree, relative importance of covariates, and splitting rules of most important variables. O’Leary et al. (2008b) discussed three elicitation approaches, however in this paper we will only detail the methodology and results of one method: numeric weights. This method involves the expert attaching a numeric weight to each item. We provided a sense of scale by encouraging (but not insisting on) weights between 0 and 100, and we scaled the final weights to sum to 100. For the size of the tree K (number of terminal nodes), we elicited the “preferred tree size” and as a baseline, the “largest possible tree size” (minimum and maximum number of terminal nodes), thus relying on the expert’s ability to interpret a CT model. The expert was asked to order the tree sizes, between this minimum and maximum, according to whether they were considered the least to most preferred. Then for each tree size the expert provided a numeric weight. The value of λ in p(K) prior was chosen to reflect these preferences. For the variable prior p(Vk | Sk , K ) , elicitation entailed asking the expert to “identify the most important variables for predicting the presence of rockwallaby”. The expert was asked to weight the importance of each variable. Then the expert’s weights were expressed as probabilities defining αV in the Dirichlet prior p(Vk | Sk , K ) .
North=Yes
Height >36 Pres 26/0
k
Pres 9/1
Abs 6/8
For the splitting rule prior p(Rk | Vk , Sk , K ) , the expert was questioned about the splitting rules for each of the most important variables identified above. For simplicity we only asked about the splitting rule of a
Figure 3. The best tree acquired using expert informed priors for BCART method.
4279
O’Leary et al., Expert elicitation for Bayesian classification trees particular variable for the topmost node of the tree (the first splitting node). For categorical variables, the expert estimated the probability of presence at each level. For continuous variables, we elicited the optimum, lower and upper quartile for which the expert expected to observe rock-wallabies. For each variable, these elicited probabilities define the α R in the Dirichlet prior p(Rk | Vk , Sk , K ) . When no information was available, non-informative uniform priors were used: p(Vk | S k , K ) = Dir (Vk | 1, ,1) , k
p (Rk | Vk , S k , K ) = Dir (Rk | 1, ,1) and p (S k | K ) = Dir (S k | 1, ,1) . For assessing sensitivity to priors, a weakly
informative prior for tree size set λ=10 in p(K), following Denison et al. (1998). 5.
COMPARISON OF FOUR ELICITATION APPROACHES
Although the four elicitation methods have a common purpose, there are substantive differences as summarised in Table 1. The main benefits of the elicitation approach for CT compared to LR is that Method D (for CT) is the only method which encodes variable selection. However, LR elicitation methods could utilize elicited information on important variables to encode variable selection by adding additional hierarchy to the model. Method D relies on some understanding of the CT model (size of tree and splitting variables) whereas Methods A and C do not require understanding of LR. Different information is elicited when asking the expert about the effects of covariates on the response. For LR, the response increases or decreases smoothly with changes in covariates, whereas in CT the response changes in “jumps” for each subset (sequence of rules) of covariate space. Table 1. Advantages and disadvantages of four elicitation methods. Method A Method B ADVANTAGES 1. Accomplished remotely 2. Elicitation method repeatable 3. Flexibility of model structure 4. Easily handles multiple experts 5. Important variables are identified by experts 6. Quick and simple 7. Model feedback during elicitation 8. Do not need to understand statistical model 9. Takes advantages of spatial nature of data 10. Exploits quantifiable ecological knowledge 11. Incorporates model-based variable selection 12. Identifies high-order interactions which is useful for ecological data DISADVANTAGES 13. Knowledge of basic probability theory 14. Limited to landscape scale variables 15. Complex elicitation software required 16. Some level of model understanding required 6.
Method C
Method D
RESULTS
Here, for the three LR methods (A, B and C) the variable aspect is used to illustrate and compare the prior and posterior distributions. Refer to Section 3.1 of O’Leary et al. (2008a) for details on results from comparing the three LR elicitation methods for aspect and slope, using a different dataset. For the CT (method D), the numeric weights stated by the expert were: for tree size 2 to 6, weights were 5, 30, 30, 20, 15; for importance of variables weights were habitat complexity=70, geology=10, height=5, slope=5, north=3, northwest=3, northeast=1, west=1, forest type=2, elevation=1, and length=1. The splitting rules for habitat complexity and geology were also elicited (see O’Leary et al., 2008b), however here only non-informative priors for splitting rules p(Rk | Vk , S k , K ) were used. Figure 2 displays, for methods A to C (LR methods), the non-informative priors, the expert informed priors and the posterior distributions of aspect generated from each of these priors. The prior and posterior distributions for all 3 LR methods have been standardised so that all distributions are on the same scale. Each LR method elicited different characteristics of the aspect coefficient, making comparison difficult. The prior distributions acquired using either LR methods (methods A to C; Figure 2) and CT (method D; elicitation results above) reflect the belief that the probability of presence is higher at sites with northerly
4280
O’Leary et al., Expert elicitation for Bayesian classification trees aspects. The posterior distributions under non-informative or expert defined priors using LR (methods A to C) are displayed in Figure 2. The posterior distributions from priors obtained from methods A and C are similar to those with non-informative priors using the LR model, indicating that the opinion of the expert concurs with the data for methods A and C. The tree with the lowest false negative rate (FNR) obtained under non-informative and expert informed priors are depicted in Figures 1 and 3 respectively. When expert informed priors were combined with data using method D (CT) this identified a tree (Figure 3) with a FNR of 0.15, false positive rate (FPR) of 0.11, posterior probability of -14.26 and deviance of 25.63. The non-informative priors obtained slightly lower FNR of 0.12, and the same FPR, posterior probability and deviance (Figure 1). The posterior trees from noninformative and expert informed priors both included northern aspect and height variables. Applying expert informed priors resulted in identifying a tree more comparable to the expert’s opinion than when noninformative priors were used. O’Leary et al. (2008b) applied the elicited information to the larger rockwallaby dataset (with N=200); and found that the best tree using expert informed priors had a lower FNR than the best tree using non-informative priors. Tables 1, 2, 3 and 4 display the loss matrix acquired from methods A, B, C and D respectively. Method A predicts all presences as absences and eight absences are predicted correctly. Both methods B and C predict all presences correctly, however all nine absences are misclassified as presences. Method D predicts absences as well as method A, but more presences are predicted correctly. The method with the best predictions overall, of both presences and absences, is method D (CT). This method achieved FNR of 0.15 and FPR of 0.11, whereas method A has FNR of 1 and FPR of 0.11, and methods B and C have FNR of 0 and FPR of 1. Table 2. Loss matrix obtained from method A. Observed Predicted
Presence Absence
Presence 0 41
Absence 1 8
Table 4. Loss matrix obtained from method C. Observed Predicted
7.
Presence Absence
Presence 41 0
Absence 9 0
Table 3. Loss matrix obtained from method B. Observed Predicted
Presence Absence
Presence 41 0
Absence 9 0
Table 5. Loss matrix obtained from method D. Observed Predicted
Presence Absence
Presence 35 6
Absence 1 8
DISCUSSION AND CONCLUSIONS
This paper compares four elicitation methods, three for Bayesian logistic regression (LR) and one for Bayesian classification trees (CT): a geographically-assisted indirect LR method (Denham & Mengersen; 2007); a graphically-assisted indirect LR method (Kynn2005); a questionnaire delivered LR method that elicits a simplified version of the expert’s opinion directly (O’Leary et al., 2008a); and a simple questionnaire suitable for direct elicitation for CTs (O’Leary et al 2008b). The opinions of one expert were elicited using these four approaches with the intention of modelling the habitat suitability of the threatened Australian brush-tailed rock-wallaby. These four methods differed according to the form of the model (likelihood), the elicitation design and protocol, the prior model, the elicitation tool and requirement for a facilitator. The elicitation method that resulted in the best predictions of both presences and absences was CT (method D). The results show that the approach of elicitation can indeed affect an expert-based prior. For the aspect coefficient, the comparison of the prior and posterior distributions was difficult, since each method elicited different characteristics of this variable. However, all four approaches ascertained that the experts’ opinion was that sites with northern aspects have the highest probability of presence. For consistency with previous LR elicitation comparisons (O’Leary et al., 2008a), the observed dataset of the rock-wallaby case study used to compare the four elicitation methods comprised an initial 50 observed sites. As is typical with rare and threatened species there is only one expert with current and comprehensive knowledge of the species. This trial reveals that one expert’s knowledge can impact models of rare event data, such as rare and threatened species presence, providing additional information that may not be represented in the small dataset. The BCART method was also applied to combine expert opinion with empirical data on 200 sites from a later study (O’Leary et al., 2008b). It was found that better predictions of the presences were obtained when expert informed priors were applied compared to non-informative priors. This issue is important. Since this species is threatened in Queensland, a priority of conservation management is to develop a model that accurately predicts presence of the species, even more so than
4281
O’Leary et al., Expert elicitation for Bayesian classification trees absence. This study provides a concrete example demonstrating that both the underlying model and elicitation method impact the information elicited, the posterior estimates obtained, as well as predictive performance. REFERENCES Bedrick, E. J., R. Christensen, and W. Johnson (1996). A new perspective on priors for generalized linear models. Journal of the American Statistical Association 91, 1450–1460. Chi, M. T. H. C., R. Glaser, and M. J. Farr (Eds.) (1988). The nature of expertise. New Jersey: Lawrence Erlbaum Associates. Chipman, H. A., E. I. George, and R. E. McCulloch (1998). Bayesian CART model search. Journal of the American Statistical Association 93 (443), 935-960. Denham, R. and K. Mengersen (2007). Geographically assisted expert elicitation for species’ distribution models. Bayesian Analysis 2(1), 99–136. Denison, D., B. Mallick, and A. Smith (1998). A Bayesian CART algorithm. Biometrika 85 (2), 363-377. Fielding, A. H. and J. F. Bell (1997). A review of methods for the assessment of prediction errors in conservation presence/absence models. Environmental Conservation 24 (1), 38-49. Garthwaite, P. H. (1998). Quantifying expert opinion for modelling habitat distributions. Sustainable Forest Management Technical Report, Department of Natural Resources Queensland. Garthwaite, P. H., J. Kadane, and A. O’Hagan (2005). Statistical methods for eliciting probability distributions. Journal of the American Statistical Association 100(470), 680–700. Guisan, A. and N. E. Zimmermann (2000). Predictive habitat distribution models in ecology. Ecological Modelling 135, 147–186. Kadane, J. B., J. M. Dickey, R. L. Winkler, W. S. Smith, and S. C. Peters (1980). Interactive elicitation of opinion for a normal linear model. Journal of the American Statistical Association 75, 845–854. Kuhnert, P. M., T. G. Martin, K. Mengersen, and H. P. Possingham (2005). Assessing the impacts of grazing levels on bird density in woodland habitat: a Bayesian approach using expert opinion. Environmetrics 16(7), 717–747. Kynn, M. (2005). Eliciting expert knowledge for Bayesian logistic regression in species habitat modelling in natural resources. PhD thesis, Queensland University of Technology. Kynn, M. (2008). The ‘heuristics and biases’ bias in expert elicitation. Journal of the Royal Statistical Society, Series A 171, 239–264. Langhammer, P. F., M. I. Bakarr, L. A. Bennun, T. M. Brooks, R. P. Clay, W. Darwall, N. D. Silva, G. J. Edgar, G. Eken, L. D. C. Fishpool, G. A. B. da Fonseca, M. N. Foster, D. J. Knox, P. Matiku, E. A. Radford, A. S. L. Rodrigues, P. Salaman, W. Sechrest, and A. W. Tordoff (2007). Identification and gap analysis of key biodiversity areas: Targets for comprehensive protected area systems. Technical report, IUCN (The World Conservation Union): Gland, Switzerland. Low Choy, S., O'Leary, R. A., and Mengersen, K (2009). Elicitation by design in ecology: using expert opinion to inform priors for Bayesian statistical models. Ecology 90:265-277. Martin, T. G., P. M. Kuhnert, K. Mengersen, and H. P. Possingham (2005). The power of expert opinion in ecological models: a Bayesian approach examining the impact of livestock grazing on birds. Ecological Applications 15(1), 266–280. Murray, J., S. J. Low Choy, C. McAlpine, H. Possingham, and A. Goldizen (2008). The importance of ecological scale for wildlife conservation in naturally fragmented environments: A case study of the brush-tailed rock-wallaby (Petrogale penicillata). Biological Conservation 141, 7–22. O’Hagan, A., C. E. Buck, A. Daneshkhah, J. R. Eiser, P. H. Garthwaite, D. J. Jenkinson, J. E. Oakley, and T. Rakow (2006). Uncertain Judgements: Eliciting Expert Probabilities. United Kingdom: Wiley. O'Leary, R. A. (2008). Informed Statistical Modelling of Habitat Suitability for Rare and Threatened Species, School of Mathematical Sciences, Queensland University of Technology, PhD Thesis. O'Leary, R. A., Low Choy, S., Kynn, M., Denham, R., Martin, T., Murray, J., and Mengersen, K (2008a). Comparison of three expert elicitation methods for logistic regression on predicting the presence of the threatened brush-tailed rock-wallaby Petrogale penicillata. Environmetrics 20: 379-398. O'Leary, R. A., Murray, J., Low Choy, and Mengersen, K (2008b). Expert Elicitation for Bayesian Classification Trees. Journal of Applied Probability & Statistics 3: 95-106. Spetzler, C. S. and C. S. Staël von Holstein (1975). Probability encoding in decision analysis. Management Science 22(3), 340–358. Thuiller,W., L. Brotons, M. B. Araujo, and S. Lavorel (2004). Effects of restricting environmental range of data to project current and future species distributions. Ecography 27(2), 165–172.
4282