Medical Engineering & Physics 29 (2007) 967–972
Comparison of linear accelerations from three measurement systems during “reach & grasp” S.B. Thies ∗ , P. Tresadern, L. Kenney, D. Howard, J.Y. Goulermas, C. Smith, J. Rigby Centre for Rehabilitation and Human Performance Research, University of Salford, Salford, Manchester, UK Received 11 August 2006; received in revised form 16 October 2006; accepted 17 October 2006
Abstract Given the increased use of accelerometers in movement analysis, validation of such inertial sensors against conventional 3D camera systems and performance comparisons of different sensors have become important topics in biomechanics. This paper evaluates and compares linear acceleration trajectories obtained from two different 3D accelerometers and derived from Vicon position data for an upper limb “reach & grasp” task. Overall, good correspondence between the three measurement systems was obtained. Sources of error are discussed. © 2006 IPEM. Published by Elsevier Ltd. All rights reserved. Keywords: Accelerometers; Xsens; Kionix; Vicon; Signal comparison; Sensors
1. Introduction Accelerometry has long been employed in the analysis of human movements [1]. The use of accelerometers has become increasingly popular over the last decade, offering an inexpensive alternative to optical motion capture systems that allows for the unsupervised monitoring of human motion outside the research laboratory. Areas of application range from movement classification [2], assessment of balance impairments [3] and fall risk [4], to the control of functional electrical stimulation (FES) devices [5]. Despite their increased use in human movement analysis, only a few studies have been concerned with the accuracy of 3D position and orientation data derived from inertial sensor output as compared to position and orientation obtained from 3D camera systems [6,7]. Furthermore, surprisingly little attention has been given to the comparison of accelerations measured directly using accelerometers with accelerations obtained via double differentiation of position data from 3D camera systems.
Rapid technological advancements in the development of micro-fabricated inertial sensors have taken place, resulting in a large number of commercially available products including, most recently, single chip 3D accelerometers. As these products become more readily available, it is important to gain an improved understanding of their characteristics with respect to conventional movement analysis tools, so that the best tool, or combination of tools, can be chosen for a given problem. It is the objective of this paper to compare the accelerations obtained from two commercially available inertial sensors, namely Xsens and Kionix, with accelerations derived from Vicon position data. The Pearson’s correlation coefficient and RMS error were computed for the upper limb acceleration trajectories of a healthy young adult performing a “reach & grasp” task. Possible sources of error are discussed.
2. Methods 2.1. Experiment
∗
Corresponding author. Tel.: +44 161 2952679. E-mail address:
[email protected] (S.B. Thies).
A healthy young adult, who had given informed consent, sat at a table with the hand hanging relaxed at the side of the
1350-4533/$ – see front matter © 2006 IPEM. Published by Elsevier Ltd. All rights reserved. doi:10.1016/j.medengphy.2006.10.012
968
S.B. Thies et al. / Medical Engineering & Physics 29 (2007) 967–972
filter using a cutoff frequency of 6 Hz. The cutoff frequency was determined through frequency domain analysis, which showed that more than 98% of the signal power is below 6 Hz. Furthermore, similar values are used in other upper limb movement studies [8]. Local marker coordinate systems for the wooden boxes on the upper arm and forearm were defined such that each was aligned with its respective Xsens and Kionix coordinate systems: C12 − C11 ||C12 − C11 ||
(1)
Vupper arm = (C12 − C11 ) × (C13 − C11 )
(2)
Xupper arm =
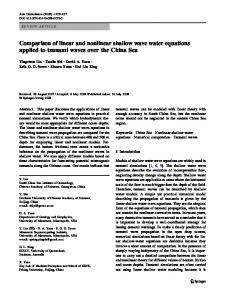
Zupper arm = Fig. 1. Experimental set-up showing marker clusters and accelerometers.
Vupper arm ||Vupper arm ||
Yupper arm = Zupper arm × Xupper arm body. A glass was placed on the table in front of the subject such that it could be reached comfortably without moving the torso. The subject was instructed to reach forward, grasp the glass, briefly move it up towards the mouth, place it back on the table, and retract the arm back to the starting position. This movement task was chosen as it is representative of a variety of activities of daily living with regard to movement frequency and amplitude. Ten trials of this movement task were recorded. 2.2. Instrumentation Two precision-machined wooden boxes, each with a cluster of three reflective markers attached to protruding rods, were attached via Velcro straps to the upper arm and forearm (Fig. 1). Xsens (XSENS, Xsens Technologies B.V., Enschede, The Netherlands) and Kionix (Kionix Inc., Ithaca, New York, USA) inertial measurement units were then secured inside each box such that their sensor coordinate frames were aligned. Both inertial measurement systems provide an appropriate full-scale range (±2 g) and sampling frequency (quoted standard: 250 and 500 Hz for Xsens and Kionix, respectively) for “reach & grasp” tasks. A Vicon set-up (Vicon Motion Systems, Los Angles, USA) consisting of 10 cameras and analog input channels was used to record position data for the reflective markers and the Kionix accelerations, respectively. Xsens data was collected by a separate computer. A pulse signal, captured by one of the Vicon analog channels, was used to synchronize the Xsens data with the other two measurement systems. In this study all kinematic data were sampled at 100 Hz, an adequate sampling frequency for movements with frequency content below 30 Hz.
Xforearm =
C22 − C21 ||C22 − C21 ||
Vforearm = (C22 − C21 ) × (C23 − C21 ) Zforearm =
Vforearm ||Vforearm ||
Yforearm = Zforearm × Xforearm
(3) (4) (5) (6) (7) (8)
Rotation matrices were calculated between the Vicon global coordinate system and the two marker clusters’ local coordinate systems. Position data for each cluster origin (marker C11 and C21 for upper arm and forearm, respectively) were then double differentiated in global coordinates and gravity was added to the vertical acceleration component. Finally, the calculated linear accelerations of each marker cluster’s origin were rotated from global to local coordinates. Linear accelerations obtained from Xsens and Kionix accelerometers were directly compared with those calculated for the marker clusters, taking into account the small offsets between coordinate frame origins. 2.4. Statistical analysis All signals were compared using Pearson’s correlation coefficient (r) and RMS error (ε). Mean values for r and ε across all trials are reported. To investigate the effects of alignment and calibration errors, a least squares linear regression was performed for each pair of signals. The resulting regression equation (y = mx + c) was then applied in order to adjust for any gain and zero offset (i.e. bias). RMS error was then determined a second time for the signals after removal of systematic errors (Pearson’s correlation coefficient was not recomputed since it is invariant to linear transformations).
2.3. Data processing 3. Results All data processing was done within MATLAB® (MathWorks, Inc., Natick, MA, USA). Vicon position data for the markers were low-pass filtered with a 4th order Butterworth
In general, the linear acceleration trajectories closely approximated each other, with slightly more noise on the
S.B. Thies et al. / Medical Engineering & Physics 29 (2007) 967–972
Fig. 2. Example trial data illustrating the acceleration trajectories obtained from the three measurement systems on the upper arm.
Fig. 3. Example trial data illustrating the acceleration trajectories obtained from the three measurement systems on the forearm.
969
970
S.B. Thies et al. / Medical Engineering & Physics 29 (2007) 967–972
Table 1 Comparison between measurement systems located on the upper arm via Pearson’s correlation and RMS error in m/s2 Upper arm
Xsens–Vicon Kionix–Vicon Kionix–Xsens
X
Y
Z
r = 0.988, ε = 0.23 r = 0.984, ε = 0.27 r = 0.995, ε = 0.24
r = 0.997, ε = 0.25 r = 0.996, ε = 0.34 r = 0.998, ε = 0.22
r = 0.947, ε = 0.42 r = 0.947, ε = 0.27 r = 0.987, ε = 0.25
Table 2 Comparison between measurement systems located on the forearm via Pearson’s correlation and RMS error in m/s2 Forearm
Xsens–Vicon Kionix–Vicon Kionix–Xsens
X
Y
Z
r = 0.999, ε = 0.43 r = 0.999, ε = 0.78 r = 1.0, ε = 0.40
r = 0.991, ε = 0.37 r = 0.989, ε = 0.41 r = 0.997, ε = 0.23
r = 0.988, ε = 0.27 r = 0.993, ε = 0.76 r = 0.996, ε = 0.70
Table 3 RMS error in m/s2 for the upper arm after removal of calibration errors Upper arm
Xsens–Vicon Kionix–Vicon Kionix–Xsens
X
Y
Z
ε = 0.20 ε = 0.25 ε = 0.13
ε = 0.23 ε = 0.28 ε = 0.18
ε = 0.25 ε = 0.25 ε = 0.13
a least squares fit. Fig. 4 shows the signals on the forearm’s Z axis before and after this error removal. The RMS errors were lower than before and ranged from 0.13 to 0.28 m/s2 for the upper arm and from 0.15 to 0.41 m/s2 for the forearm.
4. Discussion Kionix and Xsens acceleration trajectories. Fig. 2 shows linear accelerations for the upper arm for all three measurement systems, while Fig. 3 displays the same for the forearm. Differences were observed that might be attributed to calibration errors (poor gain and zero offset adjustments), in particular for the linear acceleration along the Kionix Z axis of the forearm (Fig. 3, bottom). Tables 1 and 2 show Pearson’s correlation coefficients and RMS errors between the acceleration trajectories of the three different measurement systems. For the upper arm high correlation coefficients (0.947 ≤ r ≤ 0.998) were obtained for all comparisons. The RMS errors ranged from 0.22 to 0.42 m/s2 . Similarly, comparison between systems on the forearm resulted in high values for r. However, when comparing Kionix with Vicon for the forearm the RMS errors were 0.78 and 0.76 m/s2 for X and Z axes respectively—much greater than for any other signal comparison. Likewise, the Z axis for the comparison of Kionix with Xsens showed a large RMS error of 0.70 m/s2 . Tables 3 and 4 show the RMS errors between measurement systems after systematic errors were removed via Table 4 RMS error in m/s2 for the forearm after removal of calibration errors Forearm
Xsens–Vicon Kionix–Vicon Kionix–Xsens
X
Y
Z
ε = 0.21 ε = 0.24 ε = 0.15
ε = 0.37 ε = 0.41 ε = 0.20
ε = 0.27 ε = 0.20 ε = 0.16
Overall the Xsens, Kionix and Vicon measurement systems performed similarly. Good correspondence was obtained between all three systems, despite the challenges associated with sensor alignment and signal noise. We chose a “reach & grasp” task because movement amplitude and frequency are similar to those of a variety of activities of daily living. It is expected that other motions of similar amplitude and frequency content would result in very similar results. However, motions with larger amplitudes may result in ‘clipping’ of the accelerometer signal although this can be addressed by using accelerometers with a larger measurement range. Similarly, a higher cutoff frequency would be required when filtering the Vicon marker position data for motions with higher frequency content. Although only one healthy individual was used in this study, we would not expect any significant differences in the results from other subjects performing a similar movement. Since the markers and inertial measurement units were attached to the same rigid wooden boxes, anthropometric differences and skin movement artifacts do not affect the data collection. However, where the amplitude and frequency spectrum of the motion are different due to a medical condition (e.g. tremor following a stroke) the outcome of the comparison may differ. The fact that less noise was observed on the Vicon-derived accelerations than on the accelerometer signals is due to the low-pass filtering of the marker position data. Xsens and Kionix signals were compared without any further pro-
S.B. Thies et al. / Medical Engineering & Physics 29 (2007) 967–972
971
Fig. 4. Linear Z acceleration of the forearm before (top) and after (bottom) removal of calibration errors using a least squares fit.
cessing in order to show the difference between “actual” accelerometer output and typical Vicon data processed using widely accepted procedures. A low-pass filter could equally be applied to the accelerometer signals to improve comparability between systems. Care must be taken to align the Vicon and accelerometer measurement frames since the errors due to misalignment may be significant as a result of the accelerometers’ sensitivity to the gravity vector. In this work, the accelerometers were secured in a precision-machined wooden box, with markers attached, in order to align the coordinate frames. To minimize the effects of calibration errors (i.e. gain errors and zero offsets), a least squares linear regression was performed for each pair of signals to be compared (Tables 3 and 4). Other possible sources of error include misalignment of the measurement axes with respect to the accelerometers’ outer shells and cross axis sensitivity due to the axes not being exactly orthogonal. However, the Kionix accelerometer is quoted as having low cross axis sensitivity, suggesting that internal misalignment is small, and the Xsens calibration process corrects for errors in orthogonality. We conclude that accelerometer units such as Xsens and Kionix are a satisfactory substitute for Vicon cameras when recording segmental linear accelerations. Their application has the advantage of enabling researchers to perform tests outside the gait laboratory. Future studies may investigate different filtering techniques and/or the introduction of artificial noise to accelerations calculated from camera data where the requirement is to simulate real accelerometers [8,9].
Conflict of interest statement No financial or personal relationship exists between the University of Salford and Xsens Technologies, Vicon Motion Systems, or Kionix Inc. Therefore no conflicts of interest influenced this work.
Acknowledgements The authors would like to thank the European Technology for Business Ltd. (ETB) for the interfacing of the Kionix IMU and are thankful for the European Union’s funding of the Framework VI Project Healthy AIMS (Ambient Intelligent Microsystems): http://www.healthyaims.org.
References [1] Gage H. Accelerographic analysis of human gait. Washington, DC: ASME; 1964. [2] Mathie MJ, Celler BG, Lovell NH, Coster ACF. Classification of basic daily movements using a triaxial accelerometer. Med Biol Eng Comput 2004;42:679–87. [3] Moe-Nilsen R. Test-retest reliability of trunk accelerometry during standing and walking. Arch Phys Med Rehabil 1998;79:1377–85. [4] Menz HB, Lord SR, Fitzpatrick RC. Acceleration patterns of the head and pelvis when walking are associated with risk of falling in communitydwelling older people. J Gerontol 2003;58A:446–52. [5] Tong KY, Mak AFT, Ip WY. Command control for functional electrical stimulation hand grasp systems using miniature accelerometers and gyroscopes. Med Biol Eng Comput 2003;41:710–7.
972
S.B. Thies et al. / Medical Engineering & Physics 29 (2007) 967–972
[6] Giansanti D, Maccioni G. Comparison of three different kinematic sensor assemblies for locomotion study. Physiol Measure 2005;26:689–705. [7] Boonstra MC, van der Slikke RMA, Keijsers NLW, van Lummel RC, Malefijt MCD, Verdonschot N. The accuracy of measuring the kinematics of rising from a chair with accelerometers and gyroscopes. J Biomech 2006;39:354–8.
[8] Tong KY, Granat MH. Virtual artificial sensor technique for functional electrical simulation. Med Eng Phys 1998;20:458–68. [9] Healthy AIMS (Ambient Intelligent Microsystems), EU Framework VI Project: http://www.healthyaims.org.