Comparison of Material Properties and Microstructure of Specimens Built Using the 3D Systems Vanguard HS and Vanguard HiQ+HS SLS Systems T. J. Silverman, A. Hall, B. South, W. Yong and J. H. Koo* Laboratory for Freeform Fabrication Department of Mechanical Engineering The University of Texas at Austin Austin, TX 78712 * Corresponding
author:
[email protected]
Abstract The HiQ upgrade to the 3D Systems Vanguard selective laser sintering (SLS) machine incorporates a revised thermal calibration system and new control software. The paper compares the tensile modulus, tensile strength, elongation at break, flexural modulus, Izod impact resistance and microstructure of two batteries of standard specimens built from recycled Duraform PA (Nylon 12). The first set is built on a Vanguard HS system and the second on the same system with the HiQ upgrade installed. The upgrade reduces user intervention, decreases total build time and improves surface finish. However, using the default processing parameters, tensile, flexure and impact properties are all found to decline after the upgrade is installed.
1
Introduction
The Vanguard HS selective laser sintering (SLS) machine can be upgraded to HiQ+HS by the manufacturer, 3D Systems, Incorporated. The upgrade comprises new infrared sensors for the feed bins, a calibrating blackbody mounted on the roller carriage and updated software that performs real-time temperature calibration and control. In previous work [1], we built a battery of mechanical test specimens from recycled DuraForm PA (Nylon 12) powder using a Vanguard HS machine, installed the HiQ upgrade, then repeated the build. The specimens were then tested with reference to the applicable ASTM standards. The microstructure of typical specimens was evaluated using scanning electron microscopy (SEM). A summary of the previous work [1] is presented here, followed by interpretation and recommendations for industrial and research practices and for future work.
392
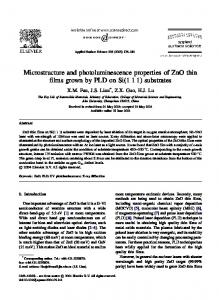
Figure 1: The specimen battery used to quantify the upgrade performance.
2
Experimental procedure
The specimen battery contains a total of 240 ASTM standard tensile, flexure and impact test specimens [2-4], ten in each possible orientation (Figure 1). The specimens are arranged as close to the center of the build area as possible. They are uniquely numbered so that the effects of position and orientation on material properties can be analyzed. The battery was built using DuraForm PA (Nylon 12) material recycled from part cake from a local service bureau. The powder was blended and its consistency checked using a prescribed procedure based on melt flow index (MFI) [2]. The specimen batteries were built using the 3D Systems recommended parameter values, shown in Table 1. The part bed temperature for the HS build was selected manually using the “find temps” procedure. Because of its self-calibration capability, the HiQ+HS machine does not require the “find temps” procedure to be performed for materials with a built-in configuration file, including DuraForm PA. For materials without predefined parameter configurations, the procedure must only be performed once. Table 1: Manufacturer-recommended processing parameters were used for both specimen builds.
Part Heater Set Point Left and Right Feed Heater Set Point Fill Laser Power Powder Layer Thickness
HS HiQ+HS 152.0 C 173.0 C 130.0 C 140.0 C 42 W 42 W 0.004 in 0.004 in
The HS build lasted 26 hours, while the HiQ+HS build lasted 20 hours. The HS build had a notably stiffer part cake that was harder to remove than the flour-like part cake in the HiQ+HS build. The surface finish of the pre-upgrade specimens was noticeably rougher than that of the post-
393
pre-upgrade
x=1499, Σ=85
x=1595, Σ=50 14
14
12
12
12
10
10
10
8
8
8
6
6
6
4
4
4
2
2
2
887 1045 1203 1361 1519 1677
887 1045 1203 1361 1519 1677
887 1045 1203 1361 1519 1677
x=1174, Σ=105
post-upgrade
x=1558, Σ=66
14
x=1473, Σ=40
x=1123, Σ=151
14
14
14
12
12
12
10
10
10
8
8
8
6
6
6
4
4
4
2
2
2
887 1045 1203 1361 1519 1677
887 1045 1203 1361 1519 1677
887 1045 1203 1361 1519 1677
x orientation
y orientation
z orientation
Figure 2: Histograms for tensile modulus (MPa) by orientation for both builds.
upgrade specimens. Surface powder was removed from the specimens using glass bead abrasive. The specimens were then tested with reference to the appropriate ASTM test procedures [2-4].
3
Results and discussion
The previously published values [1] for tensile modulus and elongation at break are incorrect due to an equipment limitation which led to a deviation from the ASTM tensile test procedure [3]. The values given here have been corrected and can be compared to each other. Illustrative comparisons can be made to other data collected using the same standard, but detailed quantitative comparison may not be valid. The material data sheet to which the previous work [1] refers has been shown to contain errors [4]. The comparisons here are to the old data sheet [5], the corrected data sheet [6], which may contain a spurious impact resistance figure, and the ASTM specification for injected or extruded general purpose Nylon 12 [7].
3.1
Tensile properties
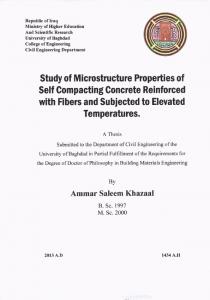
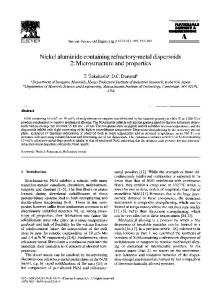
Tensile properties show strong variation with respect to orientation in the build volume. Histograms for tensile modulus (Figure 2), ultimate tensile strength (Figure 3) and elongation at break (Figure 4) are separated by orientation. The tensile properties are best in specimens with the y orientation, that is, with their longest dimension along the build volume’s y axis. The overall mean pre-upgrade tensile modulus and
394
pre-upgrade
x=47, Σ=1
x=49, Σ=2 19 18
19 18
16
16
16
14
14
14
12
12
12
10
10
10
8
8
8
6
6
6
4
4
4
2
2
2
21
27
33
40
46
52
21
27
x=36, Σ=3
post-upgrade
x=48, Σ=2
19 18
33
40
46
52
21
x=44, Σ=1 19 18
19 18
16
16
16
14
14
14
12
12
12
10
10
10
8
8
8
6
6
6
4
4
4
2
2
2
27
33
40
46
52
x orientation
21
27
33
40
33
40
46
52
46
52
x=30, Σ=6
19 18
21
27
46
52
y orientation
21
27
33
40
z orientation
Figure 3: Histograms for ultimate tensile strength (MPa) by orientation for both builds.
ultimate strength approach the manufacturer specified properties, shown in Table 2. Elongation at break is shown to be below the specified value both before and after the upgrade. All three tensile properties that were measured substantially declined between the two builds studied here. This indicates that, with the default, manufacturer-recommended processing parameters, the upgrade may not result in improved tensile properties.
3.2
Flexural modulus
Flexural modulus does not vary substantially with the orientation of the test specimen in the build volume. Histograms for flexural modulus are shown in Figure 5. Table 2: Comparison of overall mean of measured material properties with manufacturer and ASTM specifications.
Tensile modulus (MPa) Ultimate tensile strength (MPa) Elongation at break (%) Flexural modulus (MPa) Impact resistance (J/m)
HS 1550 48 7 1860 242
HiQ+HS 1256 37 5 1383 211
395
Old 3D spec. [5]
New 3D spec. [6]
ASTM spec. [7]
1600 44 9 1285 214
1586 43 14 1387 32
– 35 – 1000 –
pre-upgrade
x=7.5, Σ=0.6
x=9.5, Σ=0.8 13 12
13 12
10
10
10
8
8
8
6
6
6
4
4
4
2
2
2
2.5
4.1
5.7
7.4
9.
10.6
2.5
4.1
x=6.1, Σ=0.7
post-upgrade
x=5.4, Σ=0.6
13 12
5.7
7.4
9.
10.6
2.5
x=6.6, Σ=0.8 13 12
13 12
10
10
10
8
8
8
6
6
6
4
4
4
2
2
2
4.1
5.7
7.4
9.
10.6
2.5
x orientation
4.1
5.7
7.4
5.7
7.4
9.
10.6
9.
10.6
x=3.3, Σ=0.6
13 12
2.5
4.1
9.
10.6
2.5
4.1
y orientation
5.7
7.4
z orientation
Figure 4: Histograms for elongation at break (%) by orientation for both builds.
pre-upgrade
x=1812, Σ=111
x=1894, Σ=168 10
10
8
8
8
6
6
6
4
4
4
2
2
2
844 1115 1386 1657 1929 2200
844 1115 1386 1657 1929 2200
844 1115 1386 1657 1929 2200
x=1436, Σ=115
post-upgrade
x=1876, Σ=178
10
x=1459, Σ=214
x=1249, Σ=244
10
10
10
8
8
8
6
6
6
4
4
4
2
2
2
844 1115 1386 1657 1929 2200
844 1115 1386 1657 1929 2200
844 1115 1386 1657 1929 2200
xy plane
yz plane
Figure 5: Flexural modulus (MPa) by orientation plane for both builds.
396
zx plane
pre-upgrade
x=248, Σ=23
x=243, Σ=16 25
25
20
20
20
15
15
15
10
10
10
5
5
5
145
177
209
242
274
306
145
177
x=205, Σ=35
post-upgrade
x=236, Σ=11
25
209
242
274
306
145
x=241, Σ=39 25
25
20
20
20
15
15
15
10
10
10
5
5
5
177
209
242
x orientation
274
306
145
177
209
242
209
242
274
306
274
306
x=188, Σ=20
25
145
177
274
y orientation
306
145
177
209
242
z orientation
Figure 6: Impact resistance (J/m) by orientation for both builds.
As shown in the histograms and in Table 2, flexural modulus declines substantially between these two builds. Again, with the recommended processing parameters, the upgrade alone is not adequate to produce an improvement in flexural modulus.
3.3
Impact resistance
Pre-upgrade impact resistance is not sensitive to orientation, but specimens built in the z orientation after the upgrade have relatively low impact resistance. Histograms for impact resistance are shown in Figure 6. The overall mean impact resistance figures in Table 2 confirm that impact resistance also declined between the two builds. The upgrade does not improve impact resistance when the manufacturer-recommended parameters are used.
3.4
Density
The specimens’ approximate densities were measured by hand using water displacement and a balance. These densities are plotted according to x-y position in the build volume in Figure 7. There is no clear trend in density with position. Density declines slightly between the two builds, but this effect may not be significant compared to the measurement error.
397
×
×
3
×
×
2
×
×
2
×
×
×
×
×
×
y-coordinate (in)
y-coordinate (in)
3
1 0 -1 -2 -3
×
×
×
× -3
-2
0.8
-1 0 1 x-coordinate (in)
0.85
2
0.9
1 0 -1 -2 -3
3
-3
0.95 1 density (g/cc)
-2
1.05
-1 0 1 x-coordinate (in)
1.1
2
3
1.15
Figure 7: Density map (top view) for the pre-upgrade (left) and the post-upgrade (right) builds. The density for all specimens (n = 240) was 0.997 ± 0.048 g/cc (pre-upgrade) and 0.970 ± 0.056 g/cc (post-upgrade) (x¯ ± σ ).
1
Figure 8: Scanning electron micrographs of new DuraForm PA powder (left) and the recycled part cake used for this work (right).
3.5
Microstructure
A sample of the recycled part cake from which the test builds were fabricated was imaged using scanning electron microscopy (SEM) and compared to a micrograph of fresh material. The recycled and new powder have visibly similar texture, particle size and size distribution, as shown in Figure 8. SEM micrographs of tensile-test fracture surfaces of pre- and post-upgrade tensile specimens were used to characterize their microstructure (Figure 9). The surfaces show visibly similar occurrence of voids and cracking. Micrographs of cryogenic fracture surfaces, created by breaking the specimens after chilling them with liquid nitrogen, are also visibly similar (Figure 10). Substantial differences in microstructure between new and recycled SLS powder and between pre-upgrade and post-upgrade fracture surfaces are not apparent.
398
Figure 9: Micrograph of the fracture surfaces for tensile specimens built before (left) and after (right) the upgrade.
Figure 10: Micrograph of cryogenic fracture surfaces of tensile specimens built before (left) and after (right) the upgrade at 500× (top) and 1000× (bottom) magnification.
399
4
Summary and conclusion
When manufacturer-recommended processing parameters were used, all of the mechanical properties measured in this study declined upon the installation of the upgrade. However, these recommended parameters are intended to be a starting point and not a formula for optimal mechanical properties. They are chosen by the manufacturer to match the ASTM specifications for injectionmolded Nylon 12, as a compromise between better material properties and easier breakout [4]. Indeed, both the pre-upgrade and post-upgrade builds exceed the ASTM specifications for general purpose Nylon 12 in those properties that are specified [7]. No substantial changes in microstructure were observed before and after the upgrade, indicating that no qualitative microstructural difference accounts for the decline in mechanical properties. This suggests that mechanical properties could be improved by adjusting machine settings away from the manufacturer’s initial recommendations. Each SLS machine, even of a particular model, performs differently [4]. Specifying the processing parameters that result in the optimal mechanical properties is currently an iterative process. Like the operation of any complex machine, this optimization process involves a great deal of operator knowledge and experience. The HiQ upgrade does not eliminate this process [4]. Parameters that are optimal for a HS system are not optimal for a HiQ+HS system. Dozens of SLS processing parameters are available for adjustment (Table 3) and many are subject to measurement error. The upgrade reduces error in the measurement of temperatures by providing real-time sensor calibration. This eliminates the find temps procedure for experimentally finding the fusion temperature of the part bed and the temperature ramping procedure used to compensate for sensor drift during the build. This makes builds faster to set up and run and is expected to support consistency between builds.
5
Recommendations and future work
Finding the best parameters for a particular SLS machine is still an open-ended, iterative process, even after the upgrade is installed. We recommend that the institutions researching, developing, manufacturing and using SLS machines cooperate to develop and publish a procedure for searching the range of processing parameters and optimizing mechanical properties. Ideally, the procedure would be performed upon the initial installation of a machine and repeated during major maintenance operations, including the installation of the HiQ upgrade. Table 3: Thirty-eight processing parameters are available for user adjustment. Build parameters smart feed enable smart feed gain fast add powder layer left feed distance left feed heater output limit left feed heater set point left feed heater wait for temp minimum layer time part cylinder heater enable
part cylinder heater output limit part cylinder heater set point part heater PID output limit part heater set point part heater wait for temp part heater inner/outer ratio piston heater enable piston heater output limit piston heater set point
pre add powder layer delay post add powder layer delay powder layer thickness right feed distance right feed heater output limit right feed heater set point right feed heater wait for temp roller speed rotate scan order vector bloom elimination
400
Part parameters outline outside contour only up/down fill compensation fill laser power fill scan count outline laser power outline scan count slicer fill spacing sorted fill enabled sorted fill max jump cross fill scan
We also recommend that an improved version of the study, involving the proposed optimization procedure, be performed. The procedure, or a prototype thereof, should be used on a pre-upgrade machine and a batch of test specimens should be manufactured from fresh, unrecycled material using the resulting optimized parameters. The same optimization and specimen build should then be performed on an upgraded machine. This will fairly quantify any benefits of the upgrade and demonstrate the feasibility and efficacy of the optimization procedure. Further testing and the development of at least part of the optimization procedure is planned at this laboratory.
Acknowledgements The authors would like to thank Kevin McAlea, Simon van de Crommert, Kevin Marshall, Art Delgado, Scott Danniel and Jennifer Torkelson of 3D Systems Corporation for providing a HiQ upgrade and subsequent support for the Vanguard HS SLS machine to the Laboratory for Freeform Fabrication. Their continuous support of our SLS research activities at the University of Texas at Austin is greatly appreciated. We would also like to thank Kent Firestone of Solid Concepts for advising us on the SLS build configuration as well as his helpful guidance in our SLS processing.
References [1] T.J. Silverman, A. Hall, B. South, W. Yong, and J.H. Koo. Material properties and microstructural characterization of specimens manufactured by selective laser sintering. SME Technical Paper TP07PUB58, Society of Manufacturing Engineers, Dearborn, Mich., 2007. [2] T.J. Gornet, K.R. Davis, T.L. Starr, and K.M. Mulloy. Characterization of selective laser sintering materials to determine process stability. In Solid Freeform Fabrication Proceedings, pages 546–553, 2002. [3] ASTM International. ASTM D 638-03: Standard Test Methods for Tensile Properties of Plastics. [4] Scott F. Danniel and Jennifer Torkelson of 3D Systems Corp., Rock Hill, S.C. Personal Communication, May 2007. [5] 3D Systems Corporation, Rock Hill, South Carolina (formerly in Valencia, California). Duraform PA and GF Plastic, March 2005. [6] 3D Systems Corporation, Rock Hill, South Carolina (formerly in Valencia, California). Duraform PA Plastic, November 2006. [7] ASTM International. ASTM D 4066a: Standard Classification System for Nylon Injection and Extrusion Materials (PA).
401