Comparison of Model-Based and. Model-Free Approaches for the Analysis of.
Dose-Response Studies. Diplomarbeit vorgelegt von. Björn Bornkamp unter der
...
Comparison of Model-Based and Model-Free Approaches for the Analysis of Dose-Response Studies
Diplomarbeit
vorgelegt von Bj¨ orn Bornkamp
unter der Anleitung von Prof. Dr. Katja Ickstadt und PD Dr. Frank Bretz Dortmund, 30. September 2006
Contents 1 Introduction and Background
1
1.1
Drug Development Process . . . . . . . . . . . . . . . . . . . . . . . . . . . . . .
1
1.2
PhRMA Rolling Dose Project . . . . . . . . . . . . . . . . . . . . . . . . . . . . .
3
1.3
Notation and Statistical Assumptions . . . . . . . . . . . . . . . . . . . . . . . .
4
1.4
Dose-Finding Example . . . . . . . . . . . . . . . . . . . . . . . . . . . . . . . . .
6
1.5
Overview of the Thesis . . . . . . . . . . . . . . . . . . . . . . . . . . . . . . . . .
7
2 Multiple Contrast Tests
9
2.1
Background . . . . . . . . . . . . . . . . . . . . . . . . . . . . . . . . . . . . . . .
2.2
Dunnett Test . . . . . . . . . . . . . . . . . . . . . . . . . . . . . . . . . . . . . . 11
2.3
Model-Based Contrasts
2.4
Model-Free Contrasts
. . . . . . . . . . . . . . . . . . . . . . . . . . . . . . . . 11 . . . . . . . . . . . . . . . . . . . . . . . . . . . . . . . . . 13
3 Model-Based Dose-Response Estimation 3.1
9
16
Commonly used Dose Response Models . . . . . . . . . . . . . . . . . . . . . . . 16 3.1.1
Non-Linear Models . . . . . . . . . . . . . . . . . . . . . . . . . . . . . . . 17
3.1.2
Linear Models
. . . . . . . . . . . . . . . . . . . . . . . . . . . . . . . . . 18
3.2
Combining Multiple Comparisons and Modelling . . . . . . . . . . . . . . . . . . 19
3.3
Model Selection and Model Averaging . . . . . . . . . . . . . . . . . . . . . . . . 19 3.3.1
Contrast Approaches . . . . . . . . . . . . . . . . . . . . . . . . . . . . . . 21
3.3.2
Schwarz Information Criterion . . . . . . . . . . . . . . . . . . . . . . . . 24
4 Model-Free Dose-Response Estimation 4.1
4.2
28
Local Polynomial Regression . . . . . . . . . . . . . . . . . . . . . . . . . . . . . 28 4.1.1
Background . . . . . . . . . . . . . . . . . . . . . . . . . . . . . . . . . . . 30
4.1.2
Weight Function, Type of Bandwidth and Local Degree . . . . . . . . . . 33
4.1.3
Model Choice . . . . . . . . . . . . . . . . . . . . . . . . . . . . . . . . . . 36
4.1.4
Model Choice with Replicated Data . . . . . . . . . . . . . . . . . . . . . 40
Gaussian Process Regression
. . . . . . . . . . . . . . . . . . . . . . . . . . . . . 42
4.2.1
Background . . . . . . . . . . . . . . . . . . . . . . . . . . . . . . . . . . . 43
4.2.2
The Prior Distribution . . . . . . . . . . . . . . . . . . . . . . . . . . . . . 45
4.2.3
Hyperparameters . . . . . . . . . . . . . . . . . . . . . . . . . . . . . . . . 47
4.2.4
Computational Issues . . . . . . . . . . . . . . . . . . . . . . . . . . . . . 54
4.2.5
Issues in Dose-Response Modelling . . . . . . . . . . . . . . . . . . . . . . 55
5 Analysis of the Dose-Finding Example
56
5.1
Dunnett . . . . . . . . . . . . . . . . . . . . . . . . . . . . . . . . . . . . . . . . . 56
5.2
Model-Based Approaches . . . . . . . . . . . . . . . . . . . . . . . . . . . . . . . 56
5.3
Model-Free Approaches . . . . . . . . . . . . . . . . . . . . . . . . . . . . . . . . 60 5.3.1
Local Regression . . . . . . . . . . . . . . . . . . . . . . . . . . . . . . . . 60
5.3.2
Gaussian Process Regression . . . . . . . . . . . . . . . . . . . . . . . . . 61
6 PhRMA Simulation Study
67
6.1
Test Setting . . . . . . . . . . . . . . . . . . . . . . . . . . . . . . . . . . . . . . . 67
6.2
Description of Methods . . . . . . . . . . . . . . . . . . . . . . . . . . . . . . . . 70
6.3
Main Results . . . . . . . . . . . . . . . . . . . . . . . . . . . . . . . . . . . . . . 73 6.3.1
Power . . . . . . . . . . . . . . . . . . . . . . . . . . . . . . . . . . . . . . 73
6.3.2
Dose-Response Estimation . . . . . . . . . . . . . . . . . . . . . . . . . . . 74
6.3.3
Target Dose Estimation . . . . . . . . . . . . . . . . . . . . . . . . . . . . 76
7 Disussion and Conclusions
80
A Additional Material
88
A.1 Derivation of Optimal Contrasts . . . . . . . . . . . . . . . . . . . . . . . . . . . 88 A.2 Weighted Smoothing . . . . . . . . . . . . . . . . . . . . . . . . . . . . . . . . . . 89 A.3 Inverse Gamma Distribution . . . . . . . . . . . . . . . . . . . . . . . . . . . . . . 90 A.4 Beta Distribution and Transformed Beta Distribution . . . . . . . . . . . . . . . 90 A.5 Convergence Plots for MCMC Methods . . . . . . . . . . . . . . . . . . . . . . . 92 B Complete Results of Simulation Study
93
B.1 Tables . . . . . . . . . . . . . . . . . . . . . . . . . . . . . . . . . . . . . . . . . . 93 B.2 Figures
. . . . . . . . . . . . . . . . . . . . . . . . . . . . . . . . . . . . . . . . . 98
C Implementation
100
C.1 SIC in R . . . . . . . . . . . . . . . . . . . . . . . . . . . . . . . . . . . . . . . . . 100 C.2 Source Code . . . . . . . . . . . . . . . . . . . . . . . . . . . . . . . . . . . . . . . 100 C.2.1 Dose-Finding Example . . . . . . . . . . . . . . . . . . . . . . . . . . . . . 101 C.2.2 PhRMA Simulation Study . . . . . . . . . . . . . . . . . . . . . . . . . . . 104
1 INTRODUCTION AND BACKGROUND
1
1
Introduction and Background
A fundamental objective of drug development is to understand the dose-response relationship of a pharmaceutical compound under investigation. The dose-response relationship describes which response—typically measured by a clinical endpoint of interest—can be expected at a certain dose administered. Understanding this relationship well is crucial for two major decisions that have to be made during drug development: (i) Is there an overall effect in the clinical endpoint of interest? (ii) If yes, which dose should be selected for further development? This thesis evaluates and compares new methods for dose-response modelling answering these questions.
1.1
Drug Development Process
For many pharmaceutical compounds the drug development process is similar. In this section the typical development process will be described (see also Table 1.1). The process starts with the discovery of the compound by chemists or biologists. The subsequent activities can then be further subdivided into two parts: preclinical and clinical development (Ting 2006). In preclinical development all drug testing is performed outside the human body: in cells, tissue, organs and animal bodies. In clinical development the experiments are performed within the human body, further subdivided into four phases. The major aim of preclinical development is the demonstration of the desired biological or pharmacological activity and safety of the compound. Can both objectives be established the clinical development starts with Phase I. Here testing is usually performed on a small number of healthy volunteers (usually 8–24 subjects per trial). The major aim of this phase is to gain knowledge about the pharmacokinetics (what does the human body do to the drug) and pharmacodynamics (what does the drug do to the human body) of the compound. Additionally the maximum tolerated dose (MTD) is determined, i.e., the maximum dose that can safely be administered to humans, without showing severe adverse effects. The MTD is an upper bound for the dose-range considered in subsequent phases of clinical development. In Phase II the drug is for the first time tested on around 100 to 200 patients suffering from the targeted disease. Nevertheless the patients are still recruited restrictively so that patients with
2
1 INTRODUCTION AND BACKGROUND
Phase Preclinical
I
II
III IV
Headwords Discovery of Compound Pharmacology Toxicology / Safety Pharmacokinetics Pharmacodynamics Maximum Tolerated Dose Evidence of treatment effect Dose-response relationship Target dose Large scale confirmatory trial Non-inferiority with competitor Post-marketing Long term data Commercially oriented
Subjects Outside human body (cells, organs, animal bodies) Volunteers
(selected) Patients
Patients Patients
Table 1.1: Overview of the drug development process too mild or too severe conditions of the disease, or additional diseases are excluded. There are usually three crucial questions in Phase II studies:
(a) Is there any evidence of a treatment effect? (b) What is the nature of the dose-response relationship? (c) What is the optimal dose?
To answer these questions a set of 2–4 active doses, within the dose-range established in Phase I, is administered and compared with placebo. A treatment effect can then be established if any of the active doses exhibits a better effect than placebo. Then usually one dose (sometimes two) is selected for further development in Phase III. Phase III trials are confirmatory, that means the primary objective is the comparison of the new compound either with a possible competitor drug or placebo. The objective is thus to show either non-inferiority to the competitor drug or superiority to placebo. Typically two extensive pivotal studies are started and a large number of patients (ranging from hundreds to thousands) needs to be recruited for each. Hence a Phase III trial is a challenge for the sponsor, both from the financial aspect and the time aspect. Therefore planning Phase III trials should be done with considerable care, requiring a good knowledge about the dose-response relationship gathered in earlier phases of drug development. A major role in this planning is played by Phase II
1 INTRODUCTION AND BACKGROUND
3
trials: especially questions (a)-(c) of the Phase II trial objectives have to be answered carefully. If question (a) is not answered positive the development would typically not be continued to Phase III. If there is not a sufficient chance that a drug is effective, no extensive Phase III trial should be started. Another important decision is, which dose level(s) should be chosen for further development. Selecting a too high dose might results in potential adverse events and safety problems, while selecting a too low dose can result in problems of showing efficacy in Phase III. This decision requires a good knowledge about the dose-response shape, so questions (b) and (c) need to be answered well. Hence successfully planning Phase III trials crucially depends on the quality of the Phase II trial. When a Phase III trial is completed and there is sufficient evidence to demonstrate that the new compound is efficacious and safe, the drug (with all related information gathered in the phases of drug development) is submitted to the health authorities. It should be noted that only a very small fraction of the compounds discovered by the chemists or biologists are finally released on the market. Currently only 8% of the compounds reaching Phase I are released on the market and even 50% of the Phase III trials fail (Rovin 2005). Phase IV studies are performed after the drug has already been released on the market and are primarily commercially oriented. The aims of these experiments are often to show in a much more general population that the drug is safe. Other important objectives are to show that the new compound has superior effectiveness compared to competitor drugs or can be preferred because of a better cost-benefit ratio. The results of these type of studies are often used for a better marketing of the new drug (Ting 2006).
1.2
PhRMA Rolling Dose Project
Naturally an influential role during the whole process of drug development is played by the health authorities which review drug development, and ensure that clinical trials are conducted according to good scientific practice. They finally decide whether a drug can be approved or not. The Food and Drug Administration (FDA), the health authority of the United States, is particularly influential. In 2004 the FDA started the so called ‘Critical Path Initiative’. The FDA reports in this initiative that in recent years an almost dramatic trend in pharmaceutical development could be witnessed: the number of drugs submitted to the health authorities sank despite increased investments in pharmaceutical development and despite revolutionary progress
1 INTRODUCTION AND BACKGROUND
4
in biomedical research. For example the number of failed Phase III trials increased from 20% to 50 % in the last 10 years (Rovin 2005). One of several conclusions emphasized by the FDA is the need for new statistical techniques for design and analysis of clinical trials. The pharmaceutical industry reacted on this initiative with the foundation of several working groups within the Pharmaceutical Research and Manufacturers of America (PhRMA). This is an association of the pharmaceutical companies in the United States. One of these working groups, the Rolling Dose Project, explicitly concentrates on dose-response analysis, mainly because of its central role in the clinical development program. As the name indicates methods with dynamic dose allocation are part of the project, but also more traditional methods, where the allocation of patients to the dose groups is done before the trial starts. In this thesis the focus will be on the more traditional methods, although all methods described can potentially be made adaptive. Within the Rolling Dose Project a realistic simulation scenario has been set up to evaluate various new methods and their statistical properties. To enhance the possibility of comparing the methods described in this thesis, with the methods investigated by the Rolling Dose Project, the same simulation setup will be used.
1.3
Notation and Statistical Assumptions
In this section the statistical assumptions made in this thesis will be described. The layout of a parallel group study with k treatment arms is considered, where k − 1 active doses and placebo are administered. This is a standard design for Phase II dose-response studies. It is assumed that the number of active doses is larger than 2 and smaller than 9, the main focus will be on 4 active doses. For simplicity I will focus on the case that we have one clinical endpoint that measures efficacy. The endpoint is assumed to follow a normal distribution with equal variance in all treatment groups. Throughout this thesis the discussion will focus on the mean response at the different doses. It is assumed that the mean can be represented by a continuous and smooth function µ(.). The data model for the efficacy endpoint (denoted with Yij ) is hence given by ind
Yij = µ(di ) + ǫij , ǫij ∼ N (0, σ 2 ), i = 1, . . . , k, j = 1, . . . , ni ,
(1.1)
where di is the dose administered and d1 is placebo (i.e., d1 = 0). The sample size in group P i is ni and the overall sample size is N := ki=1 ni . If the function µ(.) is assumed to have a certain parametric form this parametrization is called dose-response model. One example for a
1 INTRODUCTION AND BACKGROUND
5
dose-response model would be the simple linear model with intercept and slope parameter. The term model refers in this case not to the probability distribution generating the data, but to the parametrization of the mean response function µ(.). For the probability distribution generating the data the word data model will be used. Prior knowledge of the shape of the dose-response function µ(.) is usually sparse: Sometimes data from preclinical testing and Phase I studies can be used as a guide (Ting 2006). But more often the situation of vague prior information is encountered: typically it can be assumed that the dose-response function is monotone increasing or unimodal. But before trial start one is usually not able to specify one parametric dose-response model that will be adequate. This is a problem as all statistical inference has to be written in a trial protocol before collecting the data. One solution is to choose a candidate set of different dose-response models. After collection of the data one could then choose an adequate dose-response model (or a combination of models) from the candidate set according to a pre-specified criterion. This is typically a better behaved strategy than a non-data based selection of one model. Formally, however, any subsequent inference would be conditional on the chosen model (and the candidate model set), what is not always recognized in practice. A different strategy to solve this problem would be to assume that µ(.) can locally be approximated by a certain dose-response model or to specify one doseresponse model and allow for departures from this model. These techniques do not assume a specific dose-response model and can be called model-free, as the dependence on a global model or a candidate set of models is removed. Therefore these approaches are typically more flexible and one might expect that this results in a higher variability of the dose-response estimate as the shape of dose-response function also has to be ‘learned’ from the data. The main tasks to be considered in this thesis coincide with the major aims of dose-response trials described above. That means: establishment of a treatment effect, estimation of the doseresponse relationship and estimation of the target dose. In reality different concepts of target doses exist; and in fact different target doses might be adequate in different situations. In this thesis I will restrict the discussion to the following definition of the target dose (assuming that a higher response means a benefit) d∗ = min(d ∈ (d1 , dk ]|µ(d) ≥ µ(d1 ) + ∆).
(1.2)
That is, we try to estimate the smallest dose that achieves an improvement of ∆ compared to placebo. The parameter ∆ is called clinical relevance threshold. The minimum is used since
6
1 INTRODUCTION AND BACKGROUND
Dose placebo 0.05 0.2 0.6 1
Patients 71 78 75 72 73
Table 1.2: Number of patients in the five treatment arms we then obtain a lower bound for all doses that might be used in Phase III. It has to be noted that it can happen that d∗ does not exist in the dose range, i.e., no d ∈ (d1 , dk ] satisfies the condition µ(d) ≥ µ(d1 ) + ∆.
1.4
Dose-Finding Example
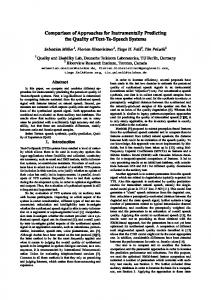
To illustrate the methods described in this thesis a real data set taken from Biesheuvel and Hothorn (2002) will be used. These data are part of a randomized double-blind placebo controlled 12 weeks dose ranging trial on a compound for the treatment of the irritable bowel syndrome (IBS). IBS is a disorder that constrains the normal functions of the colon. It is characterized by crampy abdominal pain, diarrhea and constipation. It is a functional disorder, which means that the primary abnormality is an altered physiological function and there is no identifiable structural or biochemical cause. The trial was designed to show efficacy of four active treatment arms versus placebo. The active doses administered in the trial were 0.05, 0.2, 0.6 and 1. Table 1.2 summarizes the group sample sizes for the five treatment arms, at the end of the study. The efficacy endpoint used for the treatment of IBS was the improvement in abdominal pain assessed by the patients on a pain scale. Higher values of the endpoint correspond to an improvement in the pain scale. The endpoint is assumed to follow a normal distribution. The clinical relevance threshold ∆ was set to 0.25, i.e., a response is assumed to be clinically relevant better if it is 0.25 larger than the placebo response. Figure 1.1 gives a graphical impression of the data. Two features of the data set are typical for dose-response data: the dose design is sparse and the sampling variance is relatively large. The relevant questions for this data set are:
• Is there a dose-response effect, i.e., does any active dose exhibit a better effect than the placebo response?
7
1 −1
0
Response
2
3
1 INTRODUCTION AND BACKGROUND
0.0
0.2
0.4
0.6
0.8
1.0
Dose
Figure 1.1: Graphical illustration of the IBS data set, group means (•) and observations (◦)
• What is the dose-response relationship? • Which is the smallest dose having a clinically relevant response? I will come back later to this example and try to answer these questions using the methods to be described in this thesis.
1.5
Overview of the Thesis
In Section 2 multiple comparison procedures based on contrast tests are introduced. These methods are currently the standard procedures for the analysis of dose-response studies. In Section 3 a recent method to combine multiple comparison and regression procedures is introduced (Bretz, Pinheiro and Branson 2005). The emphasis in this section is model-based dose-response estimation, where one or several dose-response model(s) are assumed for µ(.) and only the associated model parameters have to be estimated. In this section, an established method for model selection and model averaging will be described, see Schwarz (1978) and Buckland, Burnham and Augustin (1997). Additionally, for both purposes a method based on contrasts is introduced.
1 INTRODUCTION AND BACKGROUND
8
The approach to select a candidate set of models and then choosing a ‘best’ model or averaging over them already provides a relatively flexible approach to dose-response estimation. An important question is whether this is already sufficient or if one should allow for even more flexibility. In Section 4.1 and 4.2 flexible regression techniques will be introduced that do not assume a dose-response model and might hence be called model-free regression techniques. Local polynomial regression (Section 4.1) is a widely known nonparametric regression technique (Loader 1999) and is introduced with special reference to dose-response studies. In Section 4.2 Gaussian Process Regression, a Bayesian nonparametric regression technique is described (O’Hagan and Forster 2004, pp. 393–397). A main issue in this section will also be the adaption of the method to the dose-response context. In Section 5 all techniques described in this thesis will be illustrated with the IBS dose-finding example. Naturally these methods will lead to similar but not identical conclusions. The results will be used to give further insight into the underlying assumptions of the methods and their adequacy in the dose-response context. In Section 6 the simulation scenario used by the PhRMA working group on rolling dose studies will be described and applied to the methods described in this thesis. Then the main results will be summarized. In Section 7 I will further discuss and evaluate the methods and their results from Section 5 and 6. Finally I will draw conclusions regarding the adequacy of the methods in the dose-response context and give an outlook. Throughout the thesis, longer technical arguments or supplementary tables and illustrations are shown in the Appendices A and B. Source code for the analysis of the IBS example data set and the simulation study can be found in Appendix C.
9
2 MULTIPLE CONTRAST TESTS
2
Multiple Contrast Tests
One major aspect of dose-finding studies is the assessment of the dose-response effect. Usually one is interested whether the dose-response curve is a constant or if any dose has an effect ‘better’ than the placebo effect. One possibility investigate this question are contrast tests. A vector c is called a contrast, if c′ 1 = 0, where 1 denotes the vector with all entries equal to 1. ˜ ∀d ∈ [d1 , dk ], the product c′ µ will be So if the dose-response shape is constant, i.e., µ(d) = k,
˜ Hence it can be expected that the product of a contrast zero, as µ = (µ(d1 ), . . . , µ(dk ))′ = k1.
with the vector of group means will result in values close to zero, if the dose-response shape is constant. A dose-response effect could be established if the result of this multiplication is sufficiently different from zero. This is the basic idea of contrast tests. In the Section 2.1 I will introduce contrast tests and the distribution theory for multiple contrast tests more formally. In Section 2.2 the Dunnett test is introduced. This is a multiple contrast test, which is currently the standard approach to dose-finding studies. In Section 2.3 contrasts that are specifically designed to detect certain dose-response models are described, while in Section 2.4 the focus will be on model-free contrasts that are not based on specific model functions.
2.1
Background
¯ = (Y¯1. , . . . , Y¯k. )′ denote the vector containFirst single contrast tests will be introduced. Let Y ing the mean responses Y¯i. for treatment i = 1, . . . , k. Let c = (c1 , . . . , ck )′ ∈ Rk denote a con-
trast vector with fixed and known values ci , i = 1, . . . , k. Let further µ = (µ(d1 ), ..., µ(dk ))′ = ¯ denote the vector of true group means. E(Y) Usually one is interested in testing: H0 : c′ µ = 0 versus H1 : c′ µ > 0. The alternative is chosen one-sided, as normally one is only interested in beneficial deviations from H0 ,i.e., only in one direction. To test the null hypothesis H0 a usual t-test type contrast statistic, of the form ‘estimator divided by standard error of the estimator’ is used, T = S where S 2 =
Pk
i=1
Pnk
j=1 (Yij
¯ c′ Y qP k
,
2 i=1 ci /ni
P − Y¯i. )2 /(N − k) denotes the variance estimate and N = ki=1 ni
denotes the total sample size. Under the assumption (1.1) the contrast test statistic T follows under the null hypothesis H0 a central t-distribution with N − k degrees of freedom. If H0 is
10
2 MULTIPLE CONTRAST TESTS
not true T follows a non-central t-distribution with non-centrality parameter c′ µ τ = qP . k 2 σ i=1 ci /ni In the following multiple contrast tests will be considered. That is, one has M contrasts cm , m = 1, . . . , M , and one is interested in testing each of the hypotheses H0m : c′m µ = 0 versus H1m : c′m µ > 0, m = 1, . . . , M, while controlling the family wise error rate (FWER) at a level α. The FWER is the probability that any true null hypothesis is falsely rejected, see Hochberg and Tamhane (1987) for details. One common decision rule is to combine the individual contrast tests using the maximum of the M test statistics T max :=
max
m∈{1,...,M }
Tm =
Tm , where
¯ c′ Y qP m , k 2 S i=1 cmi /ni
m = 1, ..., M.
Let q1−α denote the 1−α quantile of the distribution of T max under H = ∩m H0m . If T max > q1−α , a dose response signal can be established at level α. Furthermore, all contrasts with a test statistic larger than q1−α can be declared statistically significant controlling the FWER at level α. The distribution of T max can be derived by the following considerations: under H = ∩m H0m ,
the M-variate random vector T = (T1 , ..., TM )′ follows a multivariate t distribution with N − k
degrees of freedom, non-centrality vector 0 and correlation matrix R = (ρij ) depending only on the contrasts and group sample sizes, Pk
l=1 cil cjl /nl , Pk 2 2 /n c /n c l l l=1 jl l=1 il
ρij = qP k
(2.1)
see for example Bretz, Genz and Hothorn (2001). To calculate the critical value q1−α and multiplicity adjusted p-values one needs to know the distribution of T max . Following standard arguments the distribution function is given by FT max (x) = P (T max < x) = P (T1 < x, . . . , TM < x), x ∈ R.
(2.2)
The right hand side of (2.2) is now the distribution function of T = (T1 , . . . , TM )′ evaluated at the vector x1 ∈ RM . Since T follows a multivariate t distribution, numerical integration as implemented in the mvtnorm package in R by Genz, Bretz and Hothorn (2005) can be used, for details on mvtnorm see also Hothorn, Bretz and Genz (2001).
11
2 MULTIPLE CONTRAST TESTS
2.2
Dunnett Test
The Dunnett test, introduced by Dunnett (1955), is probably the most commonly used method in the dose-finding context. The central idea of the procedure is to use pairwise comparisons between the active doses and the control. This is intuitive as one is usually only interested, whether any of the active doses has a response larger than the placebo response. In this case the associated hypotheses are: H01 : µ(d2 ) = µ(d1 )
vs .. .
H11 : µ(d2 ) > µ(d1 )
H0k−1 : µ(dk ) = µ(d1 )
vs
H1k−1 : µ(dk ) > µ(d1 ).
Thus the contrasts are chosen as: c1 = (−1, 1, 0, . . . , 0)′ c2 = (−1, 0, 1, . . . , 0)′ .. . ck−1 = (−1, 0, . . . , 0, 1)′ . With these contrasts a maximum contrast test as described in Section 2.1 is performed. If the maximum contrast is larger than the associated critical value an overall dose-response signal can be established. Furthermore all doses having contrast test statistics larger than the critical value can be regarded as significantly different from placebo, while controlling the FWER at level α.
2.3
Model-Based Contrasts
Due to the pairwise testing nature, the Dunnett test can lead to power losses compared to contrast tests, which take prior knowledge on the dose response profile into account. In this section I will describe how to choose contrasts that are optimal to detect certain dose-response shapes (see also Bretz et al. (2005)). Suppose a model Mm is the true model with mean vector µm = (µm (d1 , θ m ), . . . , µm (dk , θ m ))′ , where µm (.) is the model function for model Mm and θ m the vector of its model parameters. (see Section 3.1 for some commonly used dose-response models). The task is now to choose the
12
2 MULTIPLE CONTRAST TESTS
contrast, such that the power of rejecting the null hypothesis of a flat dose-response model is maximized. This can be achieved by choosing the contrast vector cm such that it maximizes the non-centrality parameter τ of the associated contrast �� q test statistic � under the alternative that P k 2 Mm is the true model. Thus τ (c, µm ) = c′ µm σ or equivalently g(c, µm ) := i=1 ci /ni στ (c, µm ) have to be maximized. The maximization of g(c, µm ) directly is not possible, because
the parameter vector θ m is unknown. Thus, prior information about the possible dose-response shape for model Mm and ‘guesstimates’ for the parameter vector θ m need to be specified. Bretz et al. (2005) describe a strategy to—at least partially—overcome the problem of the unknown model parameters. For the most common dose response models and all dose-response models used in this thesis, the model function can be formulated as µm (., θ m ) = θ0 + θ1 µ0m (., θ 0m ).
(2.3)
The function µ0m (.) is called standardized model function and only depends on θ 0m the so called shape parameter(s). Normally the number of shape parameters is smaller than the full number of parameters and the set of shape parameters is a subset of the set of all parameters. For most of the commonly used model functions there are one or two shape parameters. The optimization of g(c, µm ) is equivalent to the optimization of g(c, µ0m ), where µ0m = (µ0m (d1 , θ 0m ), . . . , µ0m (dk , θ 0m ))′ . Thus the location and scale parameters θ0 and θ1 in (2.3) do not need to be specified. This is intuitively clear, since θ0 and θ1 just determine the location on the y-axis and the scaling of the model function but not its shape. More formally this can be seen by the following argument: µm = θ0 1 + θ1 µ0m =⇒ c′ µm = θ1 c′ µ0m =⇒ g(c, µm ) = θ12 g(c, µ0m ). Therefore the optimization of g(c, µm ) with respect to c is independent of θ0 and θ1 . The shape parameters θ 0 have to be determined by prior knowledge. See Pinheiro, Bretz and Branson (2006) for a possibility to derive guesstimates for the shape parameters based on the expected percentage of the maximum effect reached at a certain dose. Once the standardized mean vector µ0m has been obtained the objective function g(c, µ0m ) needs to be maximized with respect to c. A closed form solution for this maximization is given by the following formula (see the appendix A.1 for a derivation based on Lagrange multipliers)
c∗m = λ
n1 (µ0m,1 − µ ¯) 0 n2 (µm,2 − µ ¯) .. . ¯) nk (µ0m,k − µ
, λ ∈ R+ \ {0},
(2.4)
13
2 MULTIPLE CONTRAST TESTS
where µ ¯ = N −1
Pk
0 i=1 µm,i ni ,
where µ0m,i = µ0m (di , θ 0m ). This solution is not unique as it can be
multiplied with the scalar λ > 0 while the value of g(c, µ0m ) remains unaltered. Similarly the value of the contrast test statistic Tm does not depend on λ. Nevertheless for a standardized reporting the solution can be made unique, by imposing the constraint of unit euclidean length, kck = 1. Using this, one obtains
∗ ∗ c∗∗ m = cm /kcm k.
Once the optimal contrast has been obtained for each shape, the test statistics Tm for m = 1, ..., M can be calculated and the maximum contrast test, described in Section 2.1, can be applied. If the maximum contrast test statistic is larger than the associated critical value a doseresponse effect can be established. Additionally, all contrasts (and by this the associated doseresponse models) with test statistics larger than the critical value can be declared statistically significant. Model-based contrasts have the side effect of an implicit model choice, as a set of significant models is obtained. In Section 3.2 this idea is further elaborated with a view towards model selection. Note that the contrasts are, for each model, optimized to detect a certain shape determined by the shape parameter. This raises the question on the sensitivity of the procedure measured as loss in power with respect to incorrectly guessing the shape parameter. A general answer is not possible, because this always depends on the other contrasts included in the candidate set and its correlation. But often for a reasonably chosen model set the model shapes are captured by other contrasts in the candidate set and the resulting power loss is relatively small. See Pinheiro, Bornkamp and Bretz (2006) for a more detailed discussion of these aspects and a possibility to assess the loss in power given a certain candidate model set.
2.4
Model-Free Contrasts
Despite their advantages, there is one drawback of model-based contrasts. They require very specific prior knowledge: a set of candidate models, and a set of guesstimates for the shape parameters have to be selected. Instead of choosing model functions and then related guesstimates, the shapes could also be selected directly. As described above the optimal contrasts do not depend on location and scale of the model function. Thus in principle one could even draw a dose-response curve, which represents the prior knowledge, and then use for example linear interpolation to get the shape. The corresponding optimal contrast could then be calculated
14
2 MULTIPLE CONTRAST TESTS
0.0
(i) concave
0.2
0.4
0.6
(ii) convex
0.8
1.0
(iii) sigmoid 1.0
Percentage of Maximum Effect
0.8 0.6 0.4 0.2 0.0
(iv) linear
(v) umbrella
1.0 0.8 0.6 0.4 0.2 0.0 0.0
0.2
0.4
0.6
0.8
1.0
Dose
Figure 2.1: Model free contrasts, scaled and shifted to have a maximum effect of 1 and a placebo response of 0.
using formula (2.4). In the following I will describe a simpler strategy to define model-free contrasts, similar to Stewart and Ruberg (2000). Special emphasis is laid on contrasts that represent the prior knowledge at the design stage of a dose-response study. Usually one would expect monotone or unimodal shapes. To cover all possible monotone shapes, one concave shape, one convex shape and a sigmoid shape could be used. The corresponding models can be constructed by linear interpolation of a small number of points. See Figure 2.1 (i)(iii) for an illustration, where the points 0, 1/3, 2/3, 1 were used on the x-axis and 0 and 1 on the y-axis. It has to be noted that none of these shapes are convex or concave in the mathematical sense, but the resulting contrasts are intended to capture these type of shapes; hence I will use these names for the contrasts. For completeness, a linear increasing shape is added (Figure 2.1 (iv)). To capture a possible downturn of the effect an umbrella shape should also be used. This can be constructed by specifying a dose, where the maximum effect occurs and the percentage of the maximum effect that is reached at the largest dose. Then a linear increasing line from 0 to the maximum effect and a linear decreasing line to the specified percentage at the largest dose is drawn to obtain the shape. See also Figure 2.1 (v) as an example, here the maximum
2 MULTIPLE CONTRAST TESTS
15
effect is supposed to occur at 2/3 and the percentage of the maximum effect at the largest dose is set to 0.5. Having obtained these shapes formula (2.4) can be used to calculate the optimal contrasts. Although the construction of these contrasts seems somewhat arbitrary, it can be expected that the contrasts will work reasonable, as the power of the multiple contrast test is usually relatively robust to smaller deviations from the true underlying dose-response shape.
3 MODEL-BASED DOSE-RESPONSE ESTIMATION
3
16
Model-Based Dose-Response Estimation
Normally the prior knowledge about the dose-response shape is not sufficient to suggest one specific dose-response model. As described in the introduction a possible solution is to select a set of candidate models. Some commonly used dose-response models are introduced in Section 3.1. Having selected a candidate set and once the data are collected one would typically want to assess, whether there is a dose-response effect. In Section 3.2 I will connect modelling techniques with the theory described on contrast tests in the last section. In Section 3.3 model selection and model averaging techniques will be introduced.
3.1
Commonly used Dose Response Models
Traditional dose-response models are usually non-linear and often motivated by direct considerations on drug-receptor interactions (MacDougall 2006). This results in model functions with parameters that have specific interpretations in the dose-response context. Another class of models are linear and non-linear models that are not motivated by such biological or pharmacological considerations. Still some of them show good empirical performance for dose-response modelling. One fact makes linear models a particularly convenient choice: despite their advantages non-linear models suffer from the fact that maximum likelihood estimation of their parameters requires iterative optimization techniques, see, for example, Bates and Chambers (1992). These optimization routines sometimes fail to converge, especially if the number of parameters in the models is nearly as large as the number of distinct doses. If a non-linear model has been included in the candidate set and the optimization routine does not converge, the model usually has to be excluded from the candidate set of models a-posteriori. This is a very undesirable effect as the selection of the candidate set is done to cover all possible shapes. For linear models this problem does not exist as the maximum likelihood estimates can be found analytically. So linear models have an appeal from a practical point of view. Some important non-linear and linear dose response models will be introduced in the following; for more doseresponse models see for example Pinheiro, Bretz and Branson (2006). In Figure 3.1 example shapes of some of the models are given. For the derivation of the optimal contrasts as described in Section 2.3, the standardized model function is needed. Table 3.1 gives the standardized model functions of the models described in this section.
17
3 MODEL-BASED DOSE-RESPONSE ESTIMATION
(iii) sigmoid emax model
Response
(ii) linear model
Response
Response
(i) emax model
(iv) exponential model
(v) quadratic model
(vi) logistic model
Response
Dose
Response
Dose
Response
Dose
Dose
Dose
Dose
Figure 3.1: Example shapes of common dose-response models
3.1.1
Non-Linear Models
Sigmoid Emax Model The sigmoid Emax model is one of the most common dose-response models (see also Figure 3.1 (i) and (iii)). It is defined as µ(d, θ) = θ0 + θ1 dθ3 /(dθ3 + θ2 θ3 ). Here, θ0 denotes the baseline effect, θ1 is the maximum change from the placebo response associated with a high dose, and θ2 denotes the dose that gives half of the maximum change. The parameter θ3 is the so called Hill factor. It determines the steepness of the dose-response curve. The Hill factor is often not estimated but set to 1. The model that results of setting θ3 = 1 is usually called Emax model. For more details on the sigmoid Emax model see MacDougall (2006). Logistic Model The four parameter logistic model is another standard dose-response model, see also Figure 3.1 (vi). It is defined as µ(d, θ) = θ0 + θ1
��
1 + exp
�
θ2 − d θ3
��
.
The term θ0 + θ1 /(1 + exp( θθ32 )) corresponds to the placebo effect, θ1 gives the maximum change
3 MODEL-BASED DOSE-RESPONSE ESTIMATION
Model Sigmoid Emax Exponential Logistic Linear (l > 1)
18
µ0 (d, θ 0 ) dθ3 /(dθ3 + θ2θ3 ) exp(d/θ2 ) 1/(1 + exp( θ2θ−d )) 3 0 θ1 f1 (d) + . . . + θl0 fl (d)
Table 3.1: Standardized model functions from placebo for a high dose, θ2 is the dose giving half of the maximum effect, and θ3 is a parameter controlling the rate of change between dose and the response. Like the sigmoid Emax model, the logistic model is a very flexible model covering a broad shape space. Note that MacDougall (2006) shows the equivalence of the logistic model and sigmoid Emax model, for a certain parameter configuration. Exponential Model The exponential model is defined as µ(d, θ) = θ0 + θ1 exp(d/θ2 ). Here, θ0 + θ1 denotes the placebo response, θ1 is a scale parameter, and θ2 determines the convexity of the curve. Large values for θ2 result in an almost linear function, while smaller values result in more convex fits. The exponential model is usually included in the set of candidate models if a convex dose response shape is possible (Figure 3.1 (iv)).
3.1.2
Linear Models
Linear models are defined as finite linear combinations of fixed and known basis functions fi (d): µ(d, θ) = θ0 + θ1 µ0 (d, θ 0 ), where µ0 (d, θ 0 ) = θ10 f1 (d) + . . . + θl0 fl (d). Often used basis functions are for example: the identity fi (d) = d, the logarithm fi (d) = log(d + 1) and natural powers of d: d2 , d3 , . . . . The parameters θ0 and θ1 determine location and scale of the model function. The shape parameters θ10 , θ20 , . . . , θl0 weight the different basis functions and by this determine the shape. If there is just one basis function, the parameter θ10 is not necessary. In this case no guesstimate needs to be determined to obtain the optimal contrast. Typical examples for linear models are the dose-response model with just a linear dose term (Figure 3.1 (ii), subsequently called the linear model) or the model with a linear and a quadratic dose term (Figure 3.1 (v), subsequently called quadratic model). The difference to
3 MODEL-BASED DOSE-RESPONSE ESTIMATION
19
the common non-linear models consists of the fact that there is usually more than one basis function and the basis functions are assumed to be known.
3.2
Combining Multiple Comparisons and Modelling
In this section I will describe a methodology, introduced by Bretz et al. (2005), that combines the contrast test methodology with regression approaches. This method gives the process of dose-response modelling with a set of candidate models a formal structure. An overview of the methodology is given in Figure 3.2. After selection of a candidate set M = {M1 , . . . , MM }
of dose-response models and associated shape parameters θ 0m , m = 1, . . . , M , the optimal contrasts can be obtained for all shapes, and a maximum contrast test as described in Section 2.3 can be employed. Each of the models in the candidate set corresponds to a contrast test
statistic Tm . Is the maximum contrast test statistic larger than the associated critical value q1−α , an overall dose-response effect can be established. Furthermore all models corresponding to contrast test statistics with values larger than q1−α can be declared significant controlling the FWER at level α. Hence, a set M∗ of significant models is obtained. These models will
∗ }. So the multiple contrast test is directly used for model be numbered M∗ = {M1∗ , . . . , MM ∗
selection. In case there is more than one model significant the task is to choose a model out of M∗ for subsequent inference (i.e., dose-response estimation and target dose estimation). Bretz et al. (2005) suggest to select one model for subsequent inference either by a standard model selection criterion or the model corresponding to the maximum contrast test statistic. A different strategy is to use all models from the set of significant models and average over them. In the next section I will introduce methods for model selection and model averaging.
3.3
Model Selection and Model Averaging
Model selection determines one model out of the candidate set that seems best suited. This approach has one major drawback: if there are various models explaining the data almost equally well, the selection of one model is somewhat arbitrary, and possibly determined by the random variation in the data. Additionally, the typical approach after the selection of one model is to treat this one model as if it would be the true model, although formally all subsequent inference is conditional on this chosen model. This certainly understates the variability and uncertainty involved, as typically the subsequent inferences might be quite different for each of
20
3 MODEL-BASED DOSE-RESPONSE ESTIMATION
Set of candidate models M ?
?
Optimum contrast coefficients ?
?
Set of significant models
M∗ ,
obtained controlling F W ER
?
?
Model selection or averaging of models in M∗ ?
?
Dose-response and target dose estimation
Figure 3.2: Schematic overview of the multiple comparison and modelling procedure the different models. One way out is to incorporate this uncertainty into statistical inference, for example by averaging inferences over the models (Buckland et al. 1997). For this purpose model probabilities wm , m = 1, . . . , M ∗ for the different models in M∗ have to be obtained. The model-averaged dose-response estimate would then be ∗
µ ˆ(d) =
M X
ˆ m ), wm µm (d, θ
m=1
ˆ m ) denotes the estimated dose-response function under model Mm . The modelwhere µm (., θ averaged target dose estimate would be ∗
dˆ∗ =
M X
(m) wm dˆ∗ ,
m=1 (m) ∗ . In this section two possibilities to where dˆ∗ is the target dose estimate using model Mm
calculate model weights wm will be presented. Model selection and especially model averaging have been a major research area in recent years. Various solutions exist from the machine learning, classical statistics and Bayesian statistics perspective. It is beyond the scope of this thesis to provide a review of these methods. Instead I will concentrate on two methods that share the appeal of being computationally cheap: one method is particular suited for the situation of dose-response data and based on contrasts. It will be introduced in Section 3.3.1. The second method is the Schwarz Information Criterion (SIC). The SIC seems to have an appeal from the classical and the Bayesian perspective and will be introduced in Section 3.3.2.
3 MODEL-BASED DOSE-RESPONSE ESTIMATION
21
Note that here non-nested dose-response models are compared, so the information criterion of Akaike (AIC) seems inappropriate in this application as it assumes that the different models are nested, see deLeeuw (1992, p. 603) for the assumption in the original derivation of the AIC or Ripley (2004). It is notable that in a larger part of statistical literature the AIC is used to compare non-nested models despite the arguments against it. Because of this discussion, the AIC is not considered further in this thesis.
3.3.1
Contrast Approaches
When using model-based contrast tests as in Section 3.3, the correspondence between contrasts and dose-response models is exploited to obtain the set M∗ of significant models. In this section this correspondence is further elaborated to obtain one model or a combination of models for further inference. The problem of model selection and averaging is transferred to selecting and averaging the corresponding contrasts, so formally the word contrast selection and contrast averaging might be more adequate in this section. As described in Section 2.3 the model-based contrasts are chosen such that they optimize the non-centrality parameter of the contrast test statistic for a certain alternative (i.e., shape). Now, if the true dose-response shape coincides with the shape, for which the contrast has been optimized, the corresponding univariate contrast test is by construction the most powerful contrast test to detect this shape. Hence this contrast test statistic is typically larger than all other contrast test statistics (with contrasts different from the optimal contrast). Therefore the information about which model has the maximum contrast test statistic contains information about the appropriateness of the corresponding model shape. This provides the motivation to use contrast test statistics as a model selection criterion. For the model selection step one would select the model with the largest contrast test statistic. How to use contrasts for model averaging seems less obvious. One approach to derive model probabilities is to use the probability that a certain contrast has the largest contrast test statistic. The derivation of this probability can be facilitated in a parametric bootstrap approach. Under the normality assumption the plug-in estimate of the data generating distribution for the response at a dose di , i ∈ {1, . . . , k} is N (¯ yi. , s2 ), for details on the plug in principle and parametric bootstrap see Chapter 4 and 6.5 of Efron and Tibshirani (1993). Following the bootstrap methodology a large number of new data sets Y ∗ with the same group sample sizes would be
3 MODEL-BASED DOSE-RESPONSE ESTIMATION
22
(independently) resampled from these plug-in estimates of the distributions. In each resample the contrast test statistics would be recalculated. The bootstrap estimate of the probability that a certain model Mm has the highest test statistic would then simply be the fraction of resamples in which model Mm had the highest test statistic. These probabilities could then be used, to weight subsequent inference. On first sight this approach seems computationally demanding, but fortunately there exists a way to avoid resampling. In the next lines a strategy to calculate the bootstrap model weights with numerical integration will be described. All contrast test statistics share the same estimator of the sampling standard deviation in the denominator. Hence dropping this term in the denominator does not affect the ordering of contrast test statistics with respect to their magnitude and it is sufficient to consider ¯∗ c′ Y qP m , k 2 i=1 cmi /ni
(3.1)
¯ ∗ denotes the (random) vector of group means under the bootstrap distribution. Since where Y qP qP k k 2 2 ˜ i=1 cmi /ni is a scalar, one can define cm = cm / i=1 cmi /ni and the expression (3.1) ¯ ∗. ˜′m Y reduces to c
¯ ∗ is normal with the observed mean vector y The bootstrap distribution of Y ¯ as mean and covariance matrix s2 S, where S = diag(1/n1 , . . . , 1/nk ). Hence the bootstrap distribution of P ¯ ∗ is normal with expectation c ˜′m Y ˜′m y c ¯ and variance s2 ki=1 c˜2mi /ni . A similar results holds qP k 2 if several contrasts c1 , . . . , cM ∗ are investigated. Dividing each by i=1 cmi /ni for m = 1, . . . , M ∗ and writing them in a matrix gives
˜′1 c . e := C .. . ˜′M ∗ c
eY e y and ¯ ∗ is thus multivariate normal with mean C¯ The bootstrap distribution of the vector C e C e ′. covariance matrix s2 CS
These results allow to calculate the probability that any contrast cm has the maximum contrast test statistic as follows. First the case m = 1 is considered. The probability that c1 has the maximum test statistic is equivalent to the probability that the contrast has a test statistic
23
3 MODEL-BASED DOSE-RESPONSE ESTIMATION
larger than all other contrasts ¯∗ > c ¯ ∗ , ∀m ∈ {2, . . . , M ∗ }) ˜′m Y P (˜ c′1 Y ¯∗ − c ¯ ∗ > 0, ∀m ∈ {2, . . . , M ∗ }) ˜′m Y = P (˜ c′1 Y eY ¯ ∗ > 0), = P (Q1 C
(3.2)
where the ‘>’ is meant element-wise in the last expression 0 = (0, . . . , 0)′ ∈ RM 1 −1 0 . . . 0 (M ∗ −1)×M ∗ Q1 := ... . ∈R 1 0 0 . . . −1
∗ −1
and
eY ¯ ∗ are larger than 0 To calculate the probability that all elements of the random vector Q1 C
eY ¯ ∗ is multivariate normal with one needs to know its distribution. The distribution of Q1 C ′
e y and covariance matrix s2 Q1 CS e C e Q′ . The probability that Q1 C eY ¯ ∗ > 0 in all mean Q1 C¯ 1
elements is now obtained by integrating over the multivariate normal density with mean and covariance as described above from 0 to ∞ in all components. This is numerically feasable with
standard software for computing multivariate normal probabilities such as the mvtnorm package. This calculation can now be repeated for all contrasts. The matrix Qm looks different in each case and can be obtained by permuting the column 1 and m of Q1 . Finally a set of probabilites is obtained, one value for each contrast. A major advantage of this method to calculate the bootstrap model probabilities is its computational feasibility. A full resampling based approach would require a very large number of resamples to have a comparable accuracy. A drawback of this method is that strictly speaking only contrasts are selected or weighted, and not the models. The correspondence between contrasts and models is in general not one to one: for models, that have a shape parameter in the standardized model function the contrast represents just one possible shape of the model function. For example, it could be that the contrast has been optimized for an Emax model with a certain shape parameter but in fact an Emax model with a quite different shape parameter is true. Then it is possible that the Emax contrast would not be selected or downweighted at the model averaging step, if a different model has a larger contrast test statistic or a larger bootstrap probability to be the maximum contrast. Of course one can expect that a model associated with a large test statistic will describe the data well, as the model will always be able to cover the shape that is given by the contrast. So when the data favor a certain contrast the corresponding model will usually fit the data well. Thus a careful selection of the contrasts, covering roughly ‘all’ possible shapes partially overcomes this problem.
3 MODEL-BASED DOSE-RESPONSE ESTIMATION
24
Additionally one might expect a certain robustness of the optimal contrasts for small misspecification of the shape parameters. This would be consistent with Pinheiro, Bornkamp and Bretz (2006), who considered a slightly different question: they proposed methods to study the impact of specifying wrong shape parameters on the power of the overall dose-response test. For a well chosen candidate set the loss in power is usually negligible for smaller misspecifications. Although the task here is very different, one might expect that the robustness with respect to small misspecification of the shape parameter can at least partially carry over to model selection and model averaging. The robustness of the contrasts with respect smaller misspecifications will be investigated in the simulation study in Section 6. It is interesting to note that the described method—although derived from a completely different viewpoint—can also be justified in a Bayesian framework. Supposing the variance σ 2 is known and a non-informative constant prior is used for µi := µ(di ), i = 1, . . . , k the posterior distribution for µi is normal with mean y¯i. and sampling variance σ 2 /ni . The posterior of the vector µ = (µ1 , . . . , µk )′ is thus multivariate normal with covariance matrix σ 2 S, where S = diag(1/n1 , . . . , 1/nk ). Now if σ 2 is set to s2 and supposed to be known, the posterior distri¯ ∗ and the two methods coincide. In the bution for µ is equal to the bootstrap distribution of Y Bayesian framework it would also make sense to use a non-informative prior for σ 2 to acknowledge the uncertainty in the estimation of σ 2 . The posterior distribution for µi , i = 1, . . . , k would then be a t-distribution (O’Hagan and Forster 2004, p. 8).
3.3.2
Schwarz Information Criterion
A classical approach to model selection and model averaging is penalized likelihood. Within this approach one uses so called penalized likelihood criteria (often also called information criteria) that typically consist of two terms: one term that measures the goodness of fit (the maximized log-likelihood of the model) and a penalty term that penalizes the number of parameters in the model. The penalty term is necessary since models with more parameters are able to fit the data better just because of having more parameters but without being more adequate. The penalty prevents this overfitting. The Schwarz information criterion (SIC) is a penalized likelihood criterion introduced by Schwarz (1978). It is sometimes also called Bayesian Information Criterion as it is motivated by a Bayesian argument: it is derived as an asymptotic approximation of the Bayesian approach to model selection. In the following I will give an introduction
25
3 MODEL-BASED DOSE-RESPONSE ESTIMATION
to the Bayesian perspective to model selection and model averaging to derive the SIC. ∗ } of dose-response models. More Suppose again we have a candidate set M∗ = {M1∗ , . . . , MM ∗
∗ ), m = formally these dose-response models correspond to data models with densities p(y|ϑm , Mm
∗ augmented 1, . . . , M ∗ , here ϑm consists of the parameters θ m in the model function of model Mm
with σ. Due to the normality assumption (see equation (1.1)) the densities are all normal densities and the various data models just differ by the parametrization of the mean. ∗) Within the Bayesian approach one would now need to specify a prior distribution p(ϑm |Mm
∗ . The Bayesian measure used to compare for the parameters ϑm in the density of model Mm
different models is not the maximized likelihood as in classical statistics but the marginal (or integrated) likelihood ∗ p(y|Mm )
=
Z
∗ ∗ p(y|ϑm , Mm )p(ϑm |Mm )dϑm .
(3.3)
The overfitting problems encountered with the maximized likelihood do not occur with the marginal likelihood. ∗ ). The Hence for all dose-response models we have marginal likelihoods, p(y|M1∗ ), . . . , p(y|MM ∗
Bayesian approach to model selection or model averaging is now to introduce a discrete prior ∗ ))′ on the set of candidate models. Typically one probability distribution (p(M1∗ ), . . . , p(MM ∗ ∗ ) = 1/M ∗ for all models in M∗ , if all models are assumed equally likely a-priori. would use p(Mm
By Bayes’ theorem we can then obtain the posterior probabilities of the candidate models as ∗ )p(M ∗ ) p(y|Mm m ∗ p(Mm |y) = PM ∗ , m = 1, . . . , M ∗ . ∗ )p(M ∗ ) p(y|M j=1 j j
(3.4)
Thus when the task is model selection, one would choose the model with the largest posterior probability. For model averaging one would use the posterior probabilities as the averaging weights wm , m = 1, ..., M ∗ to average all subsequent inference. While the formulation of the solution in the Bayesian context is straightforward, the implementation of the Bayesian approach is challenging. How should one choose the priors for the model parameters? In our application precise prior knowledge about the individual parameters in the model is usually not available. A technical difficulty is the calculation of the integral (3.3). The Schwarz Information Criterion is derived as an asymptotic approximation of a transformation of the marginal likelihood and by this overcomes both problems mentioned above: the
3 MODEL-BASED DOSE-RESPONSE ESTIMATION
26
approximation does not analytically depend on the prior distributions, and a closed form ex∗ the criterion is given by pression for the approximation is available. For a model Mm ∗ ˆ ML,m , M ∗ )) + log(N )pm , SICm := SIC(Mm ) = −2 log(p(y|ϑ m
ˆ ML,m the maximum where pm is the number of parameters present in the model Mm and ϑ likelihood (ML) estimator for ϑm . Hence despite its derivation it is a typical penalized likelihood criterion as it consists of a maximized log-likelihood term and a penalty on the parameters in ∗ can be determined from formula (3.4): the model. The posterior probability for model Mm ∗)= setting p(Mm
1 M∗
∗ as for all models one obtains the posterior probability wm for model Mm ∗
exp(−0.5SICm )/
M X
exp(−0.5SICj ).
j=1
For model selection one would hence select the model with the smallest SIC, which is equivalent to the largest posterior probability. For model averaging one would use these posterior model probabilities. From a classical viewpoint the SIC has the advantage that it is easily interpretable as a penalized likelihood criterion just as the AIC, but is also applicable for non-nested models as can be seen below. From the Bayesian viewpoint the SIC has the major drawback that it is an asymptotic approximation. Computationally intensive simulation based techniques are available, that allow a non-asymptotic approximation of the marginal likelihood. A second drawback is the fact that if prior knowledge on the model parameters would be available, this knowledge could not be incorporated in the modelling process when using the SIC. Nevertheless the SIC has also been advocated in the Bayesian literature. For example, Kass and Raftery (1995)—describing various methods for approximating the marginal likelihood—note that the SIC might be used as a ‘rough approximation’. The derivation of the SIC gives insight into the assumptions and simplifications underlying the SIC. In the following I will give a derivation based on O’Hagan and Forster (2004, p. 180). ∗ is given by p(y|ϑ , M ∗ ). Maximizing the likelihood The likelihood function for a model Mm m m
ˆ ML,m . Expanding the logarithm of the function gives the maximum likelihood (ML) estimator ϑ ˆ ML,m and omitting terms involving derivatives of likelihood function in a Taylor series around ϑ order higher than 2 gives ∗ ˆ ML,m , M ∗ ) + 1 (ϑm − ϑ ˆ ML,m )′ V m (ϑm − ϑ ˆ ML,m ), log p(y|ϑm , Mm ) ≈ log p(y|ϑ m 2
27
3 MODEL-BASED DOSE-RESPONSE ESTIMATION
where V m =
�
�
∗) ∂ 2 log p(y|ϑm ,Mm ∂ϑm,i ∂ϑm,j (i,j)
ˆ ML,m . The is the matrix of second derivatives evaluated at ϑ
first derivative does not appear in the equation as it is zero, when evaluated at the maximum likelihood estimator. Now for a large sample size one might expect the posterior distribution to be concentrated around its mode, which is approximately the ML estimator. Using the above approximation to the likelihood and evaluating the prior p(ϑi |Mi∗ ) at the ML estimator gives Z ∗ ∗ ∗ p(y|Mm ) = p(y|ϑm , Mm )p(ϑm |Mm )dϑm � � Z 1 ∗ ∗ ′ ˆ ˆ ˆ ˆ ≈ p(y|ϑML,m , Mm )p(ϑML,m |Mm ) exp (ϑm − ϑML,m ) V m (ϑm − ϑML,m ) dϑm 2 ˆ ML,m , M ∗ )p(ϑ ˆ ML,m |M ∗ )(2π)pm /2 det(−V −1 )−1/2 = p(y|ϑ m
m
m
ˆ ML,m , M ∗ )p(ϑ ˆ ML,m |M ∗ )(2π)pm /2 N −pm /2 det(I m )1/2 = p(y|ϑ m m
(3.5)
ˆ ML,m In the first step, the Taylor approximation of the log-likelihood is used and the fact that ϑ is independent of the integration with respect to ϑm . In the second step it can be observed ˆ M L,m that the remaining integrand is the kernel of a multivariate normal density with mean ϑ and covariance −V −1 m . Hence integrating the remaining integrand gives the standardization constants of the density. In the third step the fact that −V m ≈ N I m is used, where is the Fisher information matrix in one observation. Now transforming equation (3.5) to the scale of the SIC gives ˆ ML,m , M ∗ )) + log(N )pm + a, −2 log(p(y|Mi∗ )) ≈ −2 log(p(y|ϑ m ˆ ML,m |M ∗ )) − pi log(2π) − log(det(I m )). The SIC is now obtained by where a = −2 log(p(ϑ m setting a = 0. Kass and Raftery (1995) also discuss the quality of SIC as an approximation to the marginal likelihood. From formula (3.5) it is obvious that the approximation is especially ˆ ML,m |M ∗ ) = good if for the prior distribution p(ϑ|Mi∗ ) evaluated at the ML estimator holds p(ϑ m
(2π)−pm /2 det(I m )−1/2 . This would for example be the case, if a multivariate normal prior would ˆ ML,m and covariance matrix I m . From the derivation of the SIC it be used for ϑm with mean ϑ can be seen that it can be applied in rather general settings, for example for non-nested models.
28
4 MODEL-FREE DOSE-RESPONSE ESTIMATION
4
Model-Free Dose-Response Estimation
In this section two model-free regression techniques will be described. In contrast to Section 3.3 no parametric form of the mean dose-response profile µ(.) is assumed. Instead, certain assumptions about the smoothness of the curve are made, which will be described in detail for both methods. In Section 4.1 local polynomial regression techniques are introduced. This is a popular technique for nonparametric regression and I will concentrate the discussion in this section on issues that specially arise for dose-response data: sparse designs, replications at the design points and choice of certain tuning parameters with the prior assumptions of doseresponse data in mind. In Section 4.2 I will introduce a flexible Bayesian regression technique that does not assume a particular dose-response model. Special emphasis in this chapter will also be laid on how to choose the involved prior and hyperprior distributions in the context of dose-response studies.
4.1
Local Polynomial Regression
Local regression techniques can be motivated by Taylor’s theorem. The theorem states that a p + 1 times continuously differentiable function µ(x) for x close to an expansion point x0 can be approximated by the following polynomial of degree p µ(x) ≈
p X µ(k) (x0 ) k=0
k!
k
(x − x0 ) =:
p X k=0
βk (x0 )(x − x0 )k .
If x is identical to the expansion point x0 the polynomial above reduces to its intercept term µ(x0 ) ≈ β0 (x0 ). This result inspires the development of local regression techniques. The basic idea is that µ(x0 ) for each fitting point x0 is estimated by a local polynomial. The intercept term of this local polynomial is then used as an estimator for µ(x0 ). Figure 4.1 illustrates the local fitting process with the IBS example data set for the fitting point x0 = 0.4. In Section 4.1.1 the estimator will be derived in detail and some of its statistical properties will be described. In Section 4.1.2 three basic ingredients of local regression will be described: the weight function, the type of bandwidth and the local polynomial degree. The weight function—typically a non-negative function W (sometimes also called kernel function)—is used to assign weights to the data points according to their distance from the fitting point. In Figure 4.1 the weight function is drawn
29
0.4 0.0
0.2
Response
0.6
0.8
4 MODEL-FREE DOSE-RESPONSE ESTIMATION
0.0
0.2
0.4
0.6
0.8
1.0
Dose
Figure 4.1: Illustration of local fitting for the IBS dataset. Local polynomial used for the fitting point x0 = 0.4 (black line), local intercept (•), global estimate of the function (gray line), means at the observed dose levels (•) and weight function used in the fit (dashed gray line).
schematically. The bandwidth parameter h scales the weight function and by this selects the complexity of the fitted line. Several types of bandwidth exist, I will review some of them with respect to their relevance in the dose-finding context. The choice of the local polynomial degree is also crucial, as it controls the flexibility of the fits. An even more important decision to be made in local regression is the value of the bandwidth parameter. For a small bandwidth the weight function becomes highly peaked at the fitting point and only points close to the fitting point get a large positive weight. The resulting fit is very complex. For a very large bandwidth parameter the weight function becomes flat and all points roughly get the same weight. In this case the fitted estimate is close to the global polynomial fit. In Section 4.1.3 methods for bandwidth selection will be introduced. Most of these methods were developed for the case of non-replicated data. In Section 4.1.4 model selection for replicated data will be investigated. As there are usually replicated observations at the dose levels this is an important issue in the dose-response context. Throughout this chapter I will make continuous references to the locfit package for R, which provides an efficient way for fitting local polynomials (Loader 2005).
30
4 MODEL-FREE DOSE-RESPONSE ESTIMATION
4.1.1
Background
Suppose we want to estimate the dose-response curve at a certain point x0 . It is assumed that the weight function W , the local polynomial degree p and the bandwidth h have already been determined. The fitting weights are given by wi (x0 ) = W
�
di − x0 h
�
.
(4.1)
An adequate criterion to fit the local polynomial are the residual sum of squares. As weights are given, the weighted sum of squares is minimized k X i=1
wi (x0 )
ni X j=1
(yij − (β0 (x0 ) + β1 (x0 )(di − x0 ) + . . . + βp (x0 )(di − x0 )p ))2
(4.2)
In matrix notation this criterion can be written as (y − X x0 β(x0 ))′ W x0 (y − X x0 β(x0 )), where y = (y11 , y12 , . . . , y1n1 , y21 , . . . , yknk )′ denotes the vector of observed values, 1 d1 − x0 . . . (d1 − x0 )p 1 d1 − x0 . . . (d1 − x0 )p X x0 = . ∈ RN ×(p+1) , .. .. .. .. . . . 1 dk − x0 . . . (dk − x0 )p
denotes the design matrix for the fitting point x0 , W x0 := diag( (w1 (x0 ), . . . , wk (x0 ))′ ) denotes the weight matrix of dimension N × N , and β(x0 ) = (β0 (x0 ), . . . , βp (x0 ))′ denotes the vector of local regression coefficients. Provided W x0 X x0 has full column rank, least squares theory gives the explicit solution to this minimization problem: the estimate for the parameter vector β(x0 ) of the local polynomial is given by (Loader 1999, p. 34) ˆ 0 ) = (X ′ W x X x )−1 X ′ W x y. β(x x0 x0 0 0 0 The local polynomial estimator for µ(x0 )—the intercept parameter of the local polynomial—is given by µ ˆ(x0 ) = βˆ0 (x0 ) = e′1 β(x0 ) = e′1 (X ′x0 W x0 X x0 )−1 X ′x0 W x0 y =: l(x0 )′ y,
(4.3)
4 MODEL-FREE DOSE-RESPONSE ESTIMATION
31
where e1 = (1, 0, . . . , 0)′ ∈ Rp+1 and l(x0 ) ∈ RN . From the expression (4.3) one can immediately obtain expressions for the variance and the expectation of the local polynomial estimate E(ˆ µ(x0 )) = l(x0 )′ E(y) = l(x0 )′ (µ(d1 ), µ(d1 ), . . . , µ(dk ))′ V ar(ˆ µ(x0 )) = l(x0 )′ Cov(y)l(x0 ) = σ 2 l(x0 )′ l(x0 ).
(4.4)
The expression l(x0 )′ l(x0 ) measures the decrease in variance from the sampling variance σ 2 to the variance of the local polynomial estimate at x0 . It can be shown (Loader 1999, Theorem 2.3) that l(x0 )′ l(x0 ) ≤ 1, hence local regression is variance reducing. From the equation (4.3) it can be seen, that once the weight function, the degree and the bandwidth parameter have been chosen, the estimator is linear in the response values y. That means that there exists a matrix L ∈ RN ×N that maps the response values to the predictions. This matrix is—in analogy to parametric regression analysis—called hat matrix, µ ˆ(d1 ) l(d1 )′ ′ µ ˆ(d1 ) l(d1 ) = .. .. . . µ ˆ(dk ) l(dk )′
y =: Ly
(4.5)
In parametric regression analysis the trace of the hat matrix is equal to the number of regressors. In this context the number of parameters in the model is also called degrees of freedom. The trace of the hat matrix for local polynomials can be interpreted as the equivalent degrees of freedom. The expression tr(L) is no longer an integer as in parametric regression analysis but gives a good idea of the smoothing involved. Large values of tr(L) indicate a complex fit and small values a fit, close to the global polynomial model. In Section 4.1.3 we will see another reason why tr(L) plays a central role for local polynomial smoothing. As we have replications at the dose-levels in dose-response analysis, the fitting procedure can also be performed on the mean values at the dose-levels with weights according to the sample-size per group. This approach is more efficient for the actual calculations as the involved matrices are of smaller dimension. Minimizing the weighted residual sum of squares criterion (4.2) is equivalent to minimize (see Appendix A.2) k X i=1
wi (x0 )ni [¯ yi. − (β0 (x0 ) + β1 (x0 )(di − x0 ) + . . . + βp (x0 )(di − x0 )p )]2 .
In matrix notation this can be written as (¯ y − X ∗x0 β(x0 ))′ W ∗x0 (¯ y − X ∗x0 β(x0 )),
(4.6)
32
4 MODEL-FREE DOSE-RESPONSE ESTIMATION
where X ∗x0
1 d1 − x0 . . . (d1 − x0 )p .. .. .. = ... , . . . 1 dk − x0 . . . (dk − x0 )p
is now a k × (p + 1) design matrix, W ∗x0 := diag( (w1 (x0 )n1 , . . . , wk (x0 )nk )′ ) ∈ Rk×k and ¯ = (¯ y y1. , . . . , y¯k. )′ . The formula for the estimator of the local parameter vector is then ˆ 0 ) = (X ∗′ W ∗ X ∗ )−1 X ∗′ W ∗ y β(x x0 x0 x0 x0 x0 ¯ . Despite the fact that the involved matrices are different, the parameter estimates are the same, as they minimize the same criterion. But the hat matrix L∗ that maps the k dimensional vector of means to the k predictions at the dose levels, is obviously different from L as it is of dimension k × k,
∗ ′ ′ ′ e1 (X ∗d1 W ∗d1 X ∗d1 )−1 X ∗d1 W ∗d1 l (d1 )′ µ ˆ(d1 ) .. .. .. ¯ =: ¯ =: L∗ y ¯. y y = . . . ′ ′ ∗ ′ ∗ ∗ ∗ ∗ ∗ −1 ′ l (dk ) µ ˆ(dk ) e1 (X dk W dk X dk ) X dk W dk
Although L and L∗ are of different dimension they have the same trace. This is an important fact, which we will need later in this thesis. This can be seen by as follows. The local parameter estimates are the same using pooled or unpooled data, so that the estimates for µ(x0 ) are the same as well ¯, µ ˆ(x0 ) = l(x0 )′ y = l∗ (x0 )′ y where l(x0 ) = (l11 (x0 ), . . . , l1n1 (x0 ), . . . , lknk (x0 ))′ and l(x0 )′ y =
Pk
i=1
Pni
j=1 lij (x0 )Yij .
Note that responses corresponding to the same dose get the same weight in L (the row of the design matrix is the same, as is the entry in the weight matrix), i.e., lij (x0 ) = li1 (x0 ) for j = 1, . . . , ni , i = 1, . . . , k Thus
Pk
i=1
Pni
j=1 lij (x0 )Yij
=
Pk
i=1 li1 (x0 )
Pni
i=1 Yij
=
Pk
¯
i=1 ni li1 (x0 )Yi. .
From the equality of the predictions and the fact that l and l∗ do not depend on y it follows for the entries of l∗ that li∗ (x0 ) = ni li1 (x0 ). As this result does not depend on x0 it also holds for all dose levels and it follows that P P P P i lij (di ) = ki=1 ni li1 (di ) = ki=1 li∗ (di ) = tr(L∗ ). So the trace of the hat tr(L) = ki=1 nj=1
matrix is the same.
It is interesting to note that Loader (1999, Theorem 2.3) shows that the diagonal elements of the hat matrix are smaller or equal to one. From the above discussion on the trace on the hat
33
0.6 0.4 0.0
0.2
W(x)
0.8
1.0
4 MODEL-FREE DOSE-RESPONSE ESTIMATION
−1.5
−1.0
−0.5
0.0
0.5
1.0
1.5
x
Figure 4.2: Weight functions as implemented in the locfit package. Rectangular (gray line), Epanechnikov (dashed line) and Gaussian (solid line) weight function.
matrix it follows that tr(L∗ ) = tr(L) ≤ k. So the equivalent degrees of freedom are always smaller (or equal) than the number of doses. Before starting a more detailed discussion of the components of local regression one remark regarding the computational implementation of local regression. From the theory described above it becomes obvious that a direct implementation would be time intensive, as for each fitting point a weighted least squares problem would need to be solved. Typically implementations of local regression fit local polynomials only at a small number of points and then use interpolation for predictions of the fitted model. This is also true for the locfit implementation, see Chapter 12 of Loader (1999) for a description of the underlying interpolation techniques.
4.1.2
Weight Function, Type of Bandwidth and Local Degree
The Weight Function The choice of the weight function can be based on prior knowledge of the dose-response shape, on computational issues and on asymptotic properties. If one asserts that the mean function µ(x) is continuous and smooth, weight functions that result in non-smooth or even discontinuous fits should not be used. Hence one of the simplest weight functions, the rectangular weight function is not appropriate in our case (see Table 4.1 and Figure 4.2). The weight function should have its peak at x = 0 and should decrease smoothly to zero. This can be justified by the fact that points farther from the fitting point can be assumed to carry less information about the
4 MODEL-FREE DOSE-RESPONSE ESTIMATION
Weight function Rectangular Epanechnikov Gaussian
34
W (x) I[−1,1] (x) (1 − x2 )I[−1,1] (x) exp(−(2.5x)2 /2)
Table 4.1: Weight functions as implemented in the locfit package; I(x) denotes the indicator function.
response at the fitting point. Cleveland and Loader (1996) argue that the actual choice of the weight function does not crucially influence the fit as long as these two requirements are fulfilled. For computational reasons it is convenient to use weight functions with bounded support, as only a subset of the whole data set is used in the fitting process. In the case of many design points numerical calculations are then more efficient. One of the most common weight functions that has bounded support is the Epanechnikov weight function (see Table 4.1 and Figure 4.2). It turns out to be the minimizer of the asymptotic expression of the pointwise mean squared error of the local polynomial estimate (Loader 1999, pp. 228–229). In dose-response studies the dose variable is typically sparse. Hence computational arguments to use weight functions with bounded support do not apply here. Additionally one would get into problems, when using small bandwidths. If the smoothing window does not contain enough dose points the matrix X ′x0 W x0 X x0 can become singular. From this point of view it is convenient to use weight functions with unbounded support, for example the Gaussian weight function (see Table 4.1 and Figure 4.2). With this weight function each dose point will get a fitting weight larger than 0. Hence we can avoid the problems encountered with weight functions that have bounded support. The asymptotic mean square error of the Gaussian weight function is close to the one of the Epanechnikov weight function (Loader 1999, p. 229). Type of Bandwidth In this chapter three bandwidth concepts will be defined and compared with respect to their suitability in the dose-response context. The simplest type of bandwidth is called constant or global bandwidth. Here one value h is specified and used for all fitting points. The underlying assumption when choosing a global bandwidth is that the shape of the underlying function is not very complex. However, functions with varying smoothness over the design domain would be difficult to model with a global bandwidth.
4 MODEL-FREE DOSE-RESPONSE ESTIMATION
35
The second type of methods uses a bandwidth function h(x0 ), so the used bandwidth depends on the location of the fitting point x0 . The h in formula (4.1) is then replaced by h(x0 ). This type of bandwidth specification is mostly called local variable bandwidth and overcomes the disadvantage of global bandwidths. This type of bandwidth can adapt to situations, when the true function is for example constant in one region and sharply increasing or decreasing in another. The third method also uses a bandwidth function h(x0 ) and is known as global variable bandwidth or nearest neighbor bandwidth. Here, globally the percentage of nearest neighbors is specified that should be used for each fitting point. Then for every fitting point the bandwidth is calculated such that it covers the specified percentage of nearest neighbors. The rationale of choosing the nearest-neighbor bandwidth is that the variance of the local estimate is kept approximately constant over the whole fitting region. It is the default value for the locfit package. In the dose-response context it seems to be sufficient to use a global bandwidth. The doseresponse relationships are usually not very complex, mostly monotone increasing or unimodal. Additionally, due to the sparse designs it seems difficult to estimate a bandwidth function h(x0 ). The nearest-neighbor bandwidth also seems unsuited: the definition of a percentage value of nearest neighbors is difficult if there are replications at the design points. Additionally the dose design would influence the used bandwidth (small bandwidth for regions with many dose-levels, large bandwidth in regions with few dose-levels), this is not always a desirable property, as the dose design is usually not chosen with these considerations in mind. Local Degree Another important choice to be made is the degree p of the fitted local polynomial. As indicated before, data sets in the dose-finding context are usually sparse and thus the local degree is already restricted by this sparseness. To fit a polynomial of degree p locally at least p + 1 distinct design points are needed. Additionally a local degree larger than two seems unsuited. A global cubic polynomial fit itself would be too flexible in some scenarios, and the local quadratic fit can already model quite complex curves. The case of local constant fitting (degree 0), this means using weighted averages locally, is theoretically well studied under the name kernel regression but suffers of a bias near the boundaries (Cleveland and Loader 1996). As an example consider the left boundary. As the response right of the placebo response is usually
36
0.4 0
0.2
Response
0.6
0.8
4 MODEL-FREE DOSE-RESPONSE ESTIMATION
0.0
0.2
0.4
0.6
0.8
1.0
Dose
Figure 4.3: Local constant (solid line), local linear (dashed line) and local quadratic (dotted line) fit of example dose response data. The (global) bandwidths were chosen such that the equivalent degrees of freedom were 3.2 for all fits.
larger than the placebo response, one would systematically overestimate the placebo response, when using a weighted average of the data close to the placebo response. For an illustration see for example Figure 4.3. For a local degree larger than 0 the problem disappears. Then the method automatically has a ‘trend’ correction through the linear or higher order terms. So local degrees of one or two seem to be best suited in the dose-response context. Some authors explicitly state that local degrees of even order should not be used, as the asymptotic variance is not increasing, when moving from an even to the next higher odd degree, but the asymptotic bias reduces in every step (Fan and Gijbels 1996, p. 79). There is no agreement, whether this is relevant for a finite sample size and it has been debated in the literature, see, for example, Cleveland and Loader (1996). As discussed above in the dose-response context moving to a degree higher than two seems not reasonable, especially with the sparseness of the dose design in mind.
4.1.3
Model Choice
Upon selection on the type of bandwidth another important issue is the choice of the bandwidth value. Here the discussion is restricted to global bandwidth selection. The weight function and
4 MODEL-FREE DOSE-RESPONSE ESTIMATION
37
local polynomial degree are assumed to be already selected. To show the dependence of the estimator on the bandwidth h the notation µ ˆh will be used for the local polynomial estimator with bandwidth h in the next two sections. The choice of the bandwidth parameter h is especially important as it determines the complexity of the fit. The complexity can range from interpolating the means (very small h) up to a global parametric fit of degree p for infinitely large h. In the latter case the weight function would give equal weight to all observations for every fitting point. When choosing a very small bandwidth the curve estimate will have a small bias as the curve is mainly determined by the data close to the fitting point and can ‘follow’ the data more easily. But the variance of the fitted curve is large. When selecting a large bandwidth the estimated curve becomes similar to the global polynomial fit and the bias becomes larger as usually the true function is not the global polynomial of the specified degree. With a larger bandwidth ‘more’ data are used for each fitting point and hence the variance of the estimate gets smaller. This contrary behavior of bias and variance is sometimes called the bias-variance tradeoff in bandwidth selection and makes bandwidth selection a difficult task. In the following classical methods for bandwidth selection will be presented. As most methods for smoothing parameter selection were not developed for replicated data, I will for simplicity first assume the observations y1 , . . . , yN are given corresponding to distinct design points x1 , . . . , xN . The case relevant for dose-response studies, with replications at the design points, will be discussed in Section 4.1.4. Generalized Cross Validation A traditional approach to complexity selection is cross validation and its companion generalized cross validation (GCV). The motivating idea of cross validation is to produce an estimate that can predict future observations well. This prevents an overfitting of the data used in the fitting process. A suitable criterion to evaluate the predictive performance of the estimated curve is the prediction mean square error (Loader 1999, p. 30), P M SE(h) = E[(Ynew − µ ˆh (xnew ))2 ], where µ ˆh (xnew ) is the prediction at a point xnew and Ynew the observation corresponding to xnew .
38
4 MODEL-FREE DOSE-RESPONSE ESTIMATION
An obvious estimate of P M SE(h) is the so called cross validation estimate CV (h) =
N 1 X (−i) (yi − µ ˆh (xi ))2 . N i=1
(−i)
Here µ ˆh
(xi ) denotes the estimate of µ(xi ), when leaving out the observation corresponding to
xi in the fitting process. Evaluation of CV (h) is computationally very expensive as N curves need to be fit, each observation being left out once. Fortunately for local regression there exists a short cut that makes the procedure computationally much cheaper: it can be shown (−i)
(Loader 1999, p. 35) that µ ˆh
(xi ), i = 1, . . . , N , can be calculated from the fit including all
observations, via (−i)
µ ˆh
(xi ) =
µ ˆh (xi ) − li (xi )yi , 1 − li (xi )
where li (xi ) denotes the i th entry of l(xi ) at the fitting point xi and is hence a diagonal element of L. Thus, CV (h) reduces to � � N � N � 1 X µ ˆh (xi ) − li (xi )yi 2 1 X yi − µ ˆh (xi ) 2 CV (h) = yi − = . N 1 − li (xi ) N 1 − li (xi ) i=1
i=1
An approximation to the cross validation criterion that is even faster to calculate is generalized cross validation. Here the diagonal elements li (xi ) of the hat matrix L are replaced by their average tr(L)/N . The generalized cross validation criterion is defined as � N � 1 X yi − µ ˆh (xi ) 2 GCV (h) = . N 1 − tr(L)/N i=1
Despite the fact that it is derived as an approximation to the cross validation criterion, generalized cross validation has many desirable theoretical properties and is usually the preferred choice. It is for example invariant under affine transforms of the independent variable y, as the denominator is independent of the summation. That is, minimizing the generalized cross validation score gives the same optimal bandwidth for the original data as under affine transformation of the data. Ordinary cross validation does not have this property as the denominator is not independent of the summation. Generalized cross validation is the standard procedure for selecting the smoothing parameter for smoothing splines, a related nonparametric regression technique. For local polynomials its usage has been debated but is nevertheless a popular choice. I will give a brief account of this discussion later in this chapter.
4 MODEL-FREE DOSE-RESPONSE ESTIMATION
39
Unbiased Risk Estimation Unbiased risk estimation is another possibility for bandwidth selection. The idea is to derive a statistic that is an unbiased estimator of E(L(h)), where L(h) =
N X i=1
(ˆ µh (xi ) − µ(xi ))2 .
It can be shown that N 1 X U BR(h) = 2 (yi − µ ˆh (xi ))2 + 2tr(L) − N, σ i=1
fulfills this property (Loader 1999, p. 31). Note that the sampling variance σ 2 is assumed to be known in the derivation. In case of distinct design points x1 , . . . , xN this is a major drawback of the method and cross validation is generally the preferred choice. For the case of replicated data the common variance estimate S 2 introduced in Section 2.1 is a reasonable choice for σ 2 . Note that in Loader (1999) the U BR(h) statistic is called Mallows CP. Plug-in Approaches Cross validation and unbiased risk estimation have been critized in the literature for producing fits that are too variable. Fan and Gijbels (1996, pp. 67–68), for example, describe an alternative method using a plug-in approach (note that this has nothing to do with the plug-in principle used in the bootstrap literature). The integrated mean square error (i.e., the pointwise mean square error of the curve estimate averaged over the design space) of the local polynomial estimate is approximated by an asymptotic expression. Minimizing this expression gives a closed form solution for the asymptotically optimal global bandwidth. Unfortunately this expression depends on the second derivative of the true underlying curve. The basic idea of the plug-in approach is now to estimate the second derivative from the data and plug this into the formula of the asymptotically optimal bandwidth. Although this approach is intuitively appealing, an undesirable property is that the final selected bandwidth is quite sensitive to the estimate of the second derivative, which itself needs a bandwidth selection. Hence the problem of bandwidth selection is not really solved and plug-in bandwidth selection will not be considered further in this thesis. For a more detailed discussion of this topic see Loader (1999, pp. 191–192) and the cited references.
40
4 MODEL-FREE DOSE-RESPONSE ESTIMATION
4.1.4
Model Choice with Replicated Data
The interpretation of cross validation and generalized cross validation becomes somewhat difficult, in the presence of replications at the design points. In principle two methods can be applied: (i) Leave out each observation once and minimize the generalized cross validation score based on the original data as if the design points were distinct, or (ii) pool the data at the doses and minimize the generalized cross validation score of the pooled data set (di , y¯i. ), i = 1, . . . , k with weights according to the group sample sizes ni . The first approach seems to contradict the idea of minimizing the predictive error at a new location of the x-variable (see the definition of the P M SE(h)). The second approach discards information about the variability in the data as the group means are used. Hence no approach seems to be superior at first sight. In this section I will give some insight into the difference between the two approaches. It is based on results derived by Gu, Heckman and Wahba (1992) for the case of smoothing splines. For the original data one would select the bandwidth that minimizes � ni � k X X yij − µ ˆh (di ) 2 , N − tr(L) i=1 j=1
which is the GCV (h) score of above up to the (for optimization purposes) arbitrary constant N . For pooled data the bandwidth would be selected as the minimizer of k X ni (¯ yi. − µ ˆh (di ))2 i=1
(k − tr(L∗ ))2
.
(4.7)
It is straightforward to show that ni ni k X k X k X X X ni (¯ yi. − µ ˆh (di ))2 + (yij − y¯i. )2 . (yij − µ ˆh (di ))2 = i=1 j=1
i=1
i=1 j=1
In Section 4.1 we noted that tr(L) = tr(L∗ ). Combining both results the criterion based on the original data can be written as Pk � ni � k X X ni (¯ yi. − µ ˆh (di ))2 + (N − k)s2 yij − µ ˆh (di ) 2 . = i=1 N − tr(L) (N − tr(L∗ ))2 i=1 j=1
(4.8)
4 MODEL-FREE DOSE-RESPONSE ESTIMATION
41
Comparing equations (4.7) and (4.8) it becomes obvious that it makes a difference, whether the bandwidth minimizing the generalized cross validation criterion for pooled or original data is selected: the nominator of (4.8) is similar, as s2 does not depend on h and by this does not affect minimization. But the denominators of (4.7) and (4.8) differ. For unbiased risk estimation the situation is different Gu et al. (1992) show that in this case (with σ 2 set to s2 ) it does not matter whether pooled or original data are used. To gain insight into the different minimizers Gu et al. (1992) treat the different criteria as functions of the complexity parameter, differentiate them with respect to the complexity parameter and equate the first derivative to zero. Doing this one obtains insights into the condition a minimizer has to fulfill. For local polynomial regression the complexity parameter is the bandwidth. The differentiation with respect to the bandwidth can also be carried out for local polynomials, provided the criteria are differentiable. For this to be true, µ ˆh (di ) = e′1 (X ′di W di X di )−1 X ′di W di y and the diagonal entries of the hat matrix have to be differentiable with respect to h for i = 1, . . . , k. This is true if a differentiable weight function is used (for example the Gaussian weight function) and ′
X di W di X di is non-singular for i = 1, . . . , k. The criteria are then a composition of differentiable functions. So the results of Gu et al. (1992) carry over to our case, their main conclusions are: • Unbiased risk estimation (with σ 2 estimated as s2 ) results in the same optimal bandwidth for pooled and original data. • Generalized cross validation with original data gives a minimizer similar to the minimizer of unbiased risk estimation. • Generalized cross validation with pooled data does not use the information about σ 2 . In summary still none of these arguments strongly favors any method mentioned above. Nevertheless the use of generalized cross validation with original data can be justified: its behavior is very similar to unbiased risk estimation, which gives the same minimizer for pooled and original data. Gu et al. (1992) also conduct a small simulation study. In the scenario of a larger sampling variance (the scenario relevant for dose-response data), both approaches perform similar but sometimes generalized cross validation based on the original data gives better results. For these two reasons it will be used subsequently.
4 MODEL-FREE DOSE-RESPONSE ESTIMATION
4.2
42
Gaussian Process Regression
In this section I will introduce a Bayesian model-free regression technique. The Bayesian approach seems to be promising for dose-response modelling as it allows the incorporation of prior knowledge on the smoothness of the dose-response curve. In addition the Bayesian approach automatically provides information about the uncertainty for the quantities of interest, for example, credible intervals for the dose-response curve or the target dose. In a model-based Bayesian regression approach a dose-response model and prior distributions for the associated parameters need to be specified. All subsequent inference would then concentrate on the parameters of the dose-response model. In a model-free context the primary target of interest is the dose-response function µ(.) itself. Obviously µ(.) is not a finite dimensional parameter, hence it is not obvious what type of prior distribution should be used for µ(.). One possibility is to consider the prior distribution for a single point µ(x0 ) with x0 ∈ [d1 , dk ] on the dose-response curve. A natural choice would be a normal prior distribution for µ(x0 ). Now if for ‘all’ finite subsets (x1 , . . . , xt )′ with xi ∈ [d1 , dk ], i = 1, . . . , t, t ≥ 1 the prior is chosen as a
normal distribution and the joint distribution of (µ(x1 ), . . . , µ(xt ))′ is chosen as a multivariate
normal distribution, the prior distribution for the entire dose-response curve µ(.) is a Gaussian process. Hence the Gaussian process can be seen as a generalization of the multivariate normal distribution to the infinite case. Similarly to the corresponding property of the multivariate normal distribution, a Gaussian process is specified by its mean function m(.) and covariance function γ(., .), that determines the covariance between two points in [d1 , dk ]. I will write µ(.) ∼ GP (m(.), γ(., .)). The mean and the covariance function determine the mathematical properties of the realizations of a Gaussian process, for example continuity or differentiability (see Adler (1981) for details). In this thesis only mean- and covariance functions will be considered that ensure continuity and differentiability of the dose-response curve. There are restrictions on how the covariance function for a Gaussian process can be chosen: Suppose µ(.) is a Gaussian process, then for the P variance of a linear combination of points lj=1 aj µ(xj ) holds by definition of the variance that �P � l Var a µ(x ) ≥ 0, for arbitrary a1 , . . . , al ∈ R and l ∈ N. So the covariance function has j j=1 j to fulfill the inequality
Var
l X j=1
aj µ(xj ) =
l X l X i=1 j=1
ai aj γ(xi , xj ) ≥ 0.
4 MODEL-FREE DOSE-RESPONSE ESTIMATION
43
This property means that the covariance matrix of (µ(x1 ), . . . , µ(xl ))′ , (γ(xi , xj ))(i,j) ∈ Rl×l has to be positive semi definite. Functions γ with this property are therefore called positive semi definite. As (γ(xi , xj ))(i,j) ∈ Rl×l is symmetric another necessary property for the covariance function is that γ(x, x′ ) = γ(x′ , x). Additionally it is assumed in this thesis that the covariance
function can be written as γ(x, x′ ) = τ 2 R(x, x′ ), where τ 2 is the variance of the Gaussian process and R(x, x′ ) is called correlation function.
4.2.1
Background
The idea of using Gaussian processes as prior distributions goes back at least to O’Hagan (1978). As no global parametric model is assumed this method might be called a Bayesian nonparametric regression technique. The data model in our dose-response context can be formulated as Yij |µ(.), σ ∼ N (µ(di ), σ 2 ) µ(.)|β, φ ∼ GP (mβ (.), γφ(., .)), where β and φ are possible hyperparameters of the mean function and the covariance function. In contrast to the data model introduced in Section 1.3 µ(.) is no longer regarded as a fixed function but as a Gaussian process. Again for computational reasons it is easier to work in lower dimensions. As all information about the response to dose di is included in Y¯i. the data model can equivalently be rewritten as Y¯i. |µ(.), σ ∼ N (µ(di ), σ 2 /ni ) µ(.)|β, φ ∼ GP (mβ (.), γφ(., .)), Hence, the vector (Y¯1. , . . . , Y¯k. , µ(x))′ , x ∈ [d1 , dk ], has a multivariate normal prior distribution with mean (mβ (d1 ), . . . , mβ (dk ), mβ (x))′ =: (m, mβ (x))′ and covariance matrix � � Γ + σ2S γ ′ (x) , γ(x) γφ(x, x) where S = diag(1/n1 , . . . , 1/nk ),
γφ(d1 , d1 ) . . . γφ(d1 , dk ) .. .. .. Γ= , . . . γφ(dk , d1 ) . . . γφ(dk , dk ) γ(x) = (γφ(x, d1 ), . . . , γφ(x, dk ))′ and γφ(., .) is a covariance function (O’Hagan and Forster 2004, p. 394). Using the properties of the multivariate normal distribution, the conditional
44
4 MODEL-FREE DOSE-RESPONSE ESTIMATION distribution of µ(x) given (Y¯1. , . . . , Y¯k. )′ and the parameters σ, β, φ is Gaussian with mean m∗ (x) = mβ (x) + γ ′ (x)W −1 (¯ y − m)
(4.9)
and variance γ ∗ (x, x) = γφ(x, x) − γ ′ (x)W −1 γ(x), where W = Γ + σ 2 S (O’Hagan and Forster 2004, p. 395). This is the posterior distribution at a single point x. The posterior distribution for the entire curve µ(.) is hence again a Gaussian process with mean function m∗ and covariance function γ ∗ (x, x′ ) = γφ(x, x′ ) − γ ′ (x)W −1 γ(x′ ).
(4.10)
In Section 4.2.2 it will be considered how to choose the prior mean and covariance function for dose-response analysis. The result presented above depends on the hyperparameters φ and σ being fixed and known. In Section 4.2.3 some ideas will be given how to choose priors for the hyperparameters and σ to reflect the uncertainty about these parameters. Additionally the prior to posterior analysis will be performed for the hyperparameters and σ. A fully Bayesian analysis of the model with priors for the hyperparameters is computationally expensive as analytic posterior updating is not possible. In Section 4.2.4 I will present ideas how to implement Bayesian inference, based on simulation and approximate Bayesian inference based on maximization. In dose-response modelling we are interested in assessing the dose-response effect and estimating the target dose. Section 4.2.5 describes how both objectives can be achieved in the Bayesian setting. Although this approach to regression is not widely used in clinical trials it has been widely studied in the geostatistical literature under the name kriging. See for example Handcock and Stein (1993) for an introduction to kriging from a Bayesian viewpoint. Smoothing spline regression is also closely connected to the technique described in this section. Wahba (1978) shows that the smoothing spline estimator can be derived as the posterior mean of the model described in this chapter for certain choices of the prior mean and covariance function. The hyperparameters in the smoothing spline model are usually estimated by generalized cross validation and not with Bayesian techniques. A good overview of methods related to Gaussian processes is given by Neal (1998).
4 MODEL-FREE DOSE-RESPONSE ESTIMATION
4.2.2
45
The Prior Distribution
A Gaussian process is determined by its prior mean and covariance function. In this section sensible choices for the specification of these functions in the dose-response context are investigated. Prior Mean Function The choice of the prior mean function is less critical than the choice of a global parametric model, as the posterior mean function can be quite different from the prior mean function. Nevertheless the posterior mean will be a compromise between the prior mean and the data. The influence of the prior mean function will be especially strong in regions, where the design is sparse (such as the boundaries of the design region). So the prior mean should be selected with considerable care. One possibility is to introduce the weak prior information in a linear model: it is usually expected that the treatment effect increases with increasing dose, reaches a plateau and (possibly) decreases again due to possible adverse effects. A simple model that can capture this behavior is a quadratic model, h(d)′ β = β0 + β1 d + β2 d2 . If one allows that the parameter β is not known, the formulas (4.9) and (4.10) for the posterior do not apply anymore here, as they are derived for a completely known prior mean function. I will derive the posterior process for an unknown hyperparameter β in Section 4.2.3. The Covariance Function The covariance function plays a central role in the prior Gaussian process as it determines the prior knowledge on the smoothness. Figure 4.4 illustrates realisations of Gaussian processes with different specification of the covariance function. Typically the covariance function is parameterized by hyperparameters φ that determine the actual smoothness of the result. In Section 4.2.3 I will propose possible choices for the hyperprior distributions for φ. In this section I will concentrate on the form of the covariance function itself rather than its parameters. Upsdell (1996) describes a general strategy to choose a correlation function. Although I will not follow his approach directly I will adopt one of his arguments. In general one would make the following assumptions about the correlation function:
46
4 MODEL-FREE DOSE-RESPONSE ESTIMATION
0.0
high correlation
0.2
0.4
0.6
0.8
1.0
small correlation
0.5
0.0
−0.5
−1.0 0.0
0.2
0.4
0.6
0.8
1.0
Figure 4.4: Realizations of Gaussian processes with mean 0. The covariance function τ 2 exp(−b(x1 − x2 )) is used. τ is set to 0.5 in both plots. For the four realization in the left panel b is set to 1 and for the four realization in the right panel b is set to 25.
(i) R(x1 , x2 ) =: Q∗ (x1 − x2 ) That means the correlation is a function of the difference between the two points x1 and x2 and does not depend on the actual location of x1 and x2 . The inherent assumption is that the amount of smoothness is the same everywhere. Note that this assumption is a comparable to choosing a global bandwidth for local polynomial regression. (ii) Q∗ is a real positive semi definite function This is a necessary assumption, otherwise it cannot be used as a correlation function. (iii) Q∗ is continuous The modelled dose-response curve is assumed to be continuous, hence Q∗ has to be continuous. (iv) Q∗ (∞) = 0 This is a rather technical assumption but intuitively clear. The responses to dose-points with infinite distance would not assumed to be correlated. (v) Q∗ is twice differentiable The dose-response curve is assumed to be smooth (and differentiable), hence Q∗ has to be sufficiently often differentiable.
Any function fulfilling the conditions (i),(ii),(iii) must be the characteristic function of a random
4 MODEL-FREE DOSE-RESPONSE ESTIMATION
47
variable by Bochner’s theorem. If (iv) and (v) are additionally fulfilled the conditions imply that the function is the characteristic function of a continuous random variable, which is symmetric around zero and has finite mean and variance (Upsdell (1996) cites Lukacs (1970) for the results above). For simplicity I will choose the characteristic function of a zero mean Gaussian random variable with variance σ∗2 such that Q∗ (κ) = exp(−
σ∗2 κ2 ), 2
where κ = x1 − x2 . Setting b := σ∗2 /2, the correlation function I will use throughout this thesis is given by R(x1 , x2 ) = exp(−b(x1 − x2 )2 ), and the covariance function by γ(x1 , x2 ) = τ 2 exp(−b(x1 − x2 )2 ). This covariance function is often called Gaussian covariance function, its hyperparameters are φ = (τ, b)′ . Both hyperparameters can be interpreted. The parameter τ 2 describes the variance of the prior Gaussian process. For example, the realizations of the Gaussian process in Figure 4.4 would ‘look’ very similar with a much larger value of the prior variance τ 2 , but the scale on the y-axis would be different, indicating a larger variation around zero. The parameter b determines the correlation ‘within’ the curve. Figure 4.4 was produced using the Gaussian covariance function with the same value for τ but with different values of b: in the left picture b had a much smaller value (thus higher correlation) than in the right picture. Although a non-data based choice of a covariance function does not acknowledge the uncertainty involved, it is a standard approach for Gaussian process regression. Ecker and Gelfand (1997) take a different approach. They review a large number of possible choices for the covariance function and perform a model selection of Gaussian process (data) models with different covariance functions. Although their application is in geostatistics, and hence the purpose of model selection somewhat different than here, this might be a further refinement of the methodology.
4.2.3
Hyperparameters
The mean and the covariance function of the Gaussian process usually depend on hyperparameters β and φ. Typically the knowledge about these parameters is vague and the statistical
4 MODEL-FREE DOSE-RESPONSE ESTIMATION
48
modelling should reflect this uncertainty. Additionally the parameter σ is also unknown. In this section I will first discuss possible choices for the priors of these parameters and then the prior to posterior analysis. Note that formally σ is no hyperparameter, but will be treated in an analogous manner in this section, as the analysis is the same. Choice of Hyperpriors The first step in the analysis is to set up a suitable prior on the hyperparameters and σ. Unfortunately there exists no conjugate prior distribution that would allow analytic calculation of the posterior distribution of these parameters. Therefore alternative choices will be considered here. Typically no prior information exists about the dependence between the different parameters, so it would be somewhat arbitrary to assume a certain dependence structure and I will work with the independence assumption, so p(β, σ, φ) = p(β)p(σ)p(φ). If φ has more than one component (for example, for the Gaussian covariance function φ = (τ, b)′ ), the components are also modelled to be independent a-priori. For the parameter β a multivariate normal prior or a non-informative constant prior can be used. Later in this section it can be seen that the conditioning of the posterior of µ(.) on β can be removed analytically with this choice of the prior. For the parameters σ and φ one can either generalize standard construction principles for noninformative priors (such as Jeffrey’s prior) to our case or use proper hyperprior distributions. Berger, de Oliveira and Sans´ o (2001) investigate the choice of improper hyperprior distributions in a slightly different Gaussian process (data) model, where no sampling variance is present (the final estimate then interpolates the observed data). They report that the choice of improper hyperprior distributions has to be done very carefully as many popular choices lead to an improper posterior distribution. They also investigate how to choose improper non-informative priors, leading to proper posterior distributions. An adaption of these results to our setting might be possible, but is beyond the scope of this thesis, as the posterior propriety would have to be proved. Berger et al. (2001) also recommend not to use proper diffuse priors, as the posterior is quite sensitive to the arbitrary setting of the parameters in the diffuse priors. Instead I chose an approach similar to Ecker and Gelfand (1997), and use proper prior distribu-
4 MODEL-FREE DOSE-RESPONSE ESTIMATION
49
tions representing the information available. Then the posterior of the parameters is guaranteed to be proper, and possible knowledge can carefully be incorporated in the priors. In the dose-response context usually vague prior knowledge about the sampling standard deviation σ is present. As σ is positive its prior distribution should only have positive support. One possible choice is the inverse gamma distribution (see Appendix A.3 for details). A strategy to reflect the vagueness of the prior knowledge, is to set its shape parameter (α) to 1. This results in a distribution with infinite variance. The scale parameter (β) of the inverse gamma distribution can then be found by setting the mode of the distribution to the value which is regarded as being the most probable a-priori. It has to be noted that this prior distribution is vague but not non-informative, even though the variance is infinite. The parameter τ is more difficult to elicitate as it determines the variation around the prior mean function. The quadratic mean function, proposed in Section 4.2.2, will already give a rough approximation of the dose-response curve. Hence τ should not be selected too large. As the prior knowledge is vague, again the inverse gamma distribution with shape parameter equal to 1 seems to be appropriate. The mode of the distribution can be found by setting the mode of the prior distribution of τ to a certain fraction of the difference between expected maximum and placebo effect, for example one third or one quarter, depending on the departure that is expected. One possibility to elicitate the correlation parameter b, is by optical impression. That means plotting realisations of the prior Gaussian process and selecting a distribution that reflects this prior knowledge. Rather than elicitating the parameter b directly I will elicitate the correlation, say ρ, between doses of a certain distance κ in a beta distribution, the first idea to do this goes back to Neuenschwander (2006, personal communication). As the Gaussian correlation function is used, the elicitated beta distribution for the correlation ρ between doses at distance κ, can be transformed in a density function for b (see Appendix A.4 for the derivation). The elicitation of the correlation at a certain distance will be done for three reasons:
• Elicitation of a parameter that is bounded by [0, 1] seems easier than the elicitation of a parameter on the interval [0, ∞]. The elicitated density can, for example, more easily be visualized.
50
4 MODEL-FREE DOSE-RESPONSE ESTIMATION
0.0
rho=0.37, b=25
0.2
0.4
0.6
0.8
1.0
rho=0.45, b=20
rho=0.55, b=15 2 0 −2 −4
rho=0.67, b=10
rho=0.82, b=5
rho=0.96, b=1
2 0 −2 −4 0.0
0.2
0.4
0.6
0.8
1.0
0.0
0.2
0.4
0.6
0.8
1.0
Figure 4.5: Realizations of Gaussian processes with mean function 0. The realizations were shifted so that all have the same starting point 0. The parameter τ was set to 1 and different correlation parameters b were used. rho refers to the correlation between doses with distance 0.2.
• Although the parameter b is a global parameter its elicitation should be done locally. Locally the dose-response curve might strongly depart from the parametric mean function. If the parameter b is chosen too small (implying a large correlation), the posterior process will not be able to adapt to this. • If the elicitation is already done for a certain dose-range and the prior assumptions for a different compound are the same, then the already elicitated beta distribution can be used. Through the parameter κ the transformed beta distribution can be adapted to the new dose-range.
The easiest way to describe the process of elicitation is to consider an example. The elicitation of b will be illustrated for the IBS dose-finding data set. The first step for elicitation is the selection of a suitable distance κ. This should not be chosen too large, for example a value of 1/5 of the dose-range seems appropriate. Therefore, for the IBS example the value 0.2 is used for κ. Figure 4.5 shows samples from a zero mean Gaussian process for different values of b, the figure also depicts the correlation ρ between doses with distance 0.2. The focus is
51
4 MODEL-FREE DOSE-RESPONSE ESTIMATION
(ii)
density 0.03 0
0
density 1
2
0.06
(i)
0.0
0.2 0.4 0.6 0.8 1.0 correlation at distance 0.2
0
10
20
30
40
50
b
Figure 4.6: (i) Elicitated Beta(5.68, 3.56) distribution for the correlation. (ii) Transformed prior distribution for b.
now on observing the variation of the process within the distance 0.2. This should match the prior assumptions on the possible departures from the parametric mean. For the correlation of 0.37 it can be seen in Figure 4.5 that at the distance 0.2 sharp departures are possible, but a much smaller correlation would lead to departures that might be too complex. For a correlation larger than 0.82 strong departures from the parametric mean function at distance 0.2 are not really possible. As typically one would not expect that the parametric mean model is true this might be an upper bound for the correlation. So these values might be used as ‘soft’ bounds for the elicitated correlation. The term ‘soft’ is used, as typically there is no certainty whether the correlation is larger than ≈ 0.85 or smaller than ≈ 0.35. So the beta distribution can be chosen such that the 0.05-quantile is 0.35 and the 0.95-quantile is 0.85. Numerically solving to find the parameters of the beta distribution fulfilling this condition gives a Beta(5.68, 3.56) distribution. Hence the prior density for b in this example is given by p(b) =
Γ(9.24) exp(−0.22 b)5.68 (1 − exp(−0.22 b))3.56−1 0.22 . Γ(5.68)Γ(3.56)
Figure 4.6 displays the elicitated B(5.68, 3.56) distribution and the elicitated TB(5, 68, 3.56, 0.2) distribution for p(b). It has to be noted that in general prior densities elicitated in this way for b are rather informative, depending on the variability of the elicitated beta distribution. Certainly the methods for elicitation of the hyperprior distributions described here are rather ad hoc. In a practical application the elicitation should be done with considerable care. O’Hagan and Forster (2004, Chapter 6) describe refined methods for prior elicitation. Two important aspects in prior elicitation that would be helpful in our setting are overfitting and feedback.
4 MODEL-FREE DOSE-RESPONSE ESTIMATION
52
Overfitting means specifying further properties for the prior distribution and comparing whether the elicitated prior distribution has these properties. Feedback means calculating further summaries (like quantiles or moments) of the elicitated prior distribution and comparing, whether these coincide with the prior knowledge. More methods for elicitation for Gaussian process priors can be found in Oakley (2002), although his elicitation process applies only in part to our setting. Prior to Posterior Analysis for the Hyperparameters In Section 4.2.1 the prior to posterior analysis for the Gaussian process has been performed based on the assumption that β, φ and σ are known. In this section it will be investigated how this conditioning can be removed. First the parameter β is considered. Suppose a linear model is used as the prior mean function: m(x) = h(x)′ β. The parameters σ and φ are assumed to be fixed and known. Using a multivariate normal prior for β, O’Hagan and Forster (2004, p. 395–396) derive the mean and covariance function of the posterior Gaussian process. They also describe the practically relevant case when the prior knowledge on the parameter β is weak. This can be represented by letting the inverse of the covariance matrix (of the multivariate normal prior for β) be equal to a matrix of zeros. Then the prior for β is constant and thus improper. In this case the posterior is again a Gaussian process with posterior mean function given by ˆ + γ ′ (x)W −1 (¯ ˆ m∗∗ (x) = h(x)′ β y − H ′ β),
(4.11)
ˆ = [HW −1 H ′ ]−1 HW −1 y ¯ is the usual generalized least squares where W = Γ + σ 2 S and β estimator. The matrix H ′ = (h(d1 ), . . . , h(dk ))′ is the design matrix. It thus becomes obvious that the posterior mean function is a compromise between the linear parametric model (induced by the prior mean function) and a term that depends on the residuals and ‘corrects’ the parametric model fit. The covariance function is given by (O’Hagan and Forster 2004, p. 401) γ ∗∗ (x, x′ ) = γ(x, x′ ) − γ ′ (x)W −1 γ(x′ ) +
(4.12)
+ [h(x) − HW −1 γ(x)]′ [HW −1 H ′ ]−1 [h(x′ ) − HW −1 γ(x′ )]. This result is not anymore conditional on β. Nevertheless the conditioning on σ and φ is not removed. Unfortunately it seems analytically intractable to do this and has to be done by simulation. Therefore we need, at least up to proportionality the posterior of these parameters.
4 MODEL-FREE DOSE-RESPONSE ESTIMATION
53
The posterior of the parameters β, σ, φ is proportional to p(β, σ, φ|¯ y ) ∝ p(¯ y |β, σ, φ)p(β, σ, φ), where the likelihood p(¯ y |β, σ, φ) is given as 1 1 p(¯ y |β, σ, φ) ∝ det(W )− 2 exp(− (¯ y − H ′ β)′ W −1 (¯ y − H ′ β)). 2
We are only interested in the posterior of σ, φ as the dependence of β on the posterior process has already been removed analytically. Hence p(β, σ, φ|¯ y ) has to be integrated over β to obtain p(σ, φ|¯ y ). Before considering this integration a useful expansion is established: ′ˆ ′ˆ ˆ ˆ (¯ y −H ′ β)′ W −1 (¯ y −H ′ β) can be written as (¯ y −H ′ β+H β−H ′ β)′ W −1 (¯ y −H ′ β+H β−H ′ β),
ˆ = (HW −1 H ′ )−1 HW −1 y ¯ . Multiplying out and observing that the mixed terms are where β
equal to zero one arrives at the result ˆ ′ (HW −1 H ′ )(β − β) ˆ + (¯ ˆ ′ W −1 (¯ ˆ (¯ y − H ′ β)′ W −1 (¯ y − H ′ β) = (β − β) y − H ′ β) y − H ′ β). Returning to our problem, we want to solve the integral (setting p(β) = 1) Z 1 1 p(φ, σ|¯ y ) ∝ det(W )− 2 exp(− (¯ y − H ′ β)′ W −1 (¯ y − H ′ β))p(σ)p(φ)dβ. 2 Now using the above expansion and writing everything outside the integral that does not depend on β one arrives at: 1
ˆ ′ W −1 (¯ ˆ y − H ′ β) y − H ′ β))p(σ)p(φ)× p(φ, σ|¯ y ) ∝ det(W )− 2 exp(− 21 (¯ R ˆ ′ (HW −1 H ′ )(β − β))dβ. ˆ × exp(− 12 (β − β)
The remaining integrand is now the kernel of a multivariate normal density, which yields the normalizing constants. Hence, 1 1 ˆ ′ W −1 (¯ ˆ det(HW −1 H ′ )− 12 p(σ)p(φ). p(φ, σ|¯ y ) ∝ det(W )− 2 exp(− (¯ y − H ′ β) y − H ′ β)) 2
This is the posterior of φ and σ up to proportionality and the target function for simulation based inference.
4 MODEL-FREE DOSE-RESPONSE ESTIMATION
4.2.4
54
Computational Issues
In this section computational techniques will be described to derive the posterior distribution of µ(.) unconditional on the hyperparameters and σ. Denote these parameters as ξ := (φ′ , σ)′ . From the last section it is known that the posterior distribution of µ = (µ(x1 ), ..., µ(xl ))′ , xi ∈ [d1 , dk ], l ∈ N given ξ is multivariate normal. Mean and covariance can be obtained by equations (4.11) and (4.12). Denote the density of µ as p(µ|¯ y , ξ). To calculate p(µ|¯ y ), one needs to solve the integral p(µ|¯ y) =
Z
p(µ|¯ y , ξ)p(ξ|¯ y )dξ.
(4.13)
As described above an exact marginalization is analytically not tractable. In this chapter I will describe two computational methods to solve this problem. The first method is Markov Chain Monte Carlo (MCMC) (see Chapter 10 of O’Hagan and Forster (2004)). MCMC methods construct an ergodic Markov Chain, which has the desired posterior distribution as stationary distribution. After sufficiently many iterations, say t∗ , the realisations ξ(t) of this Markov Chain can be viewed as a sample of this posterior. Having obtained a sample ξ (t) , t = t∗ , . . . , T , Monte Carlo integration can be used to solve integral (4.13) p(µ|¯ y) ≈
T 1 X p(µ|¯ y , ξ(t) ). T − t∗ t=t∗
So the unconditional posterior of µ can be approximated by a mixture of multivariate normal distributions. In the next section I will briefly present an MCMC algorithm to analyze the IBS data set in a fully Bayesian analysis. A drawback of such methods is the computational complexity. Another approach is maximization of the posterior distribution of ξ. The obtained values ξ max are then treated as if known and plugged into the formulas (4.11) and (4.12). So we have the approximation p(µ|¯ y ) ≈ p(µ|¯ y , ξ max ) In contrast to the Monte Carlo approach, this approximation can give poor results, especially if the posterior of ξ is not concentrated around its mode. Nevertheless it is often used in the practical application of these type of models as this approach is computationally cheaper, see for example Upsdell (1996) or Buck, Aguilar, Litton and O’Hagan (2006). A severe drawback is the fact that the variability of the parameters ξ is ignored in subsequent inference on the
4 MODEL-FREE DOSE-RESPONSE ESTIMATION
55
dose-response curve and the target dose. For the purpose of the simulation study I will use a variant of this approach.
4.2.5
Issues in Dose-Response Modelling
Three issues are especially important in dose-response modelling: the assessment of the treatment effect, the estimation of the dose-response curve, and the estimation of the target dose. One possibility to assess the treatment effect with Gaussian process regression are model-free contrasts. Suppose M contrasts are given. The dose-response effect can now be assessed by calculating the probability that any contrast, multiplied with µ = (µ(d1 ), . . . , µ(dk ))′ , is larger than zero. So the following probability is of interest P (c′m µ > 0, for at least one m ∈ {1, . . . , M }). The complementary event is that none of the c′m µ is larger than zero. So the probability above is equal to 1 − P (c′1 µ ≤ 0, . . . , c′M µ ≤ 0). If ξ is assumed to be known (and set to a fixed value) µ has a multivariate normal distribution, and the probability is easily calculated with the mvtnorm package. If ξ is unknown, simulation techniques have to be applied. The dose-response curve can be estimated by the posterior mean function or the posterior median function. If the posterior is a Gaussian Process both approaches coincide. The estimation of the target dose d∗ could be done by estimation of the dose-response curve and then plugging in the estimate µ ˆ(.) in the formula for the target dose (equation (1.2)). This estimator would not have desirable properties from a Bayesian viewpoint as it discards information. From the Bayesian viewpoint d∗ is a non-linear functional of the posterior process. Hence d∗ also has a distribution induced by the posterior process. Unfortunately the distribution is not available analytically and must be obtained by Monte Carlo methods: the posterior process needs to be simulated and in each run d∗ calculated. The so formed distribution gives a Monte Carlo approximation of the distribution of d∗ . A suitable estimator of the target dose would then be a location summary of this distribution (for example the mean, the median or the mode).
5 ANALYSIS OF THE DOSE-FINDING EXAMPLE
Contrast µ(d1 ) − µ(d4 ) µ(d1 ) − µ(d5 ) µ(d1 ) − µ(d3 ) µ(d1 ) − µ(d2 )
T -Statistic 2.749 2.736 2.351 2.275
56
mult. adj. p-Value 0.011 0.012 0.032 0.039
Table 5.1: Dunnett contrast test statistics and multiplicity adjusted p-values
5
Analysis of the Dose-Finding Example
In this section I will illustrate the presented techniques with the IBS data set introduced in Section 1.4. The source code that has been used to analyze the data set, can be found in the Appendix C.2.1. The clinical relevance threshold ∆ is set to 0.25 and the level of significance α is chosen to be 0.05 (one-sided) for all tests to be performed in this section.
5.1
Dunnett
The first approach to be illustrated is the Dunnett test from Section 2.2. A maximum contrast test is applied with the Dunnett contrasts described in Section 2.2. Calculation of the critical value q0.95 yields 2.164. In Table 5.1 it can be seen that the maximum contrast test statistic is 2.749 and hence larger than the critical value. Thus a dose-response effect can be established at level 0.05. Furthermore all contrasts are statistically significant at FWER 0.05. The target dose as defined in equation (1.2) can be estimated as the smallest of the doses di that has an effect that is significantly different from the placebo effect and for which y¯i. > y¯1. + 0.25. So this dose estimator can only take values in the set of administered doses. The vector of group means is given by: (¯ y1 , . . . , y¯5 )′ = (0.217, 0.502, 0.514, 0.568, 0.565)′ . The smallest dose with a significant response being larger than y¯1 + 0.25 is the dose 0.05, which is hence the target dose estimate. A simple (model-free) method to estimate the dose-response relationship is linear interpolation of the observed group means. Figure 5.1 displays the obtained estimate of the dose-response profile.
5.2
Model-Based Approaches
Next the combination of contrast tests and regression modelling, introduced in section 3.2, will be used to analyze the IBS data set. First the dose-response effect is assessed with a maximum
57
5 ANALYSIS OF THE DOSE-FINDING EXAMPLE
0.0
LinInt
0.2
0.4
0.6
0.8
1.0
CT/SIC
0.6
0.4
Response
0.2
CT−MA
SIC−MA
0.6
0.4
0.2
0.0
0.2
0.4
0.6
0.8
1.0
Dose
Figure 5.1: Dose-response curve estimates for linear interpolation and the model-based approaches. The dots (•) denote the group means.
contrast test, then the test is used to select the significant contrasts controlling the FWER. Four methods will be used to obtain one model or a combination of models out of the set of significant models:
(i) Selection of one model determined by the largest contrast test statistic (CT). (ii) Model averaging with weights determined by the bootstrap probability that the corresponding contrast test statistic is the maximum contrast test statistic (CT-MA). (iii) Selection of one model with the SIC (SIC). (iv) Model averaging with weights determined by the SIC (SIC-MA).
The set of candidate models (and therefore also the contrast test and the set of significant models) will be the same for all methods. So at first a suitable set of models and guesstimates for the shape parameters needs to be selected. As only five doses are used, problems could arise for non-linear models with many parameters. Hence only non-linear models with a maximum of three parameters are chosen. To be able to cover a broad shape space (linear, convex, concave,
58
5 ANALYSIS OF THE DOSE-FINDING EXAMPLE
(iii) exponential model
0.0
0.2
0.4 0.6 Dose
0.8
1.0
1.0 Response 0.5 0.0
1.0
0.2
0.4 0.6 Dose
0.8
1.0
0.0
0.2
0.4 0.6 Dose
0.8
1.0
(v) cubic model
1.0
(iv) quadratic model
0.0
Response 0.5 0.0
0.0
Response 0.5
1.0
(ii) linear model
1.0
(i) emax model
Response 0.5
(iii) : θ(2expo) = 0.5 (iv) : (θ01, θ02) = (2.66, − 1.86) (v) : (θ01, θ02, θ03)
0.0
0.2
0.4 0.6 Dose
0.8
1.0
=
(− 0.43, 4.3, − 2.9)
0.0
0.0
Response 0.5
(i) : θ(2Emax) = 0.2
0.0
0.2
0.4 0.6 Dose
0.8
1.0
Figure 5.2: Candidate models with associated guesstimates
umbrella and sigmoid) the linear, the exponential, the Emax, the quadratic and the cubic model are chosen. The guesstimates for the shape parameters are selected informally to represent the mentioned shape space. Figure 5.2 displays the model shapes included in the candidate set and corresponding guesstimates. The optimal contrasts can be obtained from the model shapes using equation (2.4). Table 5.2 gives the optimal contrasts (calculated to have unit euclidean length) and the correlations between the contrasts (calculated with equation (2.1)). It becomes obvious that the contrasts are highly correlated, which is reasonable as all correspond to monotone or unimodal shapes. The largest correlation occurs between the cubic and the linear model contrast, the smallest correlation between the exponential and the quadratic model contrast. The critical value for the maximum contrast test statistic is 1.930.
Model Emax Linear Expon. Quadratic Cubic
Contrast coefficients for dose 0 0.05 0.2 0.6 1 -0.626 -0.385 0.065 0.411 0.535 -0.418 -0.397 -0.200 0.271 0.744 -0.329 -0.341 -0.255 0.087 0.838 -0.553 -0.437 -0.002 0.570 0.422 -0.354 -0.402 -0.304 0.359 0.701
Linear 0.911
Correlations with Expon. Quadratic 0.805 0.975 0.971 0.873 0.733
Cubic 0.880 0.988 0.950 0.873
Table 5.2: Optimal contrasts and contrast correlations for the model-based approach
59
5 ANALYSIS OF THE DOSE-FINDING EXAMPLE
Contrast Emax Quadratic Linear Cubic Expon.
T -Statistic 2.683 2.482 2.039 1.857 1.678
mult. adj. p-Value 0.008 0.013 0.039 0.058 0.083
SIC 866.1 870.2 866.4 -
SIC-Weights 0.505 0.064 0.431 -
CT-Weights 0.759 0.181 0.060 -
Table 5.3: Overview of the multiple contrast test and the model selection/averaging step In Table 5.3 it can be seen that the Emax model has the maximum contrast test statistic, which is larger than the critical value. Thus a dose-response effect can be established. Also the quadratic and the linear model have contrast test statistics larger than the critical value. Hence these models are chosen for subsequent inference. First model selection is considered. It can be seen in Table 5.3 that both model selection criteria select the Emax model; it has the smallest SIC value and the largest test statistic (see Appendix C.1 for a remark regarding the calculation of the SIC in R). The model weights determined by the SIC and the contrast approach, calculated as described in Section 3.3, are displayed as well. Both approaches give most weight to the Emax model. The SIC gives the second highest weight to the linear model, while the contrast approach favors the quadratic model. The quadratic model shape is visually more similar to the observed sequence of group means, but the quadratic model receives a higher penalty in the SIC, due to one additional parameter. This illustrates a fundamental difference between both approaches: the SIC selects the model that has the best trade-off between model fit and number of parameters. The contrast approach selects the shape from the candidate set that is most similar to the observed sequence of group means. Figure 5.1 gives an optical impression of the fitted Emax model and the averaged model fits. The fit based on model selection is relatively similar to the fit obtained by model averaging with the contrast approach. The model averaged curve based on the SIC looks quite different as the linear model and the Emax model receive roughly the same weight. The target dose estimate using the Emax model alone is 0.03. For model averaging the target dose estimate is the weighted average of the target dose estimates from the different models. Unfortunately this estimator does not exist, as no target dose estimate can be determined for the linear model in the dose-range. A way out is to use just the Emax and quadratic model and adjust the probabilities. For example the weight for the Emax model is then given by 0.505/(0.505+0.064) in the SIC approach and by 0.759/(0.759+0.181) in the CT approach. Using these weights one obtains a model averaged target dose estimate of 0.08 for model averaging with the SIC and 0.12 for the contrast approach.
60
5 ANALYSIS OF THE DOSE-FINDING EXAMPLE
Shape Concave Convex Sigmoid Linear Umbrella
Contrast coefficients for dose 0 0.05 0.2 0.6 1 -0.570 -0.454 0.059 0.479 0.486 -0.215 -0.236 -0.227 -0.218 0.894 -0.343 -0.377 -0.363 0.439 0.645 -0.418 -0.397 -0.200 0.271 0.744 -0.473 -0.409 -0.073 0.749 0.206
Conv. 0.543
Correlations with Sigm. Lin. 0.871 0.898 0.722 0.833 0.965
Umb. 0.910 0.229 0.805 0.729
T -Statistic 2.525 1.127 1.832 2.039 2.195
Table 5.4: Contrast coefficients, contrast correlations and contrast test statistics for the modelfree contrasts
5.3 5.3.1
Model-Free Approaches Local Regression
For local polynomial regression two methods will be evaluated: local linear and local quadratic regression (subsequently abbreviated LocLin and LocQuad). For both methods a model-free maximum contrast test as described in Section 2.4 will be applied to test for a dose-response effect. The contrasts are calculated corresponding to the shapes in Figure 2.1 with formula (2.4). These contrasts cover a broad shape of potential dose-response profiles, namely concave, convex, linear, umbrella and sigmoid alternatives (like for the model-based approaches). The optimal contrasts (standardized to have euclidean length 1) and their correlations are shown in Table 5.4. The largest correlation occurs between the linear and the sigmoid shape, and the smallest correlation between the convex and the umbrella contrast. The correlation pattern is very similar to the correlation pattern of the model-based contrasts, but here the correlations are generally smaller. This is reflected in the calculated critical value, which is 2.056, and so larger than for the model-based contrasts. The contrast test statistics are displayed in Table 5.4. As the maximum of the test statistics is larger than the critical value a dose-response effect can be established. For both local linear and local quadratic the Gaussian weight function is used and a global bandwidth is determined by minimizing the GCV score based on the original data. It has to be noted that the locfit package minimizes an approximated GCV score, see Loader (1999, Chapter 12) for details. For both approaches the bandwidth is found as approximately 0.63. The result of fitting the local polynomials to the data can be observed in Figure 5.3. It becomes obvious that the local linear model fits the data quite poorly, whereas the local quadratic fit looks more reasonable. Both fits differ from the fitted curves for the model-based methods, which (apart from the SIC approach)
61
5 ANALYSIS OF THE DOSE-FINDING EXAMPLE
0.0
LocLin
0.2
0.4
0.6
0.8
1.0
LocQuad
Response
0.6
0.4
0.2
0.0
0.2
0.4
0.6
0.8
1.0
Dose
Figure 5.3: Model fits for model-free approaches. The dots (•) denote the group means.
‘follow’ the group means more closely. The target dose estimate for the local linear model does not exist. For local quadratic regression the target dose estimate is 0.30, which is relatively large compared to the model-based approaches.
5.3.2
Gaussian Process Regression
In this section Gaussian process regression will be illustrated. Table 5.5 shows the specification for the prior and hyperprior distributions. The prior mean and covariance function are chosen as proposed in Section 4.2.2 and the hyperprior distribution for b is chosen exactly as illustrated in the elicitation process in Section 4.2.3. A rough guess for the elicitation of τ is to set the mode of the prior distribution of τ to around 1/3 of the expected difference between placebo and maximum effect. Guessing the maximum effect as 0.65 and the placebo effect as 0.2, one obtains 0.15. To acknowledge the uncertainty in the prior distribution the shape parameter is chosen as one, implying an infinite variance. The prior distribution for σ is also chosen as an Mean Fct. Covariance Fct. β τ b σ
β0 + β1 d + β2 d2 τ 2 exp(−b(d1 − d2 )2 ) ∝1 IG(1, 0.3) TB(5.68, 3.56, 0.2) IG(1, 1.4)
Table 5.5: Prior mean and covariance function and hyperprior distributions for the analysis of the IBS data set using Gaussian process regression.
5 ANALYSIS OF THE DOSE-FINDING EXAMPLE
62
(1) Draw a candidate ξ∗ = (τ, b, σ)′∗ from q(ξ) = q(τ, b, σ) (2) Calculate r(ξ ∗ ) =
π(ξ ∗ ) q(ξ (i−1) ) ∗ π(ξ (i−1) ) q(ξ )
(3) Draw a random number u from the uniform distribution on [0,1] If u < min(r(ξ ∗ ), 1) set ξ (i) = ξ∗ else set ξ (i) = ξ(i−1) Figure 5.4: Overview of the i th iteration of an independence sampler, with fixed proposal distribution q(τ, b, σ). inverse gamma distribution with shape parameter equal to one, but now with the mode 0.7. For the parameter β a non-informative, constant prior is used. The dose-response effect is assessed, as described in Section 4.2.5 using the same model-free contrasts as for local polynomials. A fully Bayesian analysis will be conducted using an MCMC approach. First random values of the posterior distribution of τ, b, σ have to be simulated. In Section 4.2.3 the posterior of τ, b, σ has been obtained up to proportionality. Denote this function as π(.). A typical approach to sample from densities with unknown normalization constant is the MetropolisHastings algorithm (O’Hagan and Forster 2004, pp. 266–267). Here the independence sampler, a special case of the Metropolis-Hastings algorithm is used. The name independence sampler stems from the fact that the proposals are generated independently of the past realizations of the chain. Figure 5.4 describes the algorithm. The performance of the independence sampler depends on the proposal distribution q(.). Similar to importance sampling the proposal density q(.) should mimic the target posterior as closely as possible. However, O’Hagan and Forster (2004, p. 270) describe that the constructed Markov Chain is uniformly ergodic (the chain will produce a sample of the desired posterior), if the ratio π(ξ)/q(ξ) is bounded. This means that the proposal distribution should ideally have heavy tails. In our case it seems to be sufficient to choose the prior distributions as proposal distributions, because the priors for τ and σ have infinite variance. It has to be noted that the independence sampler with the chosen proposal distribution is not the most efficient MCMC sampling algorithm. Possibilities to make the method more efficient are, for example, componentwise updates or an adaptive choice of the proposal density. For the IBS example 101,000 iterations were carried out with the independence sampler. The acceptance probability was 47.6%, which is relatively high, considering the heavy tailed pro-
63
5 ANALYSIS OF THE DOSE-FINDING EXAMPLE
(ii)
(iii)
0.0
0.00
0.5
0.02
density 1.0 1.5
density 0.04
2.0
density 0.0 0.1 0.2 0.3 0.4 0.5 0.6
0.06
2.5
(i)
2
3
4
5
0
10
20
30
40
5
10
15
b
σ
(iv)
(v)
(vi)
20 τ
30
25
25 0
5
10
σ 15
20 σ 15 10 5 0 10
20
20
25
50 40 b 30 20 10 0 0
0
τ
30
1
30
0
0
10
20
30 b
40
50
0
10
20
30
τ
Figure 5.5: (i)-(iii) Solid lines: kernel density estimates from the MCMC output for the parameters τ , b and σ. Dashed lines: prior distributions for τ , b and σ. (iv)-(vi) MCMC iterations of τ , b and σ plotted against each other.
posal distributions. Before starting to analyze the MCMC output it is important to judge the convergence of the chain. In Appendix A.5, Figure A.1 the first 5,000 iterations are displayed. The chain mixes quickly and it seems that it has reached the stationary distribution early. This might be due to the fact that the starting values were chosen well. Nevertheless the first 1,000 iterations are removed for subsequent inference. In Figure A.2 it can be seen that there are autocorrelations in the chain, up to at least lag 5. To reduce autocorrelation within the chain only every fifth value is used. The remaining 20,000 iterations are used for subsequent inference. To visualize the posterior, kernel density estimates of τ , b and σ are displayed in Figure 5.5 (i)-(iii). The plots are produced with the density function from R using the default parameter for bandwidth selection. It can be seen that the posterior densities for τ and σ are more peaked in comparison to the heavy tailed priors. For the parameter b the situation is different, here the posterior is almost equal to the prior distribution. This indicates that the (integrated) likelihood is very flat in the direction of the parameter b. Table 5.6 displays the 0.05, 0.5 and 0.95 quantile for the prior and posterior distributions of the parameters. The posterior quantiles were estimated from the MCMC output, the prior quantiles were calculated from the prior distribution with numerical integration. These results further establish the tendency observed
64
5 ANALYSIS OF THE DOSE-FINDING EXAMPLE
τ prior τ posterior b prior b posterior σ prior σ posterior
0.05 0.100 0.085 4.063 3.600 0.467 0.577
Quantile 0.5 0.432 0.273 11.818 11.233 2.020 1.342
0.95 5.849 1.277 26.261 25.420 27.294 4.159
Table 5.6: Prior and posterior quantiles for the parameters τ, b and σ in the density plots. In Figure 5.5 (iv)-(vi) the components of ξ for the MCMC iterations are plotted against each other to visualize the dependence between the different parameters in the joint posterior distribution. It can be observed that there is a slight dependence between the parameters. All parameters seem to be negatively correlated, i.e., if one parameter gets large the other tends to be smaller. Having obtained a sample of the posterior of the parameters ξ, the main interest is now in the posterior process of the dose-response curve. As there is no closed formula for the posterior process, a sample of the posterior process will be generated. Each realization of the posterior of ξ is once plugged into the formula of posterior Gaussian process, conditional on the ξ (see equations (4.11) and (4.12)) and one curve is generated. The obtained sample can be viewed as a sample from the unconditional posterior distribution (see Section 4.2.4). It has to be noted that simulating a Gaussian process directly is not possible as it is infinite-dimensional. Instead random values will be drawn on a grid of 101 equally spaced points in the dose-range [0, 1]. Sampling from 101-dimensional multivariate normal distributions gives thus a random sample of the posterior distribution of the dose-response curve (evaluated at the grid). All quantities of interest can be estimated from this sample. To establish a dose-response effect the model-free contrasts as described for the local polynomials will be used. The dose-response effect can be assessed by calculating the probability that any of the contrasts, multiplied with the vector µ = (µ(0), µ(0.05), µ(0.2), µ(0.6), µ(1))′ is larger than zero. This is achieved by using the sample from the posterior process. For each realization of µ we calculate whether any of the contrasts multiplied with the realization of µ is larger than zero. This is repeated for all realizations of µ and gives a Monte Carlo estimate of the associated probabilities. In our example the Monte Carlo estimate of the probability is 0.946. This probability is relatively large and shows that there is good evidence for a treatment effect.
65
1.5
5 ANALYSIS OF THE DOSE-FINDING EXAMPLE
0.5 0.0
Response
1.0
Median 0.2 / 0.8 Quantile 0.025 / 0.975 Quantile
0.0
0.2
0.4
0.6
0.8
1.0
Dose
Figure 5.6: Pointwise quantiles for the posterior process for the IBS data
From the perspective of classical statistics, a threshold value would be desirable that would ensure that the procedure holds a frequentist significance level. In this example this could, in principle, be achieved by permutation methods. In this approach the labels of the dose-groups would be permuted and the probability from above in each run calculated. A quantile of this set of probabilities can be used as critical value. Note that this approach would be computationally very demanding. Figure 5.6 illustrates the random samples from the posterior process for the dose-response curve. The lines illustrate the pointwise quantiles of the process at the 101 values between 0 and 1. The uncertainty in the process, due to sparse data in the intervals [0.2, 0.6] and [0.6, 1], is reflected in a larger variance of the posterior process in these intervals. It is interesting to note that the posterior median, which might be used as an estimate for the dose-response curve, is very similar to the local quadratic estimate (see Figure 5.3). In a fully Bayesian approach the target dose d∗ , defined in equation (1.2), also has a distribution induced by the posterior distribution of the dose-response curve. We already obtained a sample from the posterior process, so a Monte Carlo sample from the distribution of d∗ can be obtained by calculating the target dose for all realisations of the posterior process. In 3,375 of the 20,000 realisations (≈ 17%) no target dose could be identified in the dose range. Figure 5.7 shows a
66
2.0 1.5 0.5
1.0
density
2.5
3.0
5 ANALYSIS OF THE DOSE-FINDING EXAMPLE
0.0
0.2
0.4
0.6
0.8
1.0
d*
Figure 5.7: Kernel density estimate of the density of the target dose d∗
kernel density estimate of d∗ of the remaining values. The estimate is obtained by applying the density function and the default argument for bandwidth selection. To obtain an estimate for d∗ , a location summary such as the mean, the median or the mode of the distribution of d∗ can be used. The Monte Carlo estimate of the mean is 0.294, the estimate of the median is 0.200, the mode of the density is approximately equal to 0.12. There is also another approach to estimate the target dose. Equation (1.2) for the target dose can also be used directly, by replacing µ(.) with an estimate µ ˆ(.). Using the median of the posterior process as an estimate for the dose-response curve, gives a target dose estimate of 0.41. This differs considerably from the estimate obtained by using a location summary of the distribution of d∗ . For this example the estimator based on a location summary of the distribution of the target dose seems more reasonable.
6 PHRMA SIMULATION STUDY
6
67
PhRMA Simulation Study
As mentioned in Section 1.2 one major aim of the Rolling Dose Project is an evaluation of different methods for dose-response modelling in realistic scenarios. A simulation study, motivated by a real dose-finding application and covering a wide range of practical scenarios, is undertaken by the PhRMA group for this purpose. This simulation scenario will also be used to evaluate the methods described in this thesis. In this section I will describe the design of this simulation study, the performance measures used to evaluate the methods, and how the various methods described in this thesis are implemented in the simulation study. Finally I will summarize the main results. For more details on the PhRMA Rolling Dose Project see (PhRMA working group on Adaptive Dose Ranging 2006).
6.1
Test Setting
The simulation study is motivated by the scenario of a neuropathic pain dose-finding study. The primary endpoint is the change from baseline at 6 weeks in a visual analog scale of pain. For the purpose of the simulation, it is assumed to be normally distributed with variance σ 2 = 4.5 in all dose groups, see (PhRMA working group on Adaptive Dose Ranging 2006) for more details. The clinically relevant effect ∆ is set to 1.3. In total, 30 different scenarios are considered in the simulation study, corresponding to different combinations of dose designs, total sample size, and dose-response profiles. For each scenario 10,000 trials are simulated. The level of significance for the tests is chosen as 0.05 (one-sided). In the following I will describe the different scenarios. Dose Design Scenarios and Sample Sizes For the purpose of the simulation study it is assumed that nine different dose levels are available from the drug supply department: 0, 1, 2, 3, 4, 5, 6, 7 and 8. Three different dose designs are considered, to evaluate the impact of the number and the spacing of the dose levels:
• Five equally spaced doses: 0, 2, 4, 6, 8 • Seven unequally spaced doses: 0, 2, 3, 4, 5, 6, 8 • Nine equally spaced doses: 0, 1, 2, 3, 4, 5, 6, 7, 8. An interesting side-effect of the simulation study will be, whether it pays off to distribute the
68
6 PHRMA SIMULATION STUDY
0
emax
2
4
6
8
linear 1.5 1.0
Response
0.5 0.0
logistic
umbrella
1.5 1.0 0.5 0.0 0
2
4
6
8
Dose
Figure 6.1: Dose-response models used in the PhRMA simulations.
patients to a larger number of dose levels (which would mean a larger logistical challenge) or if it is sufficient to use a small number of doses. Two total sample sizes are used in the simulations: 150 and 250 patients. These values are consistent with sample sizes commonly used in Phase II trials. If possible, the total sample size is allocated to the different treatments such that the sample sizes are the same for all groups. Otherwise the group sample sizes are chosen as balanced as possible. Dose Response Profiles A total of four different dose-response profiles is used to simulate the primary endpoint, allowing the evaluation of the methods under a wide range of realistic scenarios. The dose-response profiles under investigation include the Emax, the linear, the logistic and the umbrella (i.e., the quadratic) model, see Table 6.1 for the parameterizations and Figure 6.1 for a graphical illustration. A flat model was also included to evaluate the type I error rate. The placebo effect was set to 0 for all models. The maximum effect within the observed dose range is set to 1.65 points, with the exception of the logistic model, where the maximum effect is 1.7. Note that in the original simulation study, smaller values of the primary endpoint correspond to a beneficial effect. As in this thesis a beneficial effect is always associated with a larger value of the endpoint I work with the reparameterization µ(d) := −µ∗ (d), where µ∗ (d) is the dose-response model described in the original setting. This does not affect the results.
69
6 PHRMA SIMULATION STUDY Model Flat Logistic Umbrella Linear Emax
µ(d) 0 −0.015 + 1.73/(1 + exp[1.2(4 − d)]) (1.65/3)d − (1.65/36)d2 (1.65/8)d 1.81d/(0.79 + d)
Target Dose 4.96 (5) 3.24 (3) 6.30 (6) 2
Table 6.1: Model Functions and true target doses Performance Measures The PhRMA project uses, amongst others, the following performance measure to assess the quality of the different methods:
• The probability to detect a dose-response effect. • The accuracy in estimation of the dose-response curve evaluated at the doses that can be produced, APE = 1/9
8 X d=0
E(|ˆ µ(d) − µ(d)|).
(6.1)
To make the measure interpretable as a percentage it is divided by the target effect 1.3 and multiplied with 100: 100APE/1.3. • The quantiles of the predictions at the doses 0, 1, 2, . . . , 8 will be graphically displayed. • The probability that a clinically relevant response can be obtained within the dose range. If a method is able to identify a dose-response effect, it is not always able to determine a target dose, as the target dose estimator does not need to exist. • The accuracy of dose estimation is assessed with two measures: relative bias : 100(E(dˆ∗ ) − d∗ )/d∗
(6.2)
relative absolute error : 100E(|dˆ∗ − d∗ |)/d∗ .
(6.3)
The first measures the bias of the dose estimate, the second gives an overall impression of the expected distance of the dose estimate from the true target dose d∗ (see Table 6.1 for the true target doses). To make the measures interpretable as percentages they are divided by the true target dose and multiplied with 100. As only nine doses are available from the production the dose estimates of the different methods are rounded to the nearest integer for all methods evaluated. Also the true target dose is rounded to the nearest integer.
6 PHRMA SIMULATION STUDY
70
To evaluate interactions between the testing and estimation part of the methods, the simulation study is conducted as a clinical trial in practice: the dose-response profile and the target dose will only be estimated if a dose-response effect can be established.
6.2
Description of Methods
The methods applied in the simulation study are described below. Source code to implement the following methods can be found in Appendix C.2.2. Dunnett The Dunnett approach from Section 2.2 is used to obtain a benchmark value for the new approaches. It is employed as in Section 5: the Dunnett test is used to test for a dose response relationship. If a dose-response effect can be established, the target dose is estimated as the smallest dose that has a response significantly different from placebo and for which the associated group mean is larger than y¯1. + 1.3. Thus the target dose estimator can only take values in the set of administered doses d1 , . . . , dk . The dose-response relationship is estimated by linear interpolation of the group means. Model-based Approaches Four variants of the model-based approaches described in Section 5 are used. First a modelbased maximum contrast test is employed to test for a dose-response signal and to select a set of significant models. Then out of the significant models, one model or averaging weights are selected by the contrast criterion or the Schwarz Information Criterion. To cover a broad shape space of model functions a linear, a concave, a convex, an umbrella and a sigmoid shape are used. The shapes are covered by the linear, the Emax, the exponential, the quadratic and the cubic model. The dose response shapes and associated shape parameters can be found in Figure 6.2. The logistic or sigmoid Emax model, which seem suited to cover the sigmoid shape are not used because of possible convergence problems with the five dose design. The shape parameters were chosen informally to represent the above shapes. It has to be noted that, apart from the linear shape, none of the used shapes (or shape parameters) exactly coincide with the shapes used to simulate the primary endpoint (compare Figure 6.1 and Table 6.1 with Figure 6.2). This slight misspecification is done to keep the simulation study as realistic as possible. It will be interesting to see, whether the performance of the contrast
71
6 PHRMA SIMULATION STUDY
0
2
4 Dose
6
8
1.0 Response 0.5
0
2
4 Dose
6
8
0
2
4 Dose
6
8
(v) cubic model
1.0
1.0
(iv) quadratic model
(iii) exponential model
0.0
Response 0.5
1.0
(ii) linear model
0.0
0.0
Response 0.5
1.0
(i) emax model
(iii) : θ(2expo) = 2.5
Response 0.5
Response 0.5
(i) : θ(2Emax) = 1.5
(iv) : (θ01, θ02) ≈ (0.367, − 0.033)
(− 0.055, 0.067, − 0.006)
0.0
0.0
(v) : (θ01, θ02, θ03) ≈
0
2
4 Dose
6
8
0
2
4 Dose
6
8
Figure 6.2: Candidate set of models with associated guesstimates
based method will suffer from this fact. If the Emax or the exponential model fails to converge it is excluded from the set of significant models. Local Polynomial Regression For local polynomial regression two approaches are employed: local linear and local quadratic regression. To test for a dose-response signal, for both approaches (the same) model-free maximum contrast test is used. The contrasts are chosen exactly as in Figure 2.1. The only difference is that the change points in Figure 2.1 were 1/3 and 2/3; here 8 · 1/3 and 8 · 2/3 are chosen. For the umbrella contrast the effect occurring at the largest dose is also set to 0.5. Thus a broad ‘shape-space’ is covered: convex, concave, sigmoid, linear and umbrella shapes (like for the model based approaches). If a dose-response relationship can be established local polynomial regression techniques will be employed for dose-response modelling and dose estimation. Following the considerations of Section 4.1.2–4.1.4 the Gaussian weight function will be used and a global bandwidth parameter is selected by minimizing the GCV criterion based on the original data (to be precise the numerical approximation of the GCV score, used by the locfit package is minimized).
72
6 PHRMA SIMULATION STUDY
Mean Fct. Covariance Fct. β τ b
β0 + β1 d + β2 d2 τ 2 exp(−b(d1 − d2 )2 ) ∝1 IG(1, 1) TB(5.68, 3.56, 1.6)
Table 6.2: Used prior and hyperprior distributions Gaussian Process Regression For the purpose of the simulations study, a Bayesian analysis based on MCMC sampling is not feasible. 300,000 studies need to be simulated and evaluated for each method. This would mean conducting 300,000 times an MCMC simulation, which is beyond the time frame of this thesis. So a variant of the computationally cheaper maximization approach described in Section 4.2.4 will be employed. The choice of the prior and hyperprior distributions is described in Table 6.2. The hyperprior distribution for b is obtained simply by using the elicitated distribution for the dose-range [0, 1] (see, Section 4.2.3). There the value κ is set to 0.2, which is 1/5 of the maximal dose. Supposing the smoothness assumptions are the same for the simulation study this prior distribution can be used but κ is set to 1.6, which is 1/5 of the largest dose 8. The mode of the prior distribution for τ is chosen as 0.5, which is approximately one third of the expected difference between placebo and maximum effect. The prior distribution for β is chosen as an improper non-informative prior. For the parameter σ the maximization approach is not used. In the dose-response setting a good variance estimator is available: S 2 from Section 2.1. So σ is treated as if known and set √ to the value of s2 . The hyperparameters τ and b are set to the mode of their hyperposterior and treated as if known. The dose-response effect is assessed with the probability that any of the used contrasts is larger zero (see Section 4.2.5). As the maximization approach is used (the parameters τ, b, σ are treated as if known) no simulation is necessary to obtain the probability. It can directly be calculated with the formulas for the mean (4.11) and variance (4.12) of the posterior Gaussian process: µ is multivariate normal distributed with mean m∗∗ = (m∗∗ (d1 ), . . . , m∗∗ (dk ))′ and covariance matrix C ∗∗ = (C ∗∗ (di , di′ ))i,i′ . Let C denote the matrix with the contrasts in the rows. The distribution of Cµ is again multivariate normal with mean Cm∗∗ and covariance CC ∗∗ C ′ . The probability that any contrast is larger than zero can easily be calculated with the mvtnorm package. For the simulation study it is important to hold a certain frequentist level
6 PHRMA SIMULATION STUDY
73
of significance. This can be achieved by Monte Carlo simulation under the null hypothesis of a flat dose-response model, using the probability that any contrast is larger than zero, as a ‘test statistic’. By this a Monte Carlo null distribution of these probabilities is obtained and one can choose the 0.95 quantile of this Monte Carlo distribution as ‘critical value’. A dose-response effect is established if the probability that any contrast is larger than zero exceeds this critical value. The estimate of the target dose is not obtained by a location summary of its distribution as in Section 5, because this approach would require simulating the posterior Gaussian process. Here a computationally cheaper approach is used: the dose response curve is estimated by the posterior mean and the estimator is plugged into the formula for the target dose (equation (1.2)). As illustrated in Section 5 this can produce results quite different from using a location summary of the distribution of d∗ .
6.3
Main Results
In this section the main results of the simulation study are summarized. A full numerical summary of the results can be found in Appendix B.
6.3.1
Power
Figure 6.3 displays the estimated power values of the different approaches for a total sample size of 150. The results for the flat dose response model can be found in Appendix B. It can be seen that all approaches control the type I error rate. A first conclusion from Figure 6.3 is that the Dunnett test performs poorly in comparison to the other methods. This is not surprising, because for the other methods the contrasts were chosen to detect certain realistic alternatives. What is more surprising is the fact that the model-based contrast test (MBCT) and model-free contrast test (MFCT) behave very similar. This can be explained by the fact that for MBCT and MFCT the set of contrasts were selected by very similar considerations: in both cases a linear, a concave, a convex, a sigmoid and an umbrella shape was included. The Gaussian process approaches coupled with model-free contrasts perform generally very similar to the model-free contrast test approach. Another observation is that for dose-response testing it seems to be best to allocate the overall number of patients to a small number of doses, as the power for five doses is in all scenarios larger than the other power values. The conclusion for power values for the sample size of 250 are similar, see Appendix B Table (ii).
74
6 PHRMA SIMULATION STUDY
5 doses
7 doses
9 doses 70
80
logistic
umbrella
emax
linear
90
100
GP−MFC MFCT MBCT Dunnett
GP−MFC MFCT MBCT Dunnett 70
80
90
100
Power
Figure 6.3: Estimated Power for the different methods: Model-based contrast test (MBCT), model-free contrast test (MFCT), Gaussian process with model-free contrasts (GP).
6.3.2
Dose-Response Estimation
Figure 6.4 displays the estimated average prediction error (see equation (6.1) for the definition) in the dose-response estimate for the different methods and an overall sample size of 150 (see Appendix B Table (iv) for the results for sample size 250). It can be seen that linear interpolation seems unsuited for dose-response estimation. Only for five doses, results comparable to the other approaches can be achieved. Apart from that no method is performing uniformly better than the other. The model-free methods perform quite comparable with the model-based approaches. Local quadratic regression has almost identical results to Gaussian process regression with a quadratic prior mean. This is probably due to the fact that for both methods a global quadratic model can be achieved, for a certain choice of the ‘input’ parameters. For all scenarios, model averaging is superior or at least equally good to selecting a single model. It is interesting to see that for dose-response estimation the five dose design performs best as well. The only exception are the model-based approaches in the Emax scenario. Here the best design seems to be the nine dose design. This can be explained by the fact that for sparse dose designs the Emax model might have convergence problems but not for nine doses. Further insight into the different methods for dose-response estimation can be gained by plotting the quantiles of the predictions for the response to the doses 0, 1, 2, 3, 4, 5, 6, 7 and 8 made in the simulation study.
75
6 PHRMA SIMULATION STUDY
5 doses
7 doses 15
9 doses 20
25
logistic
umbrella
emax
linear
30
GP LocQuad LocLin SIC−MA CT−MA SIC CT Dun/LinInt
GP LocQuad LocLin SIC−MA CT−MA SIC CT Dun/LinInt 15
20
25
30
100APE/1.3
Figure 6.4: Estimated 100APE/1.3 for sample size 150: linear interpolation of means (Dun/LinInt), parametric dose-response analysis with model selection and model averaging (CT, SIC, CT-MA, SIC-MA), local linear and local quadratic regression (LocLin, LocQuad), Gaussian process with quadratic prior mean (GP).
In Figure 6.5 the scenario of a logistic model, five doses and a total number of 150 patients is considered. As can be seen the predictions are quite different. A fundamental difference between the contrast criterion and the SIC becomes obvious. The SIC seems to favor the linear model, as it probably has the best relationship of goodness of fit and number of parameters for this scenario. But the shape in the candidate set, that is visually most similar to the (true) logistic model, is the cubic shape. Hence the contrast criterion typically selects the cubic model. A drawback of selecting the cubic model is the fact that more parameters have to be estimated, which results in a higher variability (see Figure 6.5). As can be seen in Figure 6.4 this leads to a poorer performance in terms of the APE. It is interesting to see that, the model-free methods do not really suffer from their larger flexibility. The variability of the predicted dose-response curves is acceptable. Local linear regression seems quite often to select a large bandwidth and thus the global linear model. For local quadratic regression and Gaussian process regression the quantiles look quite similar. Linear interpolation suffers from the large variation, even in
76
6 PHRMA SIMULATION STUDY
0.05 / 0.95 quantile 0.25 / 0.75 quantile 0
2
Dun/LinInt
4
6
median true logistic model
8
0
CT
SIC
2
4
6
8
CT−MA
2.5 2.0 1.5 1.0 0.5
Response
0.0 −0.5
SIC−MA
2.5
LocLin
LocQuad
GP
2.0 1.5 1.0 0.5 0.0 −0.5 0
2
4
6
8
0
2
4
6
8
Dose
Figure 6.5: Quantiles of the predictions of the differents methods in the simulation study. Scenario: logistic model, with five doses and a total sample size of 150.
the five dose scenario. Further plots of this type can be found in the Appendix B.2. There it can be seen that the SIC always seems to favor the linear model, even in cases, where it is not appropriate (see Figures B.1 and B.2). It is also illustrated that the contrast approach seems to be less ‘biased’ than the SIC. The same holds for Gaussian process regression, local quadratic polynomials and linear interpolation compared to local linear regression. It is interesting to see that in the linear model scenario, see Figure B.3, the contrast approach seems to select the cubic model in some cases, which again results in a higher variability and a relatively bad APE value see Figure 6.4. Linear interpolation suffers from a larger variance if the number of doses gets larger. In these figures it also becomes apparent that model averaging—at least in some scenarios—decreases the variance of the predictions in comparison to model selection.
6.3.3
Target Dose Estimation
A topic usually more important than estimating the dose-response profile is estimation of the target dose. As the target dose estimate does not need to exist for a given data set, it is of interest
77
6 PHRMA SIMULATION STUDY
5 doses
7 doses
9 doses 0
20
40
logistic
umbrella
emax
linear
60
80
100
GP LocQuad LocLin SIC−MA CT−MA SIC CT Dunnett
GP LocQuad LocLin SIC−MA CT−MA SIC CT Dunnett 0
20
40
60
80
100
Rel. Bias in Target Dose Estimation
Figure 6.6: Relative Bias in the target dose estimate for an overall sample size 150.
to investigate the probability, to identify a clinically relevant response for the compared methods. Most methods perform almost equally well (see Appendix B.1 Tables (v), (vi)). Despite its smaller power values the Dunnett target dose estimate performs quite well, especially for sample size 250. The model averaging approaches show a relatively bad performance. The modelaveraged target dose estimate is defined as the weighted average of the target dose estimates for the significant models. So if for one model the estimate does not exist the same is true for the model-averaged estimate. But modifications of this estimator are possible, one could for example adjust the weights appropriately and average just over the models with existing target dose estimate, as it is done for the analysis of the example data in Section 5. The next performance measure for dose estimation is the relative bias in the dose estimate. Figure 6.6 displays the results for an overall sample size of 150. The contrast approach for model selection and averaging, local quadratic polynomials and Gaussian process regression seem to be relatively unbiased estimators in many scenarios, compared to local linear regression and the SIC approach. These approaches show a poorer performance, especially for the umbrella
78
6 PHRMA SIMULATION STUDY
5 doses
7 doses 20
9 doses 40
60
80
logistic
umbrella
emax
linear
100
120
GP LocQuad LocLin SIC−MA CT−MA SIC CT Dunnett
GP LocQuad LocLin SIC−MA CT−MA SIC CT Dunnett 20
40
60
80
100
120
Rel. Absolute Error in Target Dose Estimation
Figure 6.7: Relative Absolute Error in the target dose estimate for an overall sample size 150.
and the Emax model. This can be explained by an overestimation of the placebo response due to a frequent selection of the linear model see Figures B.1 and B.2 in the Appendix. For sample size 250 in most cases the bias decreases, but the overall trend for the performance of the methods stays the same (see Appendix B, Table (viii)). The bias measures whether the method estimates the correct dose on the average. This is an interesting measure, but it does not give an impression of the variability of the estimator. A more important measure might be the average distance of the dose estimate from the true dose. This is reflected in the measure assessing the average absolute error (equation (6.3)). The results for a total sample size of 150 are shown in Figure 6.7. Here four methods show a stable performance across all scenarios: Gaussian process regression, local quadratic regression, contrast based model selection and contrast based model averaging. Despite its simplicity the Dunnett target dose estimate also performs quite well. The performance of the SIC and local linear regression suffers again in the umbrella and the Emax scenario, which can be explained by the overestimation of the placebo response. As the target dose estimate (see equation (1.2))
6 PHRMA SIMULATION STUDY
79
crucially depends on a good estimate of the placebo response this explains the bad performance of these methods in these scenarios. For the SIC, model averaging seems to improve the dose estimation. For the contrast approach model selection and model averaging perform roughly equal. The results for sample size of 250 are again better and can be found in Appendix B.1 (x).
7 DISUSSION AND CONCLUSIONS
7
80
Disussion and Conclusions
This thesis describes and analyzes methods for dose-response modelling. Some of these methods descend from traditional methods for dose-response modelling, and are further developed in this thesis. Other methods, previously not used in this setting, are adapted to the dose-response context. In Section 2 multiple contrast tests are introduced; additionally two methods for the choice of the contrasts are described. One method is based on dose-response models, while the other is model-free. In Section 3 a framework for combining model-based contrast tests with regression approaches is introduced. Within this framework the multiple contrast test is used to test for a dose-response effect but also for selection of a set of ‘significant’ models (controlling the FWER). Then two criteria for model selection and model averaging out of the set of significant models are described. The first method is based on contrasts. For model selection the model corresponding to the maximum contrast test statistic is chosen. For model averaging a bootstrap approach is developed. This approach can efficiently be implemented with numerical integration, so resampling can be avoided. The second method—the SIC—is motivated by a Bayesian argument and is a traditional approach to model selection and model averaging. In Section 4.1 local regression is described. This popular method for nonparametric regression is commonly not used for dose-response data, which are characterized by sparse designs, relatively large noise and replications at the design points. Therefore special emphasis is laid on how to choose the different input parameters for these type of data. In Section 4.2 a Bayesian nonparametric regression technique based on Gaussian processes is described. Special emphasis in this chapter is laid on the adaption of this method to dose-response data, i.e., choice of the prior mean and covariance function and the choice of hyperpriors. The prior to posterior analysis for the hyperparameters is performed and implementation issues are discussed. To evaluate the methods in practice, they are applied to a real dose-finding data set in Section 5 and evaluated in the simulation scenario of the PhRMA working group in Section 6. Next the results of the simulation study will be further interpreted and the methods discussed. First the model-based approaches are considered. In Section 5 it can be seen that the contrast approach to model selection and model averaging provides plausible results (as the ‘truth’ is not known for the example data, the performance can just be judged subjectively). The performance
7 DISUSSION AND CONCLUSIONS
81
in the simulation study is also relatively stable across the scenarios. This is not affected by the slight misspecification of the shape parameters (and some of the model functions). The performance of the SIC is mixed. For the example data set it seems that the linear model gets a weight which is a bit too large. So the model-averaged fit is—at least visually—less appealing than the fit obtained by the contrast approach. In the simulation study the SIC also tends to favor the linear model, even if it is not appropriate. In these scenarios it performs worse than the contrast approach. One reason for this performance can be the (various) asymptotic arguments justifying the SIC. Typically one can expect that the SIC would perform better if the sample size would be larger, or the sampling variance smaller. As the sampling variance is usually quite high this could be a general problem of the SIC with dose-response data. Nevertheless also a weakness of the contrast approach became apparent: this approach focuses on the shape of the observed sequence of group means, and selects the contrast most similar to the observed shape. The ‘quality’ of the model fit is not directly assessed. But for some of the scenarios considered here the contrast approach seems better suited than the SIC, both for estimation of the dose-response profile and the target dose. This might be explained by the fact that more information about possible shapes is used within the contrast approach. Another observation for the model-based approaches is that model averaging works equally or better than model selection in the scenarios studied. This holds especially for the estimation of the dose-response profile but also for the target dose estimate. Another important input parameter for the model-based approaches is the chosen candidate set of models. The quality of model based-approaches mainly depends on having chosen a good candidate set of models, not just the model selection or model averaging criterion. In the simulation study convergence problems appeared with the non-linear models, although only non-linear models with 3 parameters were used. An alternative could be to use linear models, covering the shapes of the non-linear models. For example the quadratic model could also cover the convex shape for a certain choice of the shape parameters. This would make the exponential model superfluous. The concave shape covered by the Emax model could, for example, be covered by a piecewise linear model. Ideally these models should have few parameters as the cubic model (with four parameters) already seems to be too variable, see for example Figure 6.5. The performance of local regression is mixed. Local linear regression tends to oversmooth the data, this can be seen in the IBS example data as well as in the simulation study. Local
7 DISUSSION AND CONCLUSIONS
82
quadratic regression works relatively stable for the IBS example and in the simulation study. The problem with high variability of generalized cross validation, that has been reported in other applications and lead to the development of plug-in bandwidth estimators (see Section 4.1.3), is not encountered in the simulation study. A general remark is that the implementation (locfit package in R) of local polynomials might have an influence on the results as it only fits the local polynomial at a small number of points and then interpolates the fit (as all computational implementation of local regression do). Therefore the final result will be smoother than the result obtained by directly fitting local polynomials for a fine grid of fitting points. A drawback of the method in comparison to Gaussian process regression is that confidence intervals for example for the target dose are not inherent in the methodology. Bootstrapping could be a way to calculate confidence intervals for the target dose. The bootstrap replications of the target dose could also be used to obtain an alternative estimate of the target dose: one could, for example, use the mean of these bootstrap replications of the target dose as an estimate. This would then be similar (in spirit) to the Bayesian target dose estimate for Gaussian process regression. The so obtained estimate would then be a bootstrap aggregating (‘bagging’) estimate, see Breiman (1996) for details. In Section 5 Gaussian process regression is analyzed using an MCMC approach. This allows a detailed analysis of the associated uncertainties: quantiles for the dose-response curve can be calculated as well as the density of the target dose. The results for the analysis of the example data ‘look’ plausible. It is interesting to note that the results are quite similar to local quadratic regression, but different from the model-based approaches and the combination of Dunnett test and linear interpolation. Both model-free regression techniques smooth the responses to the smaller doses more than the model-based approaches or linear interpolation. For the modelbased approaches this might be due to the fact that these use the Emax model, which ‘follows’ the group means very closely (see Figures 5.1, 5.3 and 5.6). In the simulation study—due to the computational complexity—only an approximation of the fully Bayesian analysis was used for Gaussian process regression. Additionally not a location summary of the distribution of the target dose is used for estimating the target dose. The estimator used in the simulation study is obtained by plugging in the posterior mean function (as an estimate of the dose-response curve) into equation (1.2) and is hence computationally cheaper. In my experience (gained by small scale simulations) it is better to use the more natural estimator, i.e., a location summary of the distribution of the target dose. Unfortunately this approach requires sampling from
7 DISUSSION AND CONCLUSIONS
83
high-dimensional normal distributions and it is not possible to evaluate the estimator in the full PhRMA simulation study. Nevertheless even for the used estimator the performance in the performance study was good, and similar to local quadratic regression. Beside the computational problems to implement the fully Bayesian analysis there is also another difficulty with Gaussian process regression: it turns out that the posterior of the parameters (τ, b, σ)′ is quite sensitive to the choice of the priors. Experimentation with different priors reveals that especially the maximization approach is sensitive to changes in the prior. This became also obvious in the MCMC based analysis of the IBS data set in Section 5. Here the posteriors of the parameters are similar (for τ and σ) or almost identical (for the parameter b) to their priors. It seems that the (integrated) likelihood for τ, b and σ is relatively noninformative about these parameters in general and especially about b. The sensitivity of the posterior to the prior for these parameters can be seen as a disadvantage of the methodology, especially with the controlled environment of clinical trials in mind. If data from Phase I would be available, setting the priors would be easier: the MCMC sample from the posterior of a Gaussian process (data) model based on the Phase I data could guide the choice of priors for the Phase II study. Still one would need to choose priors in Phase I. In principle there are two ways to resolve this problem: (i) one could develop standard non-informative priors for the hyperparameters and σ, leading to proper posteriors, such as those developed for a similar model by Berger et al. (2001). The analysis would then be more ‘objective’. (ii) Another option would be to accept the sensitivity of the posterior to the priors. The setting of the priors for the hyperparameters can be viewed as a decision similar to selecting a set of candidate models. This is the approach I employed in this thesis. For example the parameter b governs the complexity of the curve, and by this determines the ‘shape-space’ that is covered. The parameter τ controls the reliance on the parametric prior mean function. It controls ‘how easy’ a more complex fit, departing from the prior mean function and following the data more closely, can be achieved. A disadvantage might be that the selection of hyperpriors for b and τ is more difficult than the selection of a candidate set of models. In this thesis one default approach for the selection of those hyperpriors is presented, that works reasonable for the example data and the simulation study. Careful sensitivity analyses based on real data of already completed trials could lead to a refined understanding of the influence of the priors to the posteriors for these parameters and to a realistic choice of the priors. Regarding the ‘Critical Path Initiative’ of the FDA, it can be stated that some of the methods
7 DISUSSION AND CONCLUSIONS
84
described in this thesis, perform promising, both for the analysis of the example data and in the simulation study. Some of the methods perform uniformly better than the Dunnett approach (combined with linear interpolation). The superiority of the presented approaches became especially apparent in the establishment of a treatment effect. Here the model-based and the model-free multiple contrast tests work better than the Dunnett test. For dose-response and dose estimation especially local quadratic regression, Gaussian process regression with quadratic prior mean and the model-based approaches coupled with the contrast criterion for model selection and (especially) model averaging perform reasonable. A topic not discussed so far, is the design of studies to be analyzed with the methods described in this thesis. First a design objective would need to be chosen. This requires a specification of the aim of the experiment. For dose-response studies this could for example be the establishment of the treatment effect or precise estimation of the target dose or the dose-response profile. Currently dose-finding studies are typically designed with the power of the dose-response test as design criterion, see Pinheiro, Bornkamp and Bretz (2006) as an example how to plan a study for the combination of contrast tests and regression introduced in Section 3, focussing on the power. However, in the simulations in Section 6 it becomes obvious that estimation of the target dose is typically more ‘difficult’ than establishing a treatment effect, so a mixed choice of design objectives might be desirable. Typically the design of a study depends on quantities that are not known at the time a study is designed. For example the standard deviation σ is needed for sample-size calculations, when the design objective is the power of the dose-response test. If there are interim analyses during the study, the knowledge gained about these quantities can be used for a more efficient design of the next trial period, such that the trial would adapt its design during the study. Usually such ‘adaptive designs’ are more efficient, in the sense that the same objective can be achieved with a smaller number of patients, compared to the non-adaptive designs used in this thesis. This is an important aspect both from the ethical perspective but also from the financial and time aspect. This would be another important step for more efficient drug development and would be in accordance with objectives of the ‘Critical Path Initiative’ of the FDA.
REFERENCES
85
References Adler, R. J. (1981). The Geometry of Random Fields, Wiley, New York. Bates, D. and Chambers, J. (1992). Nonlinear models, in J. Chambers and T. Hastie (eds), Statistical Models in S, Wadsworth and Brooks/Cole, Pacific Grove, California, pp. 421– 454. Berger, J. O., de Oliveira, V. and Sans´ o, B. (2001). Objective Bayesian analysis of spatially correlated data, Journal of the American Statistical Association 96: 1361–1374. Biesheuvel, E. and Hothorn, L. A. (2002). Many-to-one comparisons in stratified designs, Biometrical Journal 44: 101–116. Breiman, L. (1996). Bagging predictors, Machine Learning 24: 123–140. Bretz, F., Genz, A. and Hothorn, L. A. (2001). On the numerical availability of multiple comparison procedures, Biometrical Journal 43: 645–656. Bretz, F., Pinheiro, J. C. and Branson, M. (2005). Combining multiple comparisons and modeling techniques in dose-response studies, Biometrics 61: 738–748. Buck, C. E., Aguilar, D. G. P., Litton, C. D. and O’Hagan, A. (2006). Bayesian nonparametric estimation of the radiocarbon calibration curve, Bayesian Analysis 1: 265–288. Buckland, S. T., Burnham, K. P. and Augustin, N. H. (1997). Model selection an integral part of inference, Biometrics 53: 603–618. Cleveland, W. S. and Loader, C. (1996). Smoothing by local regression: Principles and methods, in W. H¨ardle and M. G. Schimek (eds), Statistical Theory and Computational Aspects of Smoothing, Springer, New York. deLeeuw, J. (1992). Introduction to: Akaike (1973) Information theory and an extension of the maximum likelihood principle, in S. Kotz and N. Johnson (eds), Breakthroughs in Statistics. Volume I: Foundations and Basic Theory, Springer, New York. Dunnett, C. W. (1955). A multiple comparison procedure for comparing several treatments with a control, Journal of the American Statistical Association 50: 1096–1121. Ecker, M. D. and Gelfand, A. E. (1997). Bayesian variogram modelling for an isotropic spatial process, Journal of Agricultural, Biological and Environmental Statistics 2: 347–369. Efron, B. and Tibshirani, R. (1993). An Introduction to the Bootstrap, Chapman and Hall, New York. Fan, J. and Gijbels, I. (1996). Local Polynomial Modelling and Its Applications, Chapman and Hall, London. Genz, A., Bretz, F. and Hothorn, T. (2005). mvtnorm: Multivariate Normal and T Distribution. R package version 0.7-2. Gu, C., Heckman, N. and Wahba, G. (1992). A note on generalized cross-validation with replicates, Statistics and Probability Letters 14: 283–287.
REFERENCES
86
Handcock, M. S. and Stein, M. L. (1993). A Bayesian analysis of kriging, Technometrics 35: 403– 410. Hochberg, Y. and Tamhane, A. (1987). Multiple Comparison Procedures, Cambridge University Press, New York. Hothorn, T., Bretz, F. and Genz, A. (2001). On multivariate t and Gauss probabilities in R, R Newsletter 1: 27–29. Kass, R. E. and Raftery, A. E. (1995). Bayes factors, Journal of the American Statistical Association 90: 773–795. Loader, C. (1999). Local Regression and Likelihood, Springer, New York. Loader, C. (2005). locfit: Local Regression, Likelihood and Density Estimation. R package version 1.1-11. Lukacs, E. (1970). Characteristic Functions, Griffin, London. MacDougall, J. (2006). Analysis of dose-response studies — Emax model, in N. Ting (ed.), Dose Finding in Drug Development, Springer, New York, pp. 127–145. Neal, R. (1998). Regression and classification using Gaussian process priors, in J. Bernardo, J. Berger, A. Dawid and A. Smith (eds), Bayesian Statistics 6, Oxford University Press, pp. 475–501. Oakley, J. (2002). Elicitating Gaussian process priors for complex computer codes, The Statistician 51: 81–97. O’Hagan, A. (1978). Curve fitting and optimal design for prediction, Journal of the Royal Statistical Society B 40: 1–42. O’Hagan, A. and Forster, J. (2004). Kendall’s Advanced Theory of Statistics, Volume 2B: Bayesian Inference, 2nd edn, Arnold, London. PhRMA working group on Adaptive Dose Ranging (2006). Adaptive dose ranging designs: Evaluation and recommendations. to appear. Pinheiro, J. C., Bornkamp, B. and Bretz, F. (2006). Design and analysis of dose finding studies combining multiple comparisons and modeling procedures, Journal of Biopharmaceutical Statistics 16. in press. Pinheiro, J. C., Bretz, F. and Branson, M. (2006). Analysis of dose-response studies – modeling approaches, in N. Ting (ed.), Dose Finding in Drug Development, Springer, New York, pp. 146–171. R Development Core Team (2005). R: A language and environment for statistical computing, R Foundation for Statistical Computing, Vienna, Austria. Ripley, B. (2004). Selecting among large classes of models, in N. Adams, M. Crowder, D. Hand and D. Stephens (eds), Methods and Models in Statistics: In Honour of Professor John Nelder, FRS, Imperial College Press, London, pp. 155–170.
REFERENCES
87
Rovin, L. (2005). FDA’s critical path initiative: History, objectives, approach, Presentation available under: http://www.fda.gov/oc/initiatives/criticalpath/presentations.html. Schwarz, G. (1978). Estimating the dimension of a model., Annals of Statistics 6: 461–464. Shao, J. (2003). Mathematical Statistics, 2nd edn, Springer, New York. Stewart, W. H. and Ruberg, S. J. (2000). Detecting dose response with contrasts, Statistics in Medicine 19: 913–921. Ting, N. (2006). Introduction and new drug development process, in N. Ting (ed.), Dose Finding in Drug Development, Springer, New York, pp. 1–17. Upsdell, M. P. (1996). Choosing an appropriate covariance function in Bayesian smoothing, in J. Bernardo, J. Berger, A. Dawid and A. Smith (eds), Bayesian Statistics 5, Oxford University Press, pp. 747–756. Wahba, G. (1978). Improper priors, spline smoothing and the problem of guarding against model errors in regression, Journal of the Royal Statistical Society B 40: 588–596.
88
A ADDITIONAL MATERIAL
A A.1
Additional Material Derivation of Optimal Contrasts
In this section the closed form solution for the optimal contrasts will be derived (see Section 2.3). The function c′ µ c′ µ g(c, µ) = qP =√ , k c′ Sc 2 /n c i i=1 i
is to be maximized with respect to c, where S = diag(1/n1 , . . . , 1/nk ) and µ = (µ1 , . . . , µk )′ is an arbitrary vector. The first thing to note is that if c is multiplied with a positive scalar, the value of g is unchanged, as the scalar cancels out in numerator and denominator. So the maximization problem is invariant with respect to multiplication of c with a positive constant. Hence one can impose the constraint that the denominator equals an arbitrary constant and the maximization problem remains unaltered. It is convenient to introduce for example the constraint c′ Sc = 1. As c should be a contrast another constraint is c′ 1 = 0. The function g is differentiable so the method of Lagrange can be used for maximization: The Lagrange function L is then given by L(c) = c′ µ + λ1 (c′ Sc − 1) + λ2 c′ 1 Differentiating with respect to c gives ∂L(c) = µ + λ1 2Sc + λ2 1 ∂c Equating the derivative to zero yields µ + λ1 2Sc + λ2 1 = 0 ⇔ λ1 2Sc = −µ − λ2 1 1 −1 λ2 −1 ⇔ c=− S µ− S 1 2λ1 2λ1 Now plugging in the constraint c′ 1 = 0 gives 1 (µ′ S −1 + λ2 1′ S −1 )1 = 0 2λ1 ⇒ µ′ S −1 1 + λ2 1′ S −1 1 = 0 k k X X ni = 0 µi ni + λ2 ⇔ −
i=1
i=1
⇔ λ2 = −
k X i=1
µi ni /N
89
A ADDITIONAL MATERIAL Defining λ := − 2λ1 1 and µ ¯ := N −1
Pk
i=1 µi ni
and plugging in λ2 gives
c = λS −1 (µ − µ ¯1) which is equal to
c = λ
n1 (µ1 − µ ¯) n2 (µ2 − µ ¯) .. . nk (µk − µ ¯)
.
(A.1)
From the discussion above it follows that λ has to be positive and hence λ1 should be chosen negative. The Hessian matrix of L is given by λ1 2S. As λ1 has to be chosen negative it becomes obvious that the Hessian matrix is negative definite and hence the found candidate the maximal value.
A.2
Weighted Smoothing
Here it is shown that minimization of the residual sum of squares (4.2) yields the same result as minimization of (4.6), to obtain the local polynomial estimate (see Section 4.1.1). Denote the local polynomial at the fitting point x0 as: µβ(x0 ) (di ) := β0 (x0 ) + β1 (x0 )(di − x0 ) + . . . + βp (x0 )(di − x0 )p . The residual sum of squares criterion (4.2) is equal to k X i=1
=
+
ni ni k X X X 2 wi (x0 ) wi (x0 ) (yij − y¯i. + y¯i. − µβ(x0 ) (di ))2 = (yij − µβ(x0 ) (di )) = i=1
j=1
i=1
ni X
(yij − y¯i. )2 + 2
k X
ni X
(¯ yi. − µβ(x0 ) (di ))2
k X
i=1
wi (x0 )
j=1
wi (x0 )
j=1
k X
wi (x0 )
i=1
j=1
ni X j=1
(yij − y¯i. )(¯ yi. − µβ(x0 ) (di ))
Now the middle summand vanishes with the summation and the first summand is a constant in the minimization with respect to β(x0 ). The last summand is equal to (4.6) so minimizing the last summand is the same as minimizing (4.2).
90
A ADDITIONAL MATERIAL
Inverse Gamma Mean Variance Mode
β α α−1 β2 (α−1)2 (α−2) β α+1
>1 α>2
Beta α α+β αβ (α+β)2 (α+β+1) α−1 α+β−2
Table A.1: Summaries of the Inverse Gamma and the Beta distribution
A.3
Inverse Gamma Distribution
The inverse gamma distribution is a continuous probability distribution defined on [0, ∞). It
is closely related to the gamma distribution: If X has a gamma distribution then X −1 has an inverse gamma distribution. Its probability density function is given by � � β α −α−1 −β f (x|α, β) = x exp , Γ(α) x where x > 0 and Γ(.) is the gamma function. I will write X ∼ IG(α, β). α is a postive shape
parameter and β is a positive scale parameter Table A.1 gives some summaries of the inverse gamma distribution.
A.4
Beta Distribution and Transformed Beta Distribution
The beta distribution is a continuous probability distribution defined on the interval [0, 1]. Its probability density function is given by f (x|α, β) =
Γ(α + β) α−1 x (1 − x)β−1 , Γ(α)Γ(β)
where x ∈ [0, 1], α > 0, β > 0 and Γ(.) is the gamma function. I will write X ∼ B(α, β). Table A.1 gives some summaries of the beta distribution. Now the distribution of a transformed beta random variable is derived. It is used for Gaussian process regression as prior distribution for the hyperparameter b. If the Gaussian correlation function is used and if one assumes that the correlation ρ between doses of the distance κ has a beta distribution, we can obtain the distribution of the parameter b by the following relationship ρ = exp(−bκ2 ) ⇔ b = − log(ρ)/κ2 . Hence the transformation of the random variable ρ is given by g(ρ) = − log(ρ)/κ2 and its
inverse by g −1 (b) = exp(−bκ2 ). To obtain the density of the transformation, the transformation
A ADDITIONAL MATERIAL
91
theorem for density functions can be used (see for example (Shao 2003, Proposition 1.8). If ρ is beta distributed with parameters α and β the transformed random variable b = − log(ρ)/κ2 has the probability density function f (b|α, β) = =
Γ(α + β) exp(−bκ2 )α−1 (1 − exp(−bκ2 ))β−1 exp(−bκ2 )κ2 Γ(α)Γ(β) Γ(α + β) exp(−bκ2 )α (1 − exp(−bκ2 ))β−1 κ2 . Γ(α)Γ(β)
(A.2) (A.3)
I will write X ∼ TB(α, β, κ). An interesting special case results if a uniform distribution is assumed for ρ. Then the random variable b has an exponential distribution with parameter λ = κ2 .
92
A ADDITIONAL MATERIAL
Convergence Plots for MCMC Methods
0
5
10
τ
15
20
A.5
0
1000
2000
3000
4000
5000
3000
4000
5000
3000
4000
5000
0
10
20
b
30
40
Iteration
0
1000
2000
0
20
σ
40
60
Iteration
0
1000
2000 Iteration
Figure A.1: First 5,000 iterations of the independence sampler
0
5
10
15 lag
20
25
30
0.8 0.6 0.4
Autocorrelation σ
0.0
0.2
1.0 0.8 0.6 0.4
Autocorrelation b
0.0
0.2
0.8 0.6 0.4 0.2 0.0
Autocorrelation τ
(iii) 1.0
(ii)
1.0
(i)
0
5
10
15 lag
20
25
30
0
5
10
15
20
25
30
lag
Figure A.2: Empirical Autocorrelations of the components (i) τ ,(ii) b,(iii) σ of chain.
B
93
COMPLETE RESULTS OF SIMULATION STUDY
B B.1
Complete Results of Simulation Study Tables
(i) Power to detect Dose Response, Sample Size 150 Model flat
logistic
umbrella
linear
emax
Doses 5 7 9 5 7 9 5 7 9 5 7 9 5 7 9
Dunnett 4.9 5.1 4.9 91.3 79.7 72.1 92.1 84.9 75.8 85.6 71.4 62.2 94.2 87.4 78.9
Method MBCT MFCT 4.7 4.7 5.3 5.1 4.6 5.0 98.5 98.6 96.4 96.2 98.3 98.0 94.9 94.4 90.5 89.1 91.0 89.9 94.3 93.1 87.8 84.8 90.5 88.3 95.9 94.5 89.2 87.3 83.3 80.2
GP-MFC 4.7 4.7 5.2 98.6 96.7 98.3 95.0 88.9 90.7 95.2 87.3 91.1 94.7 86.9 80.8
(ii) Power to detect Dose Response, Sample Size 250 Model flat
logistic
umbrella
linear
emax
Doses 5 7 9 5 7 9 5 7 9 5 7 9 5 7 9
Dunnett 4.4 4.5 5.0 98.9 94.5 90.2 99.1 96.4 92.3 97.1 89.3 83.2 99.5 97.3 93.5
Method MBCT MFCT 4.8 4.8 5.3 4.8 5.1 4.5 100.0 99.9 99.8 99.7 100.0 99.9 99.6 99.5 98.2 98.2 98.8 98.6 99.3 99.2 97.2 96.4 98.2 97.8 99.7 99.5 98.1 97.7 96.3 94.5
GP-MFC 5.1 5.2 5.3 100.0 99.8 99.9 99.6 98.3 98.6 99.4 97.5 98.5 99.6 97.7 94.9
B
94
COMPLETE RESULTS OF SIMULATION STUDY
(iii) Rel. Average Prediction Error in Dose-Response Estimation, Sample Size 150 Model logistic
umbrella
linear
emax
Doses 5 7 9 5 7 9 5 7 9 5 7 9
Dun/LinInt 20.5 25.9 32.0 20.5 26.2 32.1 20.3 26.2 32.4 22.1 27.8 32.0
CT 19.5 20.0 19.9 18.0 18.3 18.6 18.2 18.6 19.1 20.1 20.0 18.8
SIC 17.6 18.0 17.9 21.3 21.0 21.5 13.8 14.5 14.6 24.9 23.9 22.0
Method CT-MA SIC-MA 18.2 17.0 18.7 17.4 18.7 17.5 17.4 18.6 17.8 18.7 17.9 18.8 16.5 13.8 17.2 14.6 17.4 14.7 19.8 21.5 20.0 21.3 18.9 19.9
LocLin 17.6 17.9 18.0 19.2 20.5 20.5 14.2 14.6 14.5 22.1 24.1 23.0
LocQuad 19.1 19.4 20.3 17.7 18.1 18.7 17.6 18.0 18.6 20.4 21.2 21.3
GP 18.6 18.9 19.5 17.5 17.9 18.3 17.5 17.9 18.4 20.1 20.7 20.4
(iv) Rel. Average Prediction Error in Dose-Response Estimation, Sample Size 250 Model logistic
umbrella
linear
emax
Doses 5 7 9 5 7 9 5 7 9 5 7 9
Dun/LinInt 16.0 20.0 24.5 15.9 20.3 24.5 15.7 20.0 24.5 17.7 21.9 24.5
CT 15.4 16.0 15.9 14.1 14.3 14.7 13.9 14.2 14.7 15.7 16.1 14.6
SIC 15.6 15.8 15.7 17.0 17.1 17.9 10.7 11.2 11.0 18.9 19.3 17.6
Method CT-MA SIC-MA 14.8 15.0 15.2 15.1 15.2 15.1 13.5 15.0 13.8 15.2 14.0 15.5 12.8 10.8 13.2 11.2 13.3 11.1 15.4 17.0 16.2 17.6 15.5 17.2
LocLin 15.5 15.7 15.7 15.4 16.5 16.8 11.0 11.3 11.3 18.1 19.9 18.8
LocQuad 15.5 15.7 16.6 13.7 14.0 14.4 13.6 13.9 14.3 16.8 17.3 17.3
GP 15.1 15.3 15.8 13.9 14.3 14.6 13.7 14.1 14.5 16.5 17.0 16.6
B
95
COMPLETE RESULTS OF SIMULATION STUDY
(v) Probability to detect a target dose, Sample Size 150 Model flat
logistic
umbrella
linear
emax
Doses 5 7 9 5 7 9 5 7 9 5 7 9 5 7 9
Dunnett 2.9 5.1 4.9 87.5 79.7 72.1 88.2 84.9 75.8 80.5 71.4 62.2 91.4 87.4 78.9
CT 0.8 1.9 1.9 89.6 87.5 85.3 83.3 82.1 82.3 78.1 75.1 75.4 84.7 79.0 73.4
SIC 0.6 1.9 1.6 90.5 90.5 92.5 76.4 78.5 77.5 77.3 75.8 76.8 78.0 75.0 66.3
Method MA LocLin 0.4 0.7 1.5 1.5 1.3 1.1 87.0 90.0 85.6 90.3 83.0 92.0 66.2 76.8 72.8 74.4 70.5 73.6 74.0 77.2 71.5 74.2 69.5 75.1 68.0 78.7 69.9 72.3 57.8 60.8
LocQuad 1.0 2.2 2.1 86.3 83.7 85.0 84.0 81.9 81.3 78.5 74.4 75.3 87.2 82.8 73.9
GP 1.0 2.2 2.2 88.4 86.6 89.2 84.2 81.4 82.1 78.1 75.0 75.7 85.2 80.8 72.9
(vi) Probability to detect a target dose, Sample Size 250 Model flat
logistic
umbrella
linear
emax
Doses 5 7 9 5 7 9 5 7 9 5 7 9 5 7 9
Dunnett 0.3 2.2 4.8 90.7 90.5 90.1 91.2 93.2 92.2 83.5 82.9 82.9 93.6 94.8 93.4
CT 0.1 0.3 0.4 93.2 91.4 88.8 87.2 85.5 86.9 82.0 78.2 77.5 88.2 83.1 78.1
SIC 0.1 0.2 0.3 95.3 94.8 96.3 81.8 80.9 80.2 82.7 79.3 80.2 83.9 77.6 67.2
Method MA LocLin 0.1 0.1 0.1 0.3 0.1 0.3 92.0 94.6 90.2 94.8 87.7 96.1 67.0 81.9 66.9 79.5 67.1 78.6 79.4 82.7 75.2 79.8 72.1 80.6 65.4 85.2 62.8 78.1 46.2 67.0
LocQuad 0.2 0.5 0.6 90.4 87.6 88.9 88.1 85.4 85.8 82.7 79.8 80.1 91.5 87.8 81.7
GP 0.2 0.4 0.4 92.6 90.6 92.5 88.1 86.3 86.4 83.2 80.1 81.2 89.9 86.5 79.5
B
96
COMPLETE RESULTS OF SIMULATION STUDY
(vii) Rel. Bias in Target Dose Estimation, Sample Size 150 Model logistic
Doses 5 7 9 5 7 9 5 7 9 5 7 9
umbrella
linear
emax
Dunnett 16.6 8.2 12.5 34.1 24.8 35.1 0.4 -7.6 -5.4 67.5 60.3 66.5
CT 0.4 -1.0 -1.9 3.9 2.3 0.3 -10.3 -11.5 -12.9 33.8 37.1 24.0
SIC 6.5 2.7 1.5 40.7 39.9 45.8 -3.7 -5.6 -5.4 84.0 95.0 83.4
Method CT-MA SIC-MA 0.1 3.8 -2.0 -0.8 -3.9 -3.7 9.9 38.5 7.8 33.9 7.6 37.9 -10.0 -6.2 -11.9 -8.8 -13.2 -9.4 47.6 85.5 50.6 88.3 42.2 85.2
LocLin 5.5 2.0 0.5 34.7 40.7 44.3 -4.4 -5.8 -5.5 75.8 94.5 99.1
LocQuad 1.8 -0.5 -1.7 7.1 5.4 5.3 -10.0 -12.8 -13.6 39.8 39.2 39.5
GP 1.4 -0.7 -1.4 9.7 7.6 9.1 -8.2 -10.6 -10.7 48.1 49.1 56.7
(viii) Rel. Bias in Target Dose Estimation, Sample Size 250 Model logistic
umbrella
linear
emax
Doses 5 7 9 5 7 9 5 7 9 5 7 9
Dunnett 20.5 7.2 6.3 40.5 18.0 19.2 8.1 -5.3 -8.9 69.2 47.5 34.8
CT 2.8 1.0 1.7 6.7 3.9 2.5 -4.4 -6.0 -6.6 31.8 35.0 19.7
SIC 8.7 4.4 2.5 31.0 31.0 38.3 0.4 -1.5 -0.6 54.8 66.2 53.8
Method CT-MA SIC-MA 2.8 6.5 0.5 1.9 0.3 -1.2 11.2 34.5 9.3 33.6 9.1 38.5 -4.6 -1.8 -6.3 -4.0 -7.2 -4.1 40.7 68.7 45.0 76.6 38.8 82.9
LocLin 7.6 3.9 2.0 32.8 36.0 40.1 -0.3 -1.2 -1.3 65.9 77.5 82.3
LocQuad 5.7 3.1 2.0 11.0 8.8 9.5 -4.1 -5.9 -7.2 42.4 45.1 45.2
GP 3.6 1.0 0.4 11.0 9.5 10.3 -3.8 -5.7 -6.2 45.5 47.0 54.7
B
97
COMPLETE RESULTS OF SIMULATION STUDY
(ix) Rel. Absolute Error in Target Dose Estimation, Sample Size 150 Model logistic
umbrella
linear
emax
Doses 5 7 9 5 7 9 5 7 9 5 7 9
Dunnett 28.0 21.8 24.6 53.0 39.5 52.1 23.4 27.7 25.7 67.5 60.3 86.6
CT 18.5 18.8 20.8 39.2 40.1 44.2 22.3 23.4 25.5 62.5 63.4 71.0
SIC 18.1 18.5 18.5 73.2 70.9 77.7 16.2 17.9 17.5 116.6 120.2 127.0
Method CT-MA SIC-MA 17.7 16.2 18.1 16.1 19.1 15.6 38.5 56.1 38.1 52.7 39.8 55.1 19.8 15.4 21.4 17.3 22.2 16.9 65.1 98.7 64.9 97.6 68.0 103.2
LocLin 19.2 19.0 18.8 51.7 58.7 61.5 16.9 17.3 17.4 89.6 108.0 117.3
LocQuad 21.7 21.6 23.6 35.6 35.8 37.7 23.2 24.4 25.7 57.7 56.7 63.3
GP 21.7 22.0 23.1 35.6 35.7 38.3 22.4 23.6 24.2 59.2 59.9 70.4
(x) Rel. Absolute Error in Target Dose Estimation, Sample Size 250 Model logistic
umbrella
linear
emax
Doses 5 7 9 5 7 9 5 7 9 5 7 9
Dunnett 27.2 17.9 19.5 53.6 33.9 41.3 20.4 25.1 24.7 69.2 47.5 63.4
CT 14.9 15.6 16.4 35.9 35.0 38.0 17.7 18.8 20.4 60.3 62.5 65.6
SIC 16.3 16.3 15.8 61.9 62.4 71.1 13.8 14.9 14.6 92.7 101.5 107.3
Method CT-MA SIC-MA 14.4 14.6 15.0 14.2 15.4 13.2 36.2 53.8 35.3 52.4 36.5 55.5 16.2 13.4 17.1 14.1 17.8 13.7 60.3 88.0 63.5 92.6 64.8 103.3
LocLin 17.0 16.7 16.2 45.2 50.4 54.9 14.5 15.1 15.0 75.3 89.7 102.0
LocQuad 18.1 17.9 19.5 31.5 31.4 33.9 18.6 19.4 20.8 54.9 57.6 66.4
GP 18.2 18.0 19.1 32.0 31.7 34.3 18.8 19.6 20.5 54.4 55.7 66.9
B
98
COMPLETE RESULTS OF SIMULATION STUDY
B.2
Figures 0.05 / 0.95 quantile 0.25 / 0.75 quantile 0
2
Dun/LinInt
4
6
median true umbrella model
8
0
CT
2
SIC
4
6
8
CT−MA 2.0 1.5 1.0 0.5
Response
0.0 −0.5
SIC−MA
LocLin
LocQuad
GP
2.0 1.5 1.0 0.5 0.0 −0.5 0
2
4
6
8
0
2
4
6
8
Dose
Figure B.1: Quantiles of the predictions of the different methods in the simulation study. Scenario: quadratic model, with seven doses and a total sample size of 250.
0.05 / 0.95 quantile 0.25 / 0.75 quantile 0
Dun/LinInt
2
4
6
median true emax model
8
0
CT
SIC
2
4
6
8
CT−MA 2 1
Response
0 −1
SIC−MA
LocLin
LocQuad
GP
2 1 0 −1 0
2
4
6
8
0
2
4
6
8
Dose
Figure B.2: Quantiles of the predictions of the different methods in the simulation study. Scenario: Emax model, with nine doses and a total sample size of 150.
B
99
COMPLETE RESULTS OF SIMULATION STUDY
0.05 / 0.95 quantile 0.25 / 0.75 quantile 0
2
Dun/LinInt
4
6
median true linear model
8
0
CT
2
SIC
4
6
8
CT−MA 2.0 1.5 1.0
Response
0.5 0.0 −0.5
SIC−MA
LocLin
LocQuad
GP
2.0 1.5 1.0 0.5 0.0 −0.5 0
2
4
6
8
0
2
4
6
8
Dose
Figure B.3: Quantiles of the predictions of the different methods in the simulation study. Scenario: linear model, with five doses and a total sample size of 250.
0.05 / 0.95 quantile 0.25 / 0.75 quantile 0
Dun/LinInt
2
4
6
median true logistic model
8
0
CT
SIC
2
4
6
8
CT−MA 2.0 1.5 1.0 0.5
Response
0.0 −0.5
SIC−MA
LocLin
LocQuad
GP
2.0 1.5 1.0 0.5 0.0 −0.5 0
2
4
6
8
0
2
4
6
8
Dose
Figure B.4: Quantiles of the predictions of the different methods in the simulation study. Scenario: logistic model, with seven doses and a total sample size of 250.
C
IMPLEMENTATION
C
100
Implementation
For the implementation of the methods described in this thesis, the open source version R of the S language was used in versions 2.1.1 and 2.2.0 (R Development Core Team 2005). The contrast test methods and all methods requiring integration over multivariate normal or multivariate t densities were performed with the mvtnorm package (Genz et al. 2005). For the implementation of local regression the locfit package was used (Loader 2005). The implementation of Gaussian process regression was developed based on a first version of Beat Neuenschwander.
C.1
SIC in R
In the used R-versions the SIC can be calculated with the AIC function and setting the argument k equal to log(N ). Unfortunately for nls objects (non-linear regression objects) the sampling variance σ 2 is not counted as a parameter, while for lm objects (linear regression objects) the sampling variance σ 2 is counted as a parameter. Because of this inconsistency the AIC function is not used to calculate the SIC (see the source code). Interestingly S-Plus 7 calculates the correct values with the BIC function (which is only available in S-Plus).
C.2
Source Code
In this section the source code for the analysis of the example data set and the main programs for the simulations will be displayed. For space reasons I will just present the code that does the actual calculations of the example. The code for reading in the data, producing the plots is omitted. For the simulation code I will present just the core functions that perform the test decision, estimation of the dose-response curve and the target dose. Usually these functions depend on a daten, crit and CM argument, this are the simulated data set, the critical value (or critical probability for Gaussian processes) and the contrast matrix. There is no function to perform Gaussian process regression in R, so for Gaussian Processes I will also display the program code.
C
IMPLEMENTATION
C.2.1
Dose-Finding Example
############################################################################################################################### ### Dunnett # object IBS contains the data set library(mvtnorm) # function to calculate teststatistic deltaVec