Regression and artificial neural network methods are employed in energy .... The Perceptron learning rule is an algorithm that adjusts the network weights.
Available online at www.pelagiaresearchlibrary.com Pelagia Research Library Advances in Applied Science Research, 2011, 2 (5):329-339
ISSN: 0976-8610 CODEN (USA): AASRFC
Comparison of Regression Model and Artificial Neural Network Model for the prediction of Electrical Power generated in Nigeria Olaniyi S Maliki1, Anthony O Agbo1, Adeola O Maliki1, Lawrence M Ibeh2, Chukwuemeka O Agwu3 1
2
Department of Industrial Mathematics and Applied Statistics, Ebonyi State University Abakaliki, Nigeria Department of Geography and Environmental Sciences, Ludwig-Maximilians, University Munich, Germany 3 Department of Computer Science, Ebonyi State University Abakaliki, Nigeria
______________________________________________________________________________
ABSTRACT Energy is the fundamental resource, it gives the ability to transform, transport and manufacture any and all goods and it is vital to the development of any economy. In Nigeria, electricity is one of the oldest energy forms available for daily activities. It is also, unfortunately, grossly inadequate to meet the demands of an ever increasing population. This is largely due to inadequate planning. Efficient energy management necessitates the development and utilization of an energy plan to ensure a balance between demand and supply with any economy. Energy analysis is defined as a particular set of procedures for evaluating the total energy requirements for the supply of a service or project. Energy analysis is an important exercise in the overall energy systems planning and management. Its relevance lies in the generation of forecasts for future energy consumption (demand/supply) patterns, and this is the main objective of the present work. Regression and artificial neural network methods are employed in energy analysis to determine energy requirements up to 2036. We examine in particular the problems of Nigeria’s electricity system and based on electricity generation and consumption data we present a conceptual approach aimed at enhancing electricity generation in the country. The predicted values of the responses by ANN and regression models were compared and their closeness with the actual data values was determined. Key words: Forecasting, Regression models, PHCN, Artificial Neural Network models. ______________________________________________________________________________
INTRODUCTION Despite Nigeria's vast oil wealth, much of the country's citizens do not have access to uninterrupted supplies of electricity. Nigeria has approximately 5,900 Megawatts (MW) of installed electric generating capacity. Power outages are frequent and the power sector operates well below its estimated capacity. A fundamental reason offered is the low generating capacity 329 Pelagia Research Library
et al Adv. Appl. Sci. Res., 2011, 2 (5):329-339 _____________________________________________________________________________
Olaniyi S Maliki
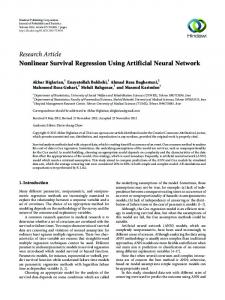
of the Nigerian power sector relative to installed capacity. Consequently, the sector had to undergo some reforms to increase power generation and distribution. Among the reforms is the setting up of the National Electricity Regulatory Commission (NERC), unbundling of PHCN and entry of Independent Power Producers (IPP) among others. These reforms are expected to increase power generation and distribution and also residential electricity demand in Nigeria. Although much explanation has been offered on the supply of electricity in Nigeria quite a little is known about the fundamentals of residential electricity demand. The quest for more accurate estimates of key electricity demand parameters derives from two factors. First is their critical importance in the projection of future electricity demand. Secondly, the fact that understanding electricity demand dynamics [3,4] is essential for more informed and successful electricity policy decision making and implementation. To the best of our knowledge, this study is the first to empirically analyze and forecast up to 2036, the residential electricity demand for Nigeria. The empirical analysis is for the period 1973–2007, employing annual data. The choice of this period is due to the availability of data. Our study makes a methodological contribution to the literature on electricity demand. 25 20 15 10 5 0 -5
Fig. 1
1 3 5 7 9 11 13 15 17 19 21 23 25 27 29 31 33
Fig. 2 Power Generation Growth Rate (GGR) in %, as a function of time
2. Objective of Study The objective of this study is to model the relevant data provided by the Power Holding Company PLC (Appendix A) using the Statistical Technique and the Neural Networks, and then to compare the results of these two techniques. 3. A Historical Perspective In 1972 the popular National Electric Power Authority (NEPA) came into existence by law in Nigeria [9], and was mandated to develop and maintain an efficient, co-ordinated and economical system of electricity supply for all parts of Nigeria. However over the years due to lack of maintenance of equipments, inadequate planning and growth in population, NEPA could not cope and became inefficient at generating and distributing electricity. The incessant power outages which clearly resulted from the difference between the Annual Average Load Demand 330 Pelagia Research Library
et al Adv. Appl. Sci. Res., 2011, 2 (5):329-339 _____________________________________________________________________________
Olaniyi S Maliki
(ALD) and the Instantaneous Annual Peak Load Demand (IAPLD) as seen in Fig.1, was indicative of the fact that over the thirty five years depicted, the electricity company could not meet up, perhaps because of the rapid population growth. Furthermore the fluctuating Power Generation Growth Rate (GGR %) in Fig.2, also reflects this fact. The erratic nature of power supply eventually made Nigerians to coin the phrase ‘Never Expect Power Always’ as an acceptance of the inadequacies of the electricity company. In 1988, the National Electric Power Authority was partially commercialized, supported by an upward review in tariffs. As part of the restructuring effort of the power sector, the Electric Power Sector Reform Act 2005 was enacted. Consequently, the defunct National Electric Power Authority (NEPA) is now known as Power Holding Company of Nigeria (PHCN). The law paved the way for the unbundling of NEPA into the 18 companies– 6 generating companies, 1 transmission company and 11 distributing companies. The generating companies are made up of 2 hydro and 4 thermal (gas based) stations. A summary of the generating stations, types and capacity is given in Table 1. The Nigerian power sector is marked by low generating capacity relative to installed capacity and much of the country's citizens do not have access to uninterrupted supplies of electricity. Table 1 Power Station /Location Lagos Station at Egbin Sapele station at Ogorode Delta TV at Ugheli Afam Oji Ijora Station Lagos Lagos IPP (Enron AES) Abuja IPP Rivers IPP (TransAmadi)
Year Commissioned
Generation Capacity (MW)
1985-1987
1,320
1978-1990
1020
1966-1990
832
1975-1982
710
1956
30
Not functional
1978
60
3 units × 20 MW (2 units working)
Thermal
170
Maximum planned is 270 MW
Thermal
30
Type Thermal (gas) Thermal (gas) Thermal (gas) Thermal (gas) Thermal (coal) Thermal (gas)
Thermal
2000-2002
30
Kainji
Hydro
1968,1976, 1978
760
Jebba Shiroro
Hydro Hydro
1986 1990
540 600
Remarks 6×220MW reheat steam turboelectric unit 6×120 MW steam and 4×75 MW Including 6×100 MW
Some generators require major overhaul All units available Some units require repairs
4. Artificial Neural Network Model Artificial neural network models are based on the neural structure of the brain. The brain learns from experience and so do artificial neural networks. Previous research has shown that artificial neural networks are suitable for pattern recognition and pattern classification tasks due to their nonlinear nonparametric adaptive-learning properties. As a useful analytical tool, ANN is widely applied in analyzing the business data stored in database or data warehouse nowadays. One critical step in neural network application is network training. Generally, data in a company's 331 Pelagia Research Library
et al Adv. Appl. Sci. Res., 2011, 2 (5): (5):329-339 _____________________________________________________________________________
Olaniyi S Maliki
database or data warehouse is selected and refined to form training data sets. Artificial Neural Network is widely used in various branches of engineering and science and their unique property proper of being able to approximate complex and nonlinear equations makes it a useful tool in quantitative analysis. The true power and advantage of neural networks lies in their ability to represent both linear and non-linear linear relationships and in their ability to learn these relationships directly from the data being modeled. Traditional linear models are simply inadequate when it comes to modeling data that contains non-linear linear characteristics. In this paper, one model of neural network is selected among the main network architectures used in engineering. The basis of the model is neuron neu structure as shown in Fig. 2.. These neurons act like parallel processing units. An artificial neuron is a unit that performs a simple mathematical operation on its inputs and imitates the functions of biological neurons and their unique process of learning. From Fig. 3 will have,
The neuron output will be
Fig.3 Mathematical structure of ANN
5. Multi-Layer Perception Artificial Neural Network can be viewed as a mathematical model or computational model that is inspired by the structure or functional aspects of biological neural networks. networks They are characterized in principle by a network topology, a connection pattern, neural activation properties, training strategy and ability to process data. The most common neural network model is the Multilayer Perceptron [6, [6,8,11]. ]. This type of neural network is known as a supervised network because it requires a desired output in order to learn. The goal of this type of network is to create a model that correctly maps the input to the output using historical data so that the model can then be used to produce the output when the desired output is unknown. Fig. 4 shows the block diagram of a single hidden layer multiplayer perceptron (MLP). The inputs are fed into 332 Pelagia Research Library
et al Adv. Appl. Sci. Res., 2011, 2 (5):329-339 _____________________________________________________________________________
Olaniyi S Maliki
the input layer and get multiplied by interconnection weights as they are passed from the input layer to the hidden layer. Within the hidden layer, they get summed then processed by a nonlinear function (usually the hyperbolic tangent). If more than a single hidden layer exists then, as the processed data leaves the first hidden layer, again it gets multiplied by interconnection weights, then summed and processed by the second hidden layer and so on. Finally the data is multiplied by interconnection weights then processed one last time within the output layer to produce the neural network output. To perform any task, a set of experiments of an input output mapping is needed to train the neural network. These data are one of the most important factors to obtain reliable results from any trained ANN. Thus, the training sample data have to be fairly large to contain all the required information and must include a wide variety of data from different experimental conditions and process parameters.
Fig. 4 Structure of the Multilayered Perceptron network with single hidden layer. Node 0 is bias.
5. Learning by Gradient Descent Error Minimization The Perceptron learning rule is an algorithm that adjusts the network weights ��� to minimize the difference between the actual outputs ��� and the target outputs ��� . We can quantify this difference by defining the sum squared error function, summed over all output units i and all training patterns m: � � 1 � ��� � � � ��� � ��� � 2 ��� ���
It is the general aim of network learning to minimize this error by adjusting the weights ��� . Typically we make a series of small adjustments to the weights ��� � ��� � ∆��� until the error � ��� is ‘small enough’. We can determine which direction to change the weights in by looking at the gradients (i.e. partial derivatives) of E with respect to each weight ��� . Then the gradient descent update equation (with positive learning rate η) is given by �� ���
∆��� � �� ���� �which can be applied iteratively to minimize the error. 333 Pelagia Research Library
et al Adv. Appl. Sci. Res., 2011, 2 (5):329-339 _____________________________________________________________________________
Olaniyi S Maliki
For the present study, the output is the forecasted Electrical Power Generated (PG) (Output). The independent variables are the Annual Average Load Demand (ALD) and Instantaneous Annual Peak Load Demand (IAPD) (Inputs). Remark: i) For our analysis we used the ANN algorithm built into SPSS17 software [13]. The algorithm implements automatically the Multi Layer Perceptron neural network with gradient descent learning. ii) In addition the software displays the following useful information in the output: • Network Structure. Displays summary information about the neural network. • Description. Displays information about the neural network, including the dependent variables, number of input and output units, number of hidden layers and units, and activation functions. • Diagram. Displays the network diagram as a non-editable chart. We note that as the number of covariates and factor levels increases, the diagram becomes more difficult to interpret. • Synaptic weights. Displays the coefficient estimates that show the relationship between the units in a given layer to the units in the following layer. The synaptic weights are based on the training sample even if the active dataset is partitioned into training, testing, and holdout data. Note that the number of synaptic weights can become rather large and that these weights are generally not used for interpreting network results. • Network Performance. Displays results used to determine whether the model is “good”. We note that charts in this group are based on the combined training and testing samples or only on the training sample if there is no testing sample. • Model summary. Displays a summary of the neural network results by partition and overall, including the error, the relative error or percentage of incorrect predictions, the stopping rule used to stop training, and the training time. The error is the sum-of-squares error when the identity, sigmoid, or hyperbolic tangent activation function is applied to the output layer. It is the cross-entropy error when the softmax activation function is applied to the output layer. Relative errors or percentages of incorrect predictions are displayed depending on the dependent variable measurement levels. If any dependent variable has scale measurement level, then the average overall relative error (relative to the mean model) is displayed. If all dependent variables are categorical, then the average percentage of incorrect predictions is displayed. Relative errors or percentages of incorrect predictions are also displayed for individual dependent variables. iii) Depending on preferences, numerous other network information can also be displayed. 5. Statistical Technique Regression method is one of the most widely used statistical techniques[7,10]. Multiple regression analysis is a multivariate statistical technique used to examine the relationship between a single dependent variable and a set of independent variables. The objective of the multiple regression analysis is to use independent variables whose values are known to predict the single dependent variable. The effect of independent variables on the response is expressed mathematically be the regression or response function f:
y - dependent variable.
� � � �� , �� , … , �� ; �� , �� , … , ��
334 Pelagia Research Library
et al Adv. Appl. Sci. Res., 2011, 2 (5):329-339 _____________________________________________________________________________
Olaniyi S Maliki
�� , �� , … , �� - regression parameters (unknown!) � - the form is usually assumed to be known The regression model for the observed response variable is written � � � ! � � �� , �� , … , �� ; �� , �� , … , �� � ! !- error in observed value . To find unknown regression parameters "�� , �� , … , �� #, the method of least squares [4] can be applied: �
�
�
� �� , �� , … , �� � �$ % � �% & � � ' % � � �� , �� , … , �� ; �� , �� , … , �� ( %��
�
%��
where � �� , �� , … , �� is the error function or sum of squares of the deviations. To estimate �� , �� , … �� we minimize E by solving the system of equations: �� � 0, * � 1,2, … , + ��� 6. Model Specification and Analysis The regression model to consider in this study takes the Annual Average Load Demand (ALD) and Instantaneous Annual Peak Load Demand (IAPD) as the explanatory variables and Electrical Power Generated (PG) as dependent variable. This is used to obtain a reliable parameter estimates in the regression. The model to be used can be specified as ,- � � ./0, 1.,0
More precisely; ,- � �2 � �� ./0 � �� 1.,0 �2 , �� , �� 3 0. RESULTS AND DISCUSSION Table 2 is obtained from the SPSS output for the analysis of the multiple linear regression relating the Electrical Power Generated (PG) as a function of the Annual Average Load Demand (ALD) and the Instantaneous Annual Peak Load Demand (IAPD). The standard error for each of the variables are indicated in the brackets below the equation as well as the goodness of fit R2. Table 2
Variable ALD IAPD Constant
Coefficient Std. Error 8.740 2.136 .152 1.718 -534.070 874.979
t-statistic 4.092 .088 -.610
Prob .000 .930 .546
335 Pelagia Research Library
et al Adv. Appl. Sci. Res., 2011, 2 (5):329-339 _____________________________________________________________________________
Olaniyi S Maliki
,- � �534.07 � 8.740 ./0 � 0.152 1.,0 (874.979) (2.136) (1.718) 2 R = 0.934 7.1 Computer results for the MLP Network Model Model Summary Table 3 Dependent Variable: PG Training Sum of Squares Error Relative Error Stopping Rule Used
.011 .001 Training error ratio criterion (.001) achieved
Training Time
0:00:00.000
Testing Sum of Squares Error Relative Error
.010 .002
a. Error computations are based on the testing sample Table 4 Hidden Layer parameters Parameter Estimates Predictor
Input Layer
Hidden Layer 1
(Bias) ALD IAPD (Bias) H(1:1) H(1:2)
Predicted Hidden Layer 1 Output Layer H(1: H(1:2) PG 1) -.148 .174 .363 -.259 .020 .-096 .435 1.378 -1.608
Summary The table 5 shows a summary of the results obtained for the statistical and neural network analysis of the electricity data for the prediction of the Electrical Power Generation (PG) of Nigeria. The forecasting ability of the two models is accessed using Mean Absolute Error (MAE), Mean Square Error (MSE), and Root Mean Square Error (RMSE). The results clearly show that Neural Networks, when trained with sufficient data and proper inputs, can better predict the PG. Statistical technique is well established, however their forecasting ability is reduced as the data becomes more complex.
336 Pelagia Research Library
et al Adv. Appl. Sci. Res., 2011, 2 (5):329-339 _____________________________________________________________________________
Olaniyi S Maliki
Fig. 5 Table 5 Comparison of models
Regression ANN
No of Obs 35 35
MAE 0.056
MSE 0.003
RMSE 0.076
0.049
0.0012
0.062
CONCLUSION In this paper, two techniques for modeling and forecasting the electrical power generated of Nigeria: Neural Network and Statistical Technique. The forecasting ability of these models is accessed on the basis of MSE, MAE and RMSE. We have discovered the fact that Neural Networks outperform Statistical technique in forecasting. The field of neural networks is very diverse and opportunities for future research exist in many aspects, including data pre-processing and representation, architecture selection, and application [1,2,8,12]. The next logical step for the research is to improve further the performance of Neural Networks, for this application, perhaps through better training methods, better architecture selection, or better input.
337 Pelagia Research Library
et al Adv. Appl. Sci. Res., 2011, 2 (5):329-339 _____________________________________________________________________________
Olaniyi S Maliki
The study also explored the association between electrical power generated, annual average load demand and instantaneous annual peak load demand in Nigeria (R2 = 0.934). REFERENCES
[1] Azoff E. M., “Neural network time series forecasting of financial market.” John Wiley & Sons Ltd. 1994. [2] Bishop C.M., “Neural Networks for Pattern Recognition,” Oxford University press. 1995. [3] Bayliss, C. R., Transmission and Distribution of Electrical Engineering. “2nd Ed. MPG Books Ltd., Bodmin pp 865-869. 1999. [4] Beenstock M., Goldin E., Nabot D., Energy Economics 21, 168-183. 1999. [5] Hair Anderson, Tatham, Black, “Multivariate Data Analysis,” Pearson Education press. 1998. [6] Massie D, D., Neural Network fundamentals for scientist and engineers, Proceedings of the international conference of efficiency, Costs, Optimization, Simulation and Environmental Aspects of Energy systems and Processes (BCOS ’01), pp. 123-128 Istanbul Turkey. [7] Mendenhall and Beaver, “Introduction to Probability and Statistics,” Ninth Edition, International Thomson Publishing, 1994. [8] NeuralWare, NeuralWorks Predict, Available: http://www.neuralware.com. [9] Olowo B., NEPA Meets the Challenge. African Review. April, pp 42. UK 2002. [10] Regression: A Comparison Report,” Finance India,Vol. xxi , No.3, pp. 923-930. 2007. [11] Sharda R, and Patil R., “Neural Networks as forecasting experts: an empirical test,” Proceedings of the 1990 International Joint Conference on Neural Networks, Vol-I, pp. 491-494, Washington DC, USA. 1990. [12] Swales G, S., and Yoon, Y., Financial Analysts Journal, 48(5). 1997. [13] SPSS17 software, SPSS Inc., http://www.spss.com. 2008.
338 Pelagia Research Library
et al Adv. Appl. Sci. Res., 2011, 2 (5):329-339 _____________________________________________________________________________
Olaniyi S Maliki
Appendix A Energy consumed in relation to generation growth rate and population growth rate [NCC,PHCN, 1993, Census Department, Bureau of Census (for Nigeria) International Data Base] Year 1973 1974 1975 1976 1977 1978 1979 1980 1981 1982 1983 1984 1985 1986 1987 1988 1989 1990 1991
EPG (GWh) 2493 2780 3322 3750 4195 4359 5151 5724 6766 7102 8456 8927 10155 10665 11141 11147 12700 13364 14212
AALD (MW) 284.7 317.55 379.23 428.25 479.07 497.8 588.24 653.68 772.68 811.05 965.68 1019.46 1159.7 1217.94 1272.3 1309.99 1450.34 1526.17 1623.01
IAPLD (MW) 387 457 579 708 767 887 1095 1181 1323 1448 1434 1532 1720 1730 1885 1952 2008 2219 2246
PE (× 10⁵) 54226 55865 57905 59143 60782 62421 64060 65699 67782.1 69865.2 71948.3 74031.4 76114.5 78197.6 80280.7 82363.8 84446.9 86530 89263
GGR (%) 0 0.9594 2.7711 4.2018 5.6893 6.2375 8.8849 10.8002 14.2833 15.4067 19.9325 21.5067 0 0.4185 0.8091 1.0799 2.0885 2.6333 3.3292
PGR (%) 0 0.2519 0.5038 0.7558 1.0075 1.2592 1.5117 1.7633 2.0833 2.4033 2.7233 3.0433 0 0.2456 0.4561 0.6842 0.9132 1.1403 1.4396
Year 1992 1993 1994 1995
EPG (GWh) 15066 14617 14557 15793
AALD (MW) 1720.54 1669.26 1662.46 1803.56
IAPLD (MW) 2382 2330 2446 2452
PE (× 10⁵) 92057 94934 97900 100959
GGR (%) 4.13 3.6616 3.6123 4.6266
PGR (%) 1.7455 2.0604 2.3851 2.7201
1996 1997 1998 1999 2000 2001 2002 2003 2004 2005 2006 2007
15971 15416 16253 16291 15227 17637 21544 22612 24132 24177 23300 23187
1823.84 1760.51 1856.09 1860.43 1738.92 2014.15 2460.32 2582.29 2755.87 2749.59 2660.86 2450.61
2470 2457 2448 2458 2499 2934 3233 3479 3428 3774 3682 3599
104095 107286 110532 113829 117171 120481.3 123791.6 127101.9 130412.2 133722.5 137032.8
4.7727 0 0.4525 0.473 -0.1022 1.2006 3.3126 3.8899 4.7116 4.7359 4.2618
3.0634 0 0.2521 0.5082 0.7678 1.0249 1.2821 1.5392 1.7963 2.0534 2.3106
EPG=Electric Power Generated, AALD=Annual Average Load Demand, IAPLD=Instantaneous Annual Peak Load Demand PE=Population Estimate, GGR=Generation Growth Rate, PGR=Population Growth Rate.
339 Pelagia Research Library