for the in vivo observation of pigmented skin lesions used in dermatology. There is ..... Detection of blue-white veil areas in dermoscopy images using ma-.
Proceedings of the 29th Annual International Conference of the IEEE EMBS Cité Internationale, Lyon, France August 23-26, 2007.
SuB04.5
Comparison of Segmentation Methods for Automatic Diagnosis of Dermoscopy Images Teresa Mendonc¸a, Andr´e R. S. Marc¸al, Angela Vieira Jacinto C. Nascimento, Margarida Silveira, Jorge S. Marques, Jorge Rozeira
Abstract— Dermoscopy is a non-invasive diagnostic technique for the in vivo observation of pigmented skin lesions used in dermatology. There is currently a great interest in the prospects of automatic image analysis methods for dermoscopy, both to provide quantitative information about a lesion, which can be of relevance for the clinician, and as a stand alone early warning tool. The effective implementation of such a tool could lead to a reduction in the number of cases selected for exeresis, with obvious benefits both to the patients and to the health care system. The standard approach in automatic dermoscopic image analysis has usually three stages: (i) image segmentation, (ii) feature extraction and feature selection, (iii) lesion classification. This paper presents a comparison of segmentation methods applied to 50 dermoscopic image analysis, along with a clinical evaluation of each segmentation result performed by an experienced dermatologist.
I. I NTRODUCTION Dermoscopy (dermatoscopy or skin surface microscopy) is a non-invasive diagnostic technique for the in vivo observation of pigmented skin lesions used for dermatology. This diagnostic tool allows for a better visualization of surface and subsurface structures and permits the recognition of morphologic structures not visible by the naked eye, thus opening a new dimension of the clinical morphologic features of pigmented skin lesions [1]. In the last few years there have been significant developments in both dermoscopy and tele-medicine, allowing for improved clinical diagnosis of cutaneous lesions. At present there is great interest in the prospects of an early screening system for teledermatoscopy, based on the automatic analysis of dermatoscopic images. The benefits of such systems are two fold: (1) to provide quantitative information about a lesion that can be relevant for the clinician; (2) to be used as a stand alone early warning tool, with the inherent advantages of time effectiveness and low cost procedures of diagnosis and treatment. It can be said that the desired wide use of dermatoscopy, tele-dermatoscopy and tele-medicine requires effective computer based early warning diagnosis systems. Although there is still considerable work to be done in order to establish a link between the human based criteria Teresa Mendonc¸ a, Andr´e R. S. Marc¸al, Angela Vieira are with Faculdade de Ciˆencias da Universidade do Porto, Departamento de Matem´atica Aplicada, Porto, Portugal. {tmendo, andre.marcal}@fc.up.pt Jacinto C. Nascimento, Margarida Silveira, Jorge S. Marques are with IST-ISR Instituto Superir T´ecnico, Lisboa, Portugal. Jorge Rozeira is with the Departamento de Dermatologia, Hospital Pedro Hispano, Matosinhos, Portugal.
1-4244-0788-5/07/$20.00 ©2007 IEEE
and an automatic analyzer, advances along this path can lead to the implementation of an effective fully automatic system for early warning diagnosis of skin lesions. Therefore a computer based automatic image analyzer have great potential for dermoscopy. The systems can provide meaningful quantitative information to assist the clinical evaluation, and, at a further level, can perform an automatic early screening of skin lesions. The standard approach in automatic dermoscopic image analysis has usually three stages: (i) image segmentation, (ii) feature extraction and feature selection, (iii) lesion classification. However, further developments are still required in order to have a robust and reliable computer based diagnosis tool. The segmentation stage is not a straightforward task due to the great variety of lesions, skin types, presence of hair and so forth. A variety of image segmentation methods have been proposed for this purpose, such as thresholding and gradient vector flow snakes [2], Laplacian filters with zero-crossing [3], [4], hybrid algorithms [5], [6]. Although most segmentation methods are semi-automatic [7], requiring an interaction between the user and the software in order to establish the proper segmentation. Active contours are a popular approach to estimate the organs boundaries in medical applications [8]. Two types of algorithms have been proposed: parametric active contours [9] which adapt a deformable curve until it fits the object boundary and geometric active contours based on level set theory [10]. The geometric models are able to perform topological changes e.g., curve splitting. Despite all the research efforts in this area, most of the algorithms require an initialization of the contour model close to the object boundary since the contour is attracted towards spurious features (outliers) belonging to other objects or produced by the image texture. Recent approaches to overcome this difficulty are the gradient vector flow algorithm based on anisotropic diffusion [11] and the robust algorithms (adaptive snakes and shape-probability data association model) [12]. Once a dermoscopic image is selected, the system should provide an automatic identification (or segmentation) of the lesion, which aims at identifying the lesion and separate it from the background. The algorithm will have to be able to remove noise and other undesired features in the image, and to correctly segment the lesion. A compromise solution might be to have a set of possible segmentation results that
6572
50
50
100
100
150
150
200
200
250
250
300
300
350
350
400
400
450
450
500
500
550
a confidence degree w j to each segment y j and updates them using the EM algorithm [12]. The elastic curve v = [v1 . . . vM ] is estimated by minimizing an energy with two terms E(v) = Eint (v) +
200
300
400
500
600
700
100
200
300
400
500
600
Pa (vi )
(1)
i=1
550 100
M �
700
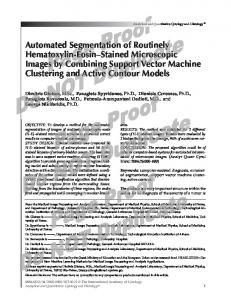
Fig. 1. Image Features: radial directions (left) and detected strokes (right).
will be provided for the user to select. In this paper a detailed comparison of some alternative segmentation methods proposed in the literature for image segmentation is performed. For this purpose three different approaches (Robust Snakes, Level Sets and Adaptive Thresholding) were applied to the segmentation of 50 dermoscopic image analysis selected randomly from the clinical database of the Hospital Pedro Hispano (it has over 4000 cases with dermoscopic images of various types of lesions), as well as a manual segmentation by a non expert. A clinical evaluation was carried out, performed by a dermatologist with over 8 years of experience in dermoscopic image analysis, to access the accuracy of each segmentation result. II. S EGMENTATION M ETHODS The development of a fully automatic system for the extraction of lesions on dermatoscopy images is very difficult, as the images obtained through dermoscopy have a great diversity. A. Robust Snakes (RS) The first method used in this study is a robust active contour algorithm (EM-Snakes), recently proposed in [12]. The EM-Snakes tries to estimate the object contour using elastic models in the presence of cluttered background i.e., some of the features extracted from the image (e.g., edge points) should not attract the model. The EM-Snake is based on two key ideas. First, line segments are detected in the image since they are more reliable than edge points. Second, a robust estimation method is used to fit an elastic curve to relevant segments. This method assigns confidence degrees to the segments and recursively updates them during the estimation process. The edge segments are computed as follows in this work. The user is asked to define two points: a point inside the region of interest and a point on the skin region. The average intensity in both regions is computed and a set of radial lines is defined taking the first point as a center (see Fig. 1a). The edge points are detected along each direction using template matching and they are linked using a standard procedure (two edge points are linked if they belong to consecutive lines and their distance to the center is similar) see Fig. 1b. Classic active contour algorithms approximate the object boundary by an elastic curve attracted by image features. Unfortunately, many of them are outliers and attract the model towards misleading configurations. To tackle this difficulty a robust estimation method is adopted which assigns
where Eint (v) is an internal energy which depends on the curve configuration and P a (vi ) is an adaptive potential given by � � � � j j Pa (vi ) = − w Gσ (yn − vi ) (2) n
j
where ynj is the nth sample of the jth segment and G σ denotes the Gaussian function. The adaptive potential depends on the segment confidence degrees w j , which change during the estimation process. The update of the weights w j and the minimization of the contour energy is performed by the EM algorithm [12]. B. Vector Valued Active Contours - Level Sets (LS) The second method used in this study is the active contour algorithm - Level Sets (LS) proposed in [13] for vector valued images. The algorithm assumes that the image u 0 is formed by two regions of approximately piece-wise constant intensity c1 and c2 separated by a curve C. Considering an image with N channels, each denoted by u 0,i , the following energy function is defined F (c1 , c2 , C) = µlenght(C) N � � 2 1 |u0,i (x, y) − c1,i | dxdy+ λ1 N inside(C)
λ2
i=1 N �
1 N
�
outside(C)
(3)
2
|u0,i (x, y) − c2,i | dxdy
i=1
In this equation the first term is a regularizing term that depends on the length of the curve, µ, λ 1 , λ2 are positive weighting parameters and the last two term are the fitting terms of u0 averaged over all the channels. In the present case, the images have 3 channels corresponding to the RBG color components. The energy function is minimized using the level set method for curve evolution [10], embedding the curve C as the zero level set C(t) = {(�x)|φ(t, �x) = 0} of a higher dimensional level set function Φ(t, �x). The evolution of Φ is given by the following motion Partial Differencial Equation (PDE)
∂Φ = δε (Φ) ∂t
� ∇Φ µdiv |∇Φ| − N � 2 1 λ1 |u0,i (x, y) − c1,i | + N 1 N
i=1 N � i=1
2
λ2 |u0,i (x, y) − c2,i |
(4)
where δε (Φ) is the dirac delta function. Each c 1,i and c2,i is updated by the average of the ith channel u 0,i calculated
6573
inside(C) and outside(C) respectively. The evolution is solved using finite differences. C. Adaptive Thresholding (AT) The third algorithm is a very simple technique based on image thresholding. The color of each pixel is compared with a threshold T and classified as active (lesion) if it is darker than the threshold. The output of this step is a binary image. Morphological pos-processing is then applied to fill the holes and to select the largest connected component in the binary image. It was experimentally found that the blue RGB component is the one which allows the best discrimination of skin lesions and was adopted in this study. The threshold T is automatically updated for each image since the color of skin lesions varies. The threshold was set equal to the darkest color in the dermoscopic image plus a constant offset. Therefore T = T min + T0 where Tmin is the darkest color and T 0 is the offset.
Fig. 2. Segmentation of a dermatoscopic image by the four approaches, from top left, clockwise: Manual (M), Robust Snakes (RS), Level Sets (LS) and Adaptive Thresholding (AT). TABLE I
III. E XPERIMENTAL RESULTS
S UMMARY OF CLINICAL BASED SEGMENTATION PERFORMANCE
The segmentation was performed by Manual Segmentation by a non-specialist (M) and by three automatic methods: Robust adaptive contour - Robust Snakes (RS), Vector valued active contours - Level Sets (LS) and Adaptive Thresholding (AT). Each segmentation result was evaluated by a dermatologist and rated in one of four possible labels: A-very good, B-good, C-fair, D-bad. This clinical evaluation was performed on full sized RGB images with the vector segmentation overlaid. Figure 2 ilustrates the segmentation of a dermatoscopic image whose clinical evaluation rating was very good or good (A/B). The different segmentations produced by the four methods were also compared to each other, using the Hammoude metric [14]. This metric is based on a comparison of the differences between two curves, and is defined by: dH =
#(X ∪ Y ) − #(X ∩ Y ) , #(X ∪ Y )
where X, Y , are binary images such that all pixels inside the curves have label 1 and all the other pixels have label 0. Table I shows the performance of the four segmentation methods, according to the clinical evaluation. The table presents the number of cases rated in each of the four classes by the different segmentation methods, and also the number of times each method was rated with the highest score (HS). As expected, the manual segmentation was the highest rated method, with 56% of images rated very good (A) and 78% rated good or very good (A or B). The best of the automatic methods was the Adaptive Thresholding, which is somehow surprising, as this is the simplest of the three. However, the number of bad cases (D) was high for both this method (17) and for Level Set (16), unlike for Robust Snakes that only had 4 bad cases. The AT method seems to provide either very good or very bad results. It is the highest performer in 21 cases but it is also the worst in
A B C D HS A% (AU B)%
M 28 11 7 4 29 56 78
RS 13 12 20 4 16 26 50
AT 19 12 2 17 21 38 62
LS 9 18 7 16 10 18 54
17 cases. The RS method is a bit more reliable, as it also has a good number HS with very few bad cases. For the LS method, the use of probability density functions [15] could lead to improved results. Considering that the objective might be to have at least a good or very good result provided by one of the automatic methods, this is achieved for 40 out of the 48 images tested, which corresponds to a success rate of 83.3%. If the requirement level is somehow softened, accepting fair results (C) as well, the success rate is increased to 97.9%. This is very encouraging, as all three methods tested are fully automatic and can thus be used to produce three possible segmentations for a lesion. The operator could then select the best choice from the three options presented by the automatic methods. The results of the comparison between the different segmentations produced for each image are summarized in Table II. The table presents the average and variance of the Hammoude index computed for each of the six pairs of segmentation methods. The results indicate that the various segmentations are generally very similar, with a slightly higher resemblance between the M and RS methods. Although the average Hammoude index values might not reveal much about the overall results, an inspection of the results for an individual can provide meaningfull information. For example in Figure 2, the segmentations
6574
TABLE II M EAN AND VARIANCE VALUES FOR THE H AMMOUDE METRIC
M RS AT
mean variance mean variance mean variance
RS 0.16 0.007
AT 0.21 0.037 0.22 0.042
LS 0.21 0.023 0.21 0.022 0.22 0.035
M and LS were rated A in the clinical evaluation and segmentations RS and AT rated B. Visually they all look quite similar, to some extent, which is confirmed by the low values of the Hammoude index for all pairs of segmentations (below 0.11). For this image, the lower Hammoude index was obtained for the pair (M,LS), confirming the human interpretation by the clinic. Another example is presented in Figure 2, where the clinical evaluation was much worst. The M segmentation was rated A, RS rated C and the other segmentations rated D. The Hammoude index is quite high for all pairs of segmentations for this image, between 0.225 and 0.625. Once more, the lowest value corresponds to the pair (M,RS), which was the best clinical options. However, it is worth noting that the clinical rating is somehow subjective. In other cases, two segmentations that visually seem to be very similar (for non-experts), and also having low Hammoude index values, were rated in different clinical classes.
Fig. 3. Segmentation of a dermatoscopic image by the four approaches, from top left, clockwise: Manual (M), Robust Snakes (RS), Level Sets (LS) and Adaptive Thresholding (AT). In this case only Manual present a very good profile and Robust Snakes method present an acceptable profile.
IV. C ONCLUSIONS The present study compares and evaluates different methods for getting adequate segmentation of dermatoscopic images, all suitable for incorporation in an automatic dermoscopic image analyzer. A set of 50 images were manually segmented, by a non-specialist, and segmented with three fully automatic general methods: Robust adaptive contour -
Robust Snakes, Vector valued active contours - Level Sets and Adaptive Thresholding. A clinical evaluation of the results was carried out by an experienced dermatologist, with the images rated in one of four possible labels: A-very good, B-good, C-fair, D-bad. The best of the automatic methods was the Adaptive Thresholding, although the Robust Snakes provided more consistent results. The overall success rate of the combined automatic methods was 83.3% (A and B) and 97.9% (A, B or C). These results are very encouraging, as a system based on these 3 segmentation methods can provide an acceptable lesion segmentation with only a minor intervention from the operator (selecting the best of the 3 proposed results). This can be a valuable tool to reduce the expected subjectivity of the individual clinical analyst. Further research will be directed to the adaptation of the segmentation methods to the particular problem to be solved. R EFERENCES [1] Argenziano, G., Soyer, H.P., De Giorgi, V., et al., Dermoscopy, an interactive atlas. Milan, Italy: EDRA Medical Publishing. (http://www.dermoscopy.org), 2000. [2] Erkol, B., Moss, R.H., Stanley, R.J., Stoecker, W.V. and Hva-tum, E., ”Automatic lesion boundary detection in dermoscopy images using gradient vector flow snakes”. Skin Research & Tech, 2005, 11: 17-26. [3] Rubegni, P., Burroni, M., Cevenini, G., Perotti, R., Dell’Eva, G. and Barbini, P., Fimiani, M. and Andreassi, L., Digital dermoscopy analysis and artificial neural network for the differentiation of clinically atypical pigmented skin lesions: a retrospective study, The Journal of Investigative Dermatology, 2002b, 119(2): 471-474. [4] Burroni, M., Corona, R., Dell’Eva, G., Sera, F., Bono, R., Puddu, P., Perotti, R., Nobile, F., Andreassi, L. and Rubegni, P., Melanoma computer-aided diagnosis: reliability and feasibility study. Clinincal Cancer Research, 2004, 10 (6):1881-1886. [5] Hoffmann, K., Gambichler, T., Rick, A., Kreutz, M., Anschu-etz, M., Grunendick, T., Orlikov, A., Gehlen, S., Perotti, R., Andreassi, L., Bishop, J. N., C´esarini, et al., Diagnos-tic and neural analysis of skin cancer (DANAOS). A multi-centre study for collection and computer-aided analysis of data from pigmented skin lesions using digital dermoscopy. British Journal of Dermatology, 2003, 149: 801809. [6] Tomatis, S., Carrara, M., Bono, A., Bartoli, C., Lualdi, M., Tragni, G., Colombo, A. and Marchesini, R., Automated melanoma detection with a novel multispectral imaging system: results of a prospective study, Physics in Medicine and Biology, 2005, 50: 1675-1687. [7] Celebi, M.E., Kingravi, H.A., Aslandogan, Y.A. and Stoecker, W.V., Detection of blue-white veil areas in dermoscopy images using machine learning techniques. To appear in SPIE Medical Imaging 2006, 2006. [8] McInerney, T. and Terzopoulos, D., Deformable models in medical image analysis: a survey, Medical Imaging Anals, 1996, 1 (2): 91108. [9] Blake, A. and Isarde, M., Active contours, SPRINGER VERLAG, 1998. [10] S. Osher, J. Sethian, Fronts propagating with curvature-dependent speed: Algorithms based on Hamilton-Jacobi equations, Journal of Computational Physics, 1988, 79:12-49. [11] Xu, C. el al., Medical image segmentation using deformable models, SPIE Handbook on medical Imaging, Vol. III, 2000. [12] J. Nascimento, J. S. Marques, Adaptive Snakes Using the EM Algorithm, IEEE Trans. Image Processing, 2005, pp 1678-1686. [13] T. E. Chan, B.Y. Sandberg,L.A. Vese, Active contours without edges for vector-valued images, Journal of Visual Communications amd Image Representation, vol.11, 2000, pp 130-141. [14] A. Hammoude, Computer-assited endocardial border identification from a sequence of two-dimensional echocardiographic images, Ph.D. dissertation, Univ. Washington, Seattle, WA, 1988. [15] N. Paragios and R. Deriche, Geodesic Active Regions and Level Set Methods for Supervised Texture Segmentation, International Journal of Computer Vision, 2002, pp 223-247.
6575