www.ccsenet.org/mas
Modern Applied Science
Vol. 4, No. 7; July 2010
Comparison of Some Chromatic, Mechanical and Chemical Properties of Banana Fruit at Different Stages of Ripeness Mahmoud Soltani (Corresponding author) Department of Agricultural Machinery Engineering Faculty of Agricultural Engineering & Technology, University of Tehran P.O. Box 4111, Karaj 31587-77871, Iran Tel: 98-919-165-7116
E-mail:
[email protected] Reza Alimardani
Associate Professor, Department of Agricultural Machinery Engineering Faculty of Agricultural Engineering & Technology, University of Tehran P.O. Box 4111, Karaj 31587-77871, Iran Mahmoud Omid Associate Professor, Department of Agricultural Machinery Engineering Faculty of Agricultural Engineering & Technology, University of Tehran P.O. Box 4111, Karaj 31587-77871, Iran Abstract The physical, mechanical and chemical properties of banana fruits at different level of ripeness were determined. Relation between stages of banana ripeness and these properties were investigated and correlation coefficients were calculated. A significant difference at 5% level was found between the degree of ripeness and properties of banana fruit. Duncan multiple range test were conducted and results were reported. Comparisons indicated that ultimate strength and a* appropriated the highest correlation coefficient, but mechanical experiments destroyed banana fruits thus were not suitable for ripening process. Keywords: Banana fruit, Ripeness, Physical properties, Comparison 1. Introduction Banana is one of the popular fruits in the world. Banana fruit is grown in many countries in sub-tropical areas and the big exporters are located in South East Asia, South America and the Caribbean. The Cavendish variety is widely produced by these countries. Banana is subsumed third place in the world fruits volume production after citrus fruit and grapes (FAO, 2000). Green-mature banana fruits are transported to consumer countries and ripened in controlled conditions. Imported banana fruits are transported to airtight warehouses with ethylene gas control system and are ripened. During ripening process, many changes are occurred in physical, mechanical and chemical properties of banana fruits. Skin color changes during ripening from green to yellow, firmness is decreased, banana is softened and starch is converted into sugar (Marriott et al., 1981). Investigation of these changes was the subjects of many researches. Finney et al. (1967) evaluated changes in firmness of banana fruit during ripening using sonic technique. Charles et al. (1973) studied on physical, rheological and chemical properties of bananas during ripening. Fernandes et al. (1978) studied changes of some physical properties of silver bananas (M. Paradisiaca) during ripening period. The results of their study showed the average of skin thickness was reduced from almost 4.0 mm to 1.5 mm. The results were correlated to the most important chemical changes in the fruit, such as total acidity, starch reducing and no reducing sugars and soluble solids. Kachru et al. (1995) investigated physical and mechanical characteristics of two varieties of green-mature banana fruit. Kajuna et al. (1997) investigated the textural changes of banana and plantain pulp during ripening. They found that untreated fruits of both varieties had a good correlation between pH and hardness, while treated fruits did not show any correlation between the two properties. Perera et al. (1998) studied physicochemical properties of some local banana cultivars. Saeed Ahmad et al. (2002) conciliated the temperature effect of ripening treatment on properties of banana fruit. Also investigation on reciprocal effect of storage humidity, temperature and fruit length on characteristics of banana fruit were done (Saeed Ahmad et al.,
34
ISSN 1913-1844
E-ISSN 1913-1852
www.ccsenet.org/mas
Modern Applied Science
Vol. 4, No. 7; July 2010
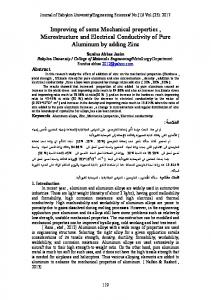
2006). Bok Kim et al. (2009) determined apple firmness by using ultrasonic technique as a quality indicator. They measured apparent elastic modulus and rupture point by a compression test apparatus and correlated these properties with ultrasonic parameters. Salvador et al. (2007) studied the changes in color and texture of banana during storage at 10ºC and 20ºC. They found that during storage, the change in peel color from green to yellow was gradual in the M. Cavendish samples, whereas the M. Paradisiacal variety presented a different pattern, remaining green for the first 8 days and then changing rapidly to a yellow tone from day 12 onwards. While the flesh texture of the M. Cavendish type bananas softened quite rapidly during storage, it evolved more slowly in the M. Paradisiacal variety and there was little variation in the flesh hardness values over the storage time. The objectives of this research were to study the variation of some chromatic properties (L*, a* and b*), mechanical properties (energy required per unit depth of probe penetration and ultimate strength) and chemical properties (TA, TSS, and pH) of banana fruits, to determine the correlation among these properties and stages of banana ripeness and to find the best method to indicate the level of banana ripeness during ripening treatment. 2. Material and Methods Specimens were provided from Kowsar airtight warehouse located in Abyek province in Qazvin, Iran. In this warehouse, ripening period on banana is carried out at six days. Temperature of ripening room was set up to 15.5ºC. Relative humidity in warehouse was controlled between 85%-90%. During ripening, peel color varied from green to yellow. Ripeness is currently assessed visually by comparing the color of the peel with standardized color charts that describe various stages of ripeness. In trade market, seven ripening stages of bananas are usually discerned (Figure 1). Color stage was judged visually using a chart scale provided by SH Pratt & Co. Ltd (Luton, United Kingdom) to categorize bananas based on their level of ripeness. During ripening treatment at first day, banana fruits were at stage one and at the end of sixth day they were at stage six. Banana fruits (Cavendish variety) were selected from imported bananas (Philippine islands) that were ripened in an airtight warehouse with ethylene gas control system. Undamaged bananas of each stage were selected and cut into fingers. The experiment was set up with three replications from each stage. The laboratory tests were done at horticulture department in Faculty of Agricultural Science and Engineering, University of Tehran., Karaj (Iran). Color of banana fruits was measured by colorimeter (Model Konica Minolta CR-400). Positive a* relates to degree of redness of peel, negative a* indicates degree of greenness. Positive b* defines yellowness and negative value of b* represents the blueness. L* is the value of lightness of banana peel (L* = 0 for black and L* = 100 for white). Mechanical properties of specimens were measured by an Instron universal testing machine (Model SANTAM ST-5) controlled by a PC- based data acquisition card in a personal computer. A cylindrical probe with 8 mm diameter was used to penetrate in banana. Head speed was set at 50 mm/min (Saeed Ahmad et al., 2006). The compression test results, calculations and graphs were generated automatically. As the compression initiated and progressed, a load-deformation curve was plotted. After measuring mechanical properties, 10g of pulp was cut from a whole banana and diluted with 50g of distilled water in a blender for one minute and filtered. A hand held refractometer (Model Neerveld 14-B22550, GTEI) was employed to indicate the total solid soluble (TSS) in % Brix. The pH of diluted flesh was measured by pH meter (Ihanna pH 211; Italy). To calculate the titratable acidity (TA), the diluted pulp was titrated with 0.1N NaOH to the end point at pH= 8.1. The TA was expressed as a percentage of malic acid. A randomized complete block experiment design was carried out on experiments. The Duncan multiple range test was employed for mean separation. The level of significance was at 5%. 3. Results and Discussion 3.1 Physical properties Variation in mean values of L* and b* versus stage of banana ripeness is presented in Figure 2. Lowest value of L* was 48.82 and the highest was 70.35 and for b* the values were 27.4 to 45.73 (Table 1). There was a significant difference (P ≤ 0.05) between the stages of banana ripeness for L* and b*. L* increased between stages one and three and reached to 70.35 and stopped until stage six then decreased rapidly to 48.82 at stage seven. Similarly, b* varied in this fashion. Decrease in these parameters was as a result of developing brown spots on skin. Accordingly, it was concluded that L* and b* are not good indicators for assessment of stage of banana ripeness. The values of a* are presented in Figure 3. The a* increased when banana fruits reached to a full-ripe stage. A positive correlation was observed between a* and various stages of banana ripeness. As it was noted, an increase in a* means the degree of greenness was decreased. These changes during ripening period (loss of greenness and increase in reddish) occurred as a result of the breakdown of the chlorophyll in the peel
Published by Canadian Center of Science and Education
35
www.ccsenet.org/mas
Modern Applied Science
Vol. 4, No. 7; July 2010
tissue. It seemed that this parameter is more appropriate for predicting the level of ripeness of banana. Linear estimation of ripeness with a* is shown in Figure 4. The correlation coefficient between stage of banana ripeness and a* was obtained as 0.917. Results of Duncan multiple range test for these characteristics are presented in Table 1. 3.2 Mechanical properties There was a significant difference (P ≤ 0.05) in ultimate strength and energy required per unit depth of probe penetration at different level of ripeness of bananas, too (Table 2). Variations of these parameters are shown in Figure 5. Trend in decrease of ultimate strength and energy required per unit of penetration were similar. It was found that ultimate strength and energy of penetration decreased linearly. It was concluded that these characteristics could be good indicators in the study of banana ripeness. Mechanical properties decreased dramatically between stage one and stage three and then continued to decrease at a slower rate thereafter. This rapid softening corresponds to a commutation of pectic substances (Marriott and Lancaster, 1983). The major defect of this method is its destructivity on specimens that makes it not practical. Correlation between mechanical properties and stages of banana ripeness are presented in Figure 6. Correlation coefficient for ultimate strength and energy required per unit of penetration were -0.91044 and -0.9106, respectively. 3.3 Chemical properties A significant difference (P ≤ 0.05) was found between TA of each stage. Mean values of TA shows that this parameter decreases gradually until the fruit reaches to full-ripe (stage six) then increases at stage seven (Figure 7). It confirms the earlier findings by Olsen and Martin (1980) that total organic acid content declines gradually during fruit maturation, ripening and storage. But at stage seven, an increase in TA was observed because of conversion of sugars to acids. The TA showed an inconsistent pattern of variation. However, the TA varied between various stages of ripeness. It is very difficult to set a specific value of TA as an indicator of the level of ripeness. The pH measurement of data resulted in a significant difference (P ≤ 0.05) which happened through of stages. Irregular variation occurred through ripening stages (Figure 8).The pH decreased at the first stage to stage three, and then an increase was observed until stage seven. Also it is found that acidity of fruit reached to a maximum value at stage three. Because of irregular changes, this indicator is not proper to estimate degree of ripeness. An increase in TSS pending ripening treatment was occurred as shown in Figure 9. Most of the TSS is sugar, thus this parameter is a good indicator of sweetness. During ripening the starch of banana converted to sugar so TSS is increased .This increase was reported by Marriot et al. (1981). At stage seven, TSS was the maximum (21.9 %Brix). Increase of TSS is an important trait of hydrolysis of starch into soluble sugars such as glucose, sucrose and fructose. In order to determine level of ripeness by TSS, it is necessary to destruct fruit and supply diluted pulp for measuring TSS, so this method is not practical in ripening room continually. Figure 10 shows a linear correlation between TSS and stage of banana ripeness. Correlation coefficient was obtained as 0.928. Table 3 shows the mean value of chemical properties (TA, pH and TSS) of banana fruits at different stages of ripeness. 4. Conclusion Some physical, mechanical and chemical properties of banana fruits were investigated in this study. A significant difference was found between these properties and fruit ripeness. At different levels of ripeness, the correlation among these properties with stages of ripeness was found. Results showed a good correlation between mechanical properties and a* existed with levels of ripeness. Extraction of mechanical properties led to destruction of samples. Experts need to enter the ripening room for ripeness distinction which increase energy used as well as a variation in warehouse environmental condition. So, it could only be a good practice in laboratory not at warehouses. The best alternative method of prediction of level of ripeness is to measure a* since it dose note destroy the fruits. It is also a rapid method of indicating ripeness of banana fruit. Use of this technique resolves the above problem and provides an automatic control condition for airtight warehouses. References Ahmad, S., Thompson, A. K., Hafiz, I. A., & ASI, A. S. (2001). Effect of temperature on the ripening behavior and quality of banana fruit. International journal of agriculture & biology, 3(2), 224–227. Ahmad, S., Perviez, M. A., Chatha, Z. A., & Thompson, A. K. (2006). Improvement of banana quality in relation to storage humidity, temperature and fruit length. . International journal of agricultural & biology, 8(3), 377-380. Charles, R. J., & Tung, M. A. (1973). Physical, rheological and chemical properties of bananas during ripening. J. Food Sci, 38, 456-459.
36
ISSN 1913-1844
E-ISSN 1913-1852
www.ccsenet.org/mas
Modern Applied Science
Vol. 4, No. 7; July 2010
Fernandes, K. M., De Carvalho, V. D., & Cal-Vidal, J. (1978). Physical changes during ripening of silver bananas. Journal of Food Science, 44(4), 1254-1255. Finney, E., BenCela, I., & Massie, D. R. (1967). An objective evaluation of changes in firmness of ripening banana using a sonic technique. Food Science, 32(6), 642-646. Kachru, R. P., Kotwaliwale, N., & Balasubramanian, D. (1995). Physical and mechanical properties of green banana (Muss paradisiaca) fruit. Journal of Food Engineering, 26, 369-378. Kajuna, S.T. A. R., Bilanski, W. K., & Mittal, G. S., (1997). Txtural changes of banana and plantain pulp during ripening. J. Sci. Food Agric, 75, 244–250. Kim, K. B., Lee, S., Kim, M. S., & Kwan, B. (2009). Determination of apple firmness by nondestructive ultrasonic measurement. Postharvest Biology and Technology, 52, 44–48. Li, M., David C., Slaughter, D. C., & Thompson J., F. (1997). Optical chlorophyll sensing system for banana ripening. Postharvest Biology and Technology, 12, 273–283. Marriott, J., Robinson, M., & Karikari, S. K. (1981). Starch and sugar transformation during the ripening of plantains and bananas. Journal of Science, Food and Agriculture, 1021-1026. Marriott, J., & Lancaster, P. A. (1983). Bananas and plantains. Handbook of TropicalFoods (Harvey T. and Chan Jr., eds). Marcel Dekker, Inc. New York. 85-143. Perera, O. D. A. N., Basnayake, B. M. K. M. K., & Anjani, M. (1999). Physicochemical characteristics, popularity and susceptibility to anthracnose of some local banana cultivars. J .Natn. Sci. Foundation Sri Lanka, 27(2), 119-130. Salvador, A., Sanz, T., & Fiszman, S. M. (2007).Changes in color and texture and their relationship with eating quality during storage of two different dessert bananas. Postharvest Biology and Technology, 43, 319–325. Subedi, P. P., & Walsh, K. B. (2009). Non-invasive techniques for measurement of fresh fruit firmness. Postharvest Biology and Technology, 51, 297–304. www.applegate.co.uk/food-and-agribusiness/pratt-company Table 1. Mean values of L*, a* and b* at different stages of ripeness Stages of banana ripeness
L*
a* c
-14.055
b* c
32.638c
1
57.44833
2
61.985bc
-9.07b
38.443b
3
70.35a
-4.62b
45.733a
4
65.975ab
-7.67167b
40.9ab
5
65.41667ab
1.186667a
40.41ab
6
67.14167ab
0.911667a
40.29ab
7 48.81833d 2.645a 27.35d In each column, means followed by the same letter are not significantly different (P ≤ 0.05) according to Duncan multiple range test.
Published by Canadian Center of Science and Education
37
www.ccsenet.oorg/mas
Modern Appplied Science
Vol. 4, No. N 7; July 20100
Table 2. Meann values of mecchanical propeerties of bananna fruits at diffe ferent stages off ripeness Stages of o banana ripenness
Ultimaate strength (N N)
Energy reequired per un nit of penetratioon (J/mm)
1
75.13
a
37..61a
2
60.07b
29..95b
3
46.22c
23..09c
4
40.92c
20..48c
5
26.07d
14..42d
6
28.91d
13..43d
7
27.03d
13..32d
In each colum mn, means folloowed by the saame letter are nnot significanttly different (P P ≤ 0.05) accorrding to Duncaan multiple rangee test. Table 3. Meann values of cheemical propertiies of banana ffruits at differeent stages of riipeness S Stage of banan na ripeness
TA
PH a
TSS S
1
00.1876
b
5.0023
7.8f
2
00.1833b
4.667ef
13.22 2e
3
00.163bc
4.662f
16.4d
4
00.1184c
4.774ef
17.41 1c
5
00.0.125c
4.777cd
18bc
6
00.136bc
4.886bc
a 18.6ab
7 00.3529a 4.9933ab 21.9a In each colum mn, means folloowed by the saame letter are nnot significantlly different (P ≤ 0.05) accordding to Duncann multiple rangee test.
Figure 1. Color C chart, SH H Pratt’s & co, (Luton, UK)
38
ISS SSN 1913-1844
E-ISSN 1913-18552
www.cccsenet.org/mas
Moddern Applied Sccience
V 4, No. 7; Juuly 2010 Vol.
Figure 2. Variiation of L* vss. banana ripenness. Vertical lines l represent the 95% confi fidence intervalls
Figure 3. Variation in a* vs. banana ripenness. Vertical liines represent the 95% confiidence intervalls
Figu ure 4. Correlation between a** vs. banana rip peness
Publishhed by Canadiann Center of Scien nce and Educatiion
39
www.ccsenet.oorg/mas
Modern Appplied Science
Vol. 4, No. N 7; July 20100
Figuree 5. Relation bbetween ultimaate strength, ennergy per unit of penetration and banana rippeness. Vertical linees represent thhe 95% confideence intervals
Figure 6. R Relation betweeen mechanicall properties annd stage of banana ripeness
na ripeness. Veertical lines reppresent the 95% % confidence intervals Figure 7. Variation inn TA vs. banan
40
ISS SSN 1913-1844
E-ISSN 1913-18552
www.cccsenet.org/mas
Moddern Applied Sccience
V 4, No. 7; Juuly 2010 Vol.
Figure 8. Chaange in pH vs. banana ripeneess . Vertical liines represent the t 95% confidence intervalls
Figure 9. Channge in TSS vs.. banana ripeneess . Vertical lines l represent the 95% confi fidence intervals
Figure 10. Correlation beetween TSS annd stage of ban nana ripeness
Publishhed by Canadiann Center of Scien nce and Educatiion
41