Comparison of Some Thresholding Algorithms for Text/Background Segmentation in Difficult Document Images Graham Leedham, Chen Yan, Kalyan Takru, Joie Hadi Nata Tan and Li Mian School of Computer Engineering, Nanyang Technological University Blk N4, 2A-32, Nanyang Avenue, Singapore 639798 Email:
[email protected] Abstract A number of techniques have previously been proposed for effective thresholding of document images. In this paper two new thresholding techniques are proposed and compared against some existing algorithms. The algorithms were evaluated on four types of ‘difficult’ document images where considerable background noise or variation in contrast and illumination exists. The quality of the thresholding was assessed using the Precision and Recall analysis of the resultant words in the foreground. The conclusion is that no single algorithm works well for all types of image but some work better than others for particular types of images suggesting that improved performance can be obtained by automatic selection or combination of appropriate algorithm(s) for the type of document image under investigation.
1. Introduction Converting a scanned grey scale image into a binary image, while retaining the foreground (or regions of interest) and removing the background is an important step in many image analysis systems including document image processing. Original documents are often dirty due to smearing and smudging of text and aging. In this paper, we focus on documents where the foreground mainly comprises handwritten text. In some cases, the documents are of very poor quality due to seeping of ink from the other side of the page and general degradation of the paper and ink. A number of thresholding techniques have been previously proposed using global and local techniques. Global methods apply one threshold to the entire image while local thresholding methods apply different threshold values to different regions of the image. The value is determined by the neighborhood of the pixel to which the thresholding is being applied. An early histogram-based global segmentation algorithm, Otsu’s method [4] is widely used. Other
techniques use various iterative methods to arrive at a suitable threshold [1]. Others use local thresholding to calculate the threshold for a window as being the mean value of the maximum and minimum values within the window [2]. Another local method uses gradient [3]. Pixels are identified in, or very close to, areas where sharp changes (edges) exist in the grey level image. The areas with sharp edges are then checked for evidence labeling them as either text or background. Conventional global thresholding methods, which utilize the image grey level histogram, face the difficulty that not all features of interest form prominent peaks. This problem has been investigated using noise attribute features extracted from the image [5]. The noise attribute method makes two assumptions: that the objects of different classes occupy a separable range in the histogram [6] and that the noise attributes in each class are statistically stationary. All the reported thresholding methods have been demonstrated to be effective in constrained preprocessing environments with predictable images. None has proven effective in all cases of general document image processing. In this paper we examine some preprocessing algorithms and assess their effectiveness on ‘difficult’ document image processing problems. The objective is to identify specific algorithms or combinations of algorithms which can be applied to any type of document image to produce effective thresholding.
2. Thresholding Methods We have chosen and developed five algorithms which have shown a superior level of performance on ‘difficult’ images and have investigated each on a range of images.
2.1 Niblack’s Method Niblack’s algorithm [7] is a local thresholding method based on the calculation of the local mean and of local standard deviation. The threshold is decided by the formula:
Proceedings of the Seventh International Conference on Document Analysis and Recognition (ICDAR 2003) 0-7695-1960-1/03 $17.00 © 2003 IEEE
T ( x , y ) = m ( x , y ) + k • s ( x , y ), where m(x, y) and s(x, y) are the average of a local area and standard deviation values, respectively. The size of the neighborhood should be small enough to preserve local details, but at the same time large enough to suppress noise. The value of k is used to adjust how much of the total print object boundary is taken as a part of the given object. Zhang and Tan [8] proposed an improved version of Niblack’s algorithm: s( x, y ) T ( x , y ) = m ( x, y ) • [1 + k • 1 − ], R where k and R are empirical constants. The improved Niblack method uses parameters k and R to reduce its sensitivity to noise.
2.2 Proposed Mean-Gradient Technique A further improved variant of Niblack’s local thresholding [7] approach, based on local mean and local mean-gradient values is proposed here. The gradient of the intensity image I(x,y) is: ∇I ( x, y ) = ∂I ( x, y ) , ∂I ( x, y ) ∂x ∂y The mean-gradient of the intensity image I(x,y) is: ∂I ( x, y ) , ∂I ( x, y ) i −1 j −1 ∂x ∂y G = ∑∑ x∗y x =0 y =0 Gradient is sensitive to noise, so the technique can be improved by adding a pre-condition in selecting a threshold level: if Constant >=R, T ( x, y ) = M ( x, y ) +k •G ( x, y ) , else T ( x , y ) = 0. 5 M ( x , y ) , where k = -1.5, R = 40; parameters M(x,y) and G(x,y) are the local mean and local mean-gradient calculated in a window centered at (x,y); Constant = max grey value – min grey value in a window. If Constant > R, there will be high variance in the local window so that the mean-gradient value can correctly describe the characteristic of the local area.
2.3 Background Subtraction Another new local thresholding technique consists of several steps. First, the background of the image is modeled by removing the handwriting from the original image using a closing algorithm with a small disk as a structuring element. The closing algorithm on a grayscale image where the characters of interest are darker than the background tends to remove these darker areas [10] and therefore is effective in removing dark characters. Second, the background is subtracted from the original document image leaving only the handwriting of interest. Finally, this
difference image is segmented using a global threshold level produced by Otsu’s algorithm multiplied by an empirical constant.
2.4 Quadratic Integral Ratio The QIR (Quadratic Integral Ratio) method [11] is a global two-stage thresholding approach. In the first stage, the image is divided into three classes of pixels: foreground, background and a fuzzy class where it is hard to determine whether a pixel actually belongs to the foreground or the background. During the second stage, a final threshold value is chosen in the fuzzy region.
2.5 Yanowitz and Bruckstein’s Method Yanowitz and Bruckstein [12] suggested using the grey-level values at high gradient regions as known data to interpolate the threshold surface of image document texture features. The key steps of this method are: 1. Smooth the image by average filtering. 2. Derive the gradient magnitude. 3. Apply a thinning algorithm to find the object boundary points. 4. Sample the grey-level in the smoothed image at the boundary points. These are the support points for interpolation in step 5. 5. Find the threshold surface T(x, y) that is equal to the image values at the support points and satisfies the Laplace equation ∂ P( x, y ) ∂ P( x, y ) using =0 + ∂y ∂x Southwell’s successive over relaxation method [13]. 6. Using the obtained T(x,y), segment the image. 7. Apply a post-processing method to validate the segmented image. 2
2
2
2
3. Experimental Results and Discussion The binarization methods were tested on 10 examples of historical handwritten documents, 10 cheque images, 10 form images and 10 newspaper images. The standard measures, precision and recall [14], were used to compare the performance of the proposed methods. Precision and Recall are defined as: Correctly Detected Words , Totally Detected Words Correctly Detected Words Recall = , Total Words Precision =
The four categories of images used to test the algorithms performance had varying resolutions, sizes, as well as contrast to ensure correct comparison of performance of the algorithms. The historical document images were characterized by high resolution of the scanned images with varying contrast of the handwriting.
Proceedings of the Seventh International Conference on Document Analysis and Recognition (ICDAR 2003) 0-7695-1960-1/03 $17.00 © 2003 IEEE
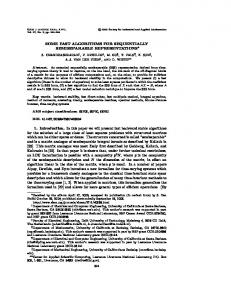
The newspaper images had variations in resolution and printed character sizes. The form images had a mixture of handwriting and printed characters with varying scan resolutions. The cheque images were similar to forms except that they generally had lower resolution with additional low contrast patterns in the background. Some results of the threshold algorithms on sections of these images are shown in Fig. 1. Detailed Precision and Recall results for the 40 images are presented in Table 1. For the human viewer, the Mean-Gradient technique is highly effective as it retains variable grey strokes, and it also retains the small holes in characters. The new technique has shown good performance in all four types of document images. The Background subtraction technique is particularly effective at removing blotches and smudges in the images yet still maintaining the handwriting details. This is because large objects are considered as part of the background in the process, and therefore will be subtracted from the image. For some images with very light strokes, this technique over thresholds, resulting in broken handwriting. Niblack’s method is simple, but it is sensitive to the constant values in the equation. It is difficult to find a single k value that produces good results for different images. The Yanowitz and Bruckstein method was observed to be one of the best binarization methods. However, the computational complexity of the successive over-relaxation method is expensive: O(N3) for an N x N image. The background elimination technique generally achieved better precision and recall than the other methods for all the categories of the images. It removed the seeping and double-sided effect in the historical document images and also performed well for high/low resolution as well as large/small printed characters present in newspapers, forms and cheques. However, since the threshold value is applied globally, it tends to overthreshold some of the weak handwriting resulting in broken handwriting. The Yanowitz and Bruckstein technique uses a mean filter in the preprocessing stage to eliminate the noise. The effect of this filter however is reducing the handwriting contrast and filling holes in both handwriting and printed characters producing thickened characters. The resulting binary images therefore have lower precision and recall values since these characters are not distinguishable especially when the original image has poor resolution as in the forms and cheques images.
4. Conclusion The Mean - Gradient cannot retain much details in an area which has low contrast. We found that a 15 by 15 window size was the best choice. QIR works quite well on images that have two distinct peaks in their histograms, meaning high constant homogeneous images. Due to the fact that the technique
depends on the bimodal histogram, it is not suitable for some images, such as those that have double-side effect as well as those that contain noisy backgrounds. Like many global thresholding techniques, the background subtraction technique sometimes removes the details, especially weak strokes in the document images. However it outperforms some other well know global and local thresholding algorithms when the illumination on the images is not constant. Future work will concentrate on the automatic selection of individual and combinations of thresholding algorithms for separate regions of each image to obtain the best result for the image under investigation.
References [1] D.E. Lloyd, “Automatic target classification using Moment invariants of image shapes”, Technical Report, RAE IDN, Farnborough, UK, Dec 1985. [2] J. Bernsen, “Dynamic thresholding of grey level images”, Proc. Int. conf. Patt. Recogn., 1986, pp. 1251-1255. [3] J. M. White and G. D. Rohrer, “Image thresholding for optical character recognition and other applications requiring character image extraction”, IBM J. Res. Devel., vol. 27 no. 4, 1983, pp.400-411. [4] N. Otsu, “A threshold selection method from grey level histogram”, IEEE Trans. Syst. Man Cybern., vol. 9 no. 1, 1979, pp. 62-66. [5] Hon-Son Don, “A noise attribute thresholding method for document image binarization”, Proc. IEEE, 1995, pp. 231234. [6] Y. Liu and S. N. Srihari, “Document image binarization based on texture features”, IEEE Transactions on PAMI, vol. 19 no. 5, May 1997, pp. 540-544. [7] W. Niblack, An Introduction to Digital Image Processing, pp. 115-116, Prentice Hall, 1986. [8] Z. Zhang and C. L. Tan, “Restoration of images scanned from thick bound documents”, Proc. Int. conf. Image Processing., vol. 1, 2001, pp.1074-1077. [9] Lim, J.S. Two-Dimensional Signal and Image Processing, pp.536-540, Prentice-Hall, New Jersey, 1990. [10] R.C. Gonzalez, and R.E. Woods, Digital Image Processing, pp 554-555, Prentice-Hall, New Jersey, 2002. [11] Y.Solihin, C.G.Leedham, “Integral Ratio: A New `class of Global Thresholding Techniques for Handwriting Images”, IEEE Trans. PAMI, vol.21, no. 8, pp. 761-768, August 1999. [12] S.D. Yanowitz and A.M. Bruckstein, “A new method for image segmentation”, Computer Vision, Graphics and Image Processing, vol. 46, no. 1, pp. 82-95, Apr. 1989. [13] D.L. Milgram, A. Rosenfeld, T. Willet and G. Tisdale, “Algorithms and hardware technology for image recognition”, Final Report to U.S. Army Night Vision Laboratory, 1978. [14] M. Junker, R. Hoch, “On the Evaluation of Document Analysis Components by Recall, Precision, and Accuracy”, Proc. Of 5th ICDAR, India, pp. 713-716, 1999.
Proceedings of the Seventh International Conference on Document Analysis and Recognition (ICDAR 2003) 0-7695-1960-1/03 $17.00 © 2003 IEEE
Proceedings of the Seventh International Conference on Document Analysis and Recognition (ICDAR 2003) 0-7695-1960-1/03 $17.00 © 2003 IEEE
Image No
1
2
3
4
Historical Image: 6
5
7
8
9
10
Average
Preci
Reca
Preci
Reca
Preci
Reca
Preci
Reca
Preci
Reca
Preci
Reca
Preci
Reca
Preci
Reca
Preci
Reca
Preci
Reca
Preci
Reca
M&G
86.67
78.60
78.51
73.08
98.75
98.75
20.26
20.00
86.80
86.80
93.99
93.99
83.19
81.82
67.06
67.06
89.01
89.01
96.12
96.12
80.04
78.52
QIR
78.37
75.81
64.22
53.85
72.50
72.50
71.93
71.30
83.87
82.11
82.22
80.87
84.03
82.64
80.00
80.00
98.90
98.90
100.00
100.00
81.60
79.80
Background
86.57
80.93
87.83
77.69
97.50
97.50
80.87
80.87
86.80
86.80
82.87
81.97
83.71
83.29
91.56
91.56
81.82
81.82
92.86
92.86
87.24
85.54
Yanowitz
51.63
51.63
68.46
68.46
98.75
98.75
71.93
71.30
83.87
82.11
96.17
96.17
93.33
92.56
85.06
85.06
100
100
96.12
96.12
84.53
84.22
Improved N
37.61
37.61
40.63
40.63
76.25
76.25
88.26
88.26
85.56
84.21
79.46
79.46
91.53
91.53
79.51
79.51
73.86
73.86
88.77
88.77
74.14
74.01
Image No
1
2
3
4
Form Image 6
5
7
8
9
10
Average
Preci
Reca
Preci
Reca
Preci
Reca
Preci
Reca
Preci
Reca
Preci
Reca
Preci
Reca
Preci
Reca
Preci
Reca
Preci
Reca
Preci
Reca
M&G
75.25
75.25
53.16
50.75
72.06
72.06
80.00
79.21
100
100
96.25
96.25
99.28
99.28
97.08
97.08
100
100
93.25
92.68
86.63
86.26
QIR
94.06
94.06
95.48
95.48
73.53
73.53
75.25
75.25
91.34
91.34
95.36
90.00
16.67
4.78
22.22
7.02
100
100
98.78
98.78
76.27
73.02
Background
100
100
100
100
96.59
96.59
88.46
88.46
100
100
100
100.
96.90
96.90
96.06
96.06
100
100
95.00
95.00
97.30
97.30
Yanowitz
88.54
88.54
73.74
73.74
14.77
14.77
4.81
4.81
0
0
25.81
25.81
17.56
17.56
21.21
21.21
100
100
2.00
2.00
34.84
34.84
Improved N
63.54
63.54
80.00
80.00
75.00
75.00
12.50
12.50
94.12
94.12
80.00
64.52
27.07
27.07
30.30
30.30
100
100
93.00
93.00
65.55
64.01
1
Image No
2
3
4
Cheque Image 6
5
7
8
9
10
Average
Preci
Reca
Preci
Reca
Preci
Reca
Preci
Reca
Preci
Reca
Preci
Reca
Preci
Reca
Preci
Reca
Preci
Reca
Preci
Reca
Preci
Reca
M&G
95.24
95.24
57.14
54.90
90.32
87.50
80.65
80.65
100
100
67.74
60.00
97.83
97.83
96.97
96.97
84.62
84.62
90.32
77.78
86.08
83.55
QIR
95.24
95.24
47.83
21.57
90.63
90.63
42.86
22.58
37.50
37.50
6.66
2.86
79.17
41.30
100
51.52
11.11
7.69
96.97
88.89
60.80
45.98
Background
88.00
88.00
80.00
80.00
76.19
76.19
84.38
84.38
89.74
89.74
81.48
81.48
93.75
93.75
96.97
96.97
86.67
86.67
66.13
66.13
84.33
84.33
Yanowitz
52.00
52.00
0
0
14.29
14.29
59.38
59.38
79.49
79.49
70.37
70.37
100
100
100
100
0
0
53.23
53.23
52.88
52.88
Improved N
56.00
56.00
55.00
22.86
62.28
62.28
62.50
62.50
58.97
58.97
22.22
22.22
93.75
93.75
96.97
96.97
40.00
40.00
11.29
11.29
55.90
52.68
1
Image No
2
3
4
Newspaper Image 6
5
7
8
9
10
Average
Preci
Reca
Preci
Reca
Preci
Reca
Preci
Reca
Preci
Reca
Preci
Reca
Preci
Reca
Preci
Reca
Preci
Reca
Preci
Reca
Preci
Reca
M&G
86.19
82.35
97.41
97.41
10.90
10.90
99.71
99.71
97.74
97.74
100
100
96.09
96.09
98.56
98.56
70
70
30
30
78.66
78.28
QIR
43.23
42.61
99.60
99.60
1.92
1.92
82.56
82.56
47.65
47.65
100
100
0
0
96.30
96.30
90
90
60
60
62.13
62.06
Background
99.84
99.84
99.80
99.80
80.45
80.45
100
100
98.68
98.68
99.77
99.77
99.73
99.73
99.59
99.59
75
75
40
40
89.29
89.29
Yanowitz
95.54
95.39
99.40
99.40
2.88
2.88
97.67
97.67
100
100
96.98
96.98
100
100
100
100
75
75
50
50
81.25
81.25
Improved N
90.46
90.46
83.86
83.86
3.00
3.00
68.89
68.89
83.24
83.24
93.50
93.50
41.58
41.58
97.95
97.95
60
60
30
30
65.25
65.25
Table 1. Detailed breakdown of the Precision and Recall results for the 40 ‘difficult’ images thresholded using five different algorithms. M&G -----Proposed Mean-Gradient Technique Preci -----Precision QIR -----Quadratic Integral Ratio Technique Reca -----Recall Background -----Background Subtraction Technique Yanowitz -----Yanowitz and Bruckstein Technique Improved N -----Improved Niblack’s Technique
Proceedings of the Seventh International Conference on Document Analysis and Recognition (ICDAR 2003) 0-7695-1960-1/03 $17.00 © 2003 IEEE
Fig His_1_Original
Form_4_Original
Cheque_3_Original
Fig His_1_M&G
Form_4_ M&G
Cheque_3_M&G
Fig His_1_Background
Form_4_ Background
Fig His_1_ImprNiblack
Form_4_ImprNiblack
Fig His_1_QIR
Fig His_1_Yanowiz
Newspaper_6_Original
Newspaper_6_ M&G
Cheque_3_Background Newspaper_6_ Background
Cheque_3_ImprNiblack Newspaper_6_ Background
Form_4_ QIR
Cheque_3_ QIR
Form_4_Yanowiz
Cheque_3_Yanowiz
Newspaper_6_ QIR
Newspaper_6_Yanowiz
Figure 1. Examples of sections of part of each of one of the four types of ‘difficult’ image under investigation and the result of the five threshold methods described. From left to right there is a historical document, a form, a cheque and a newspaper image. From top-to-bottom there is the original image followed by the Mean and Gradient algorithm, the Background Subtraction algorithm, the Improved Niblack algorithm, followed by the Quadratic Integral Ratio and finally the Yanowitz and Bruckstein algorithm.
Proceedings of the Seventh International Conference on Document Analysis and Recognition (ICDAR 2003) 0-7695-1960-1/03 $17.00 © 2003 IEEE