Additionally, med- ical teams use the tumor's characteristics to determine the theranos- tics. While detailed morphometric analysis is one facet of diagnostic.
COMPARISON OF SPARSE CODING AND KERNEL METHODS FOR HISTOPATHOLOGICAL CLASSIFICATION OF GLIOBASTOMA MULTIFORME Ju Han, Hang Chang, Leandro Loss, Kai Zhang, Fredrick L. Baehner, Joe W. Gray, Paul Spellman, and Bahram Parvin Life Sciences Division, Lawrence Berkeley National Laboratory, Berkeley, CA 94720, U.S.A.
ABSTRACT This paper compares the performance of redundant representation and sparse coding against classical kernel methods for classifying histological sections. Sparse coding has been proven an effective technique for restoration, and has recently been extended to classification. The main issue with histology sections classification is inherent heterogeneity, which is a result of technical and biological variations. Technical variations originate from sample preparation, fixation, and staining from multiple laboratories, whereas biological variations originate from tissue content. Image patches are represented with invariant features at local and global scales, where local refers to responses measured with Laplacian of Gaussians, and global refers to measurements in the color space. Experiments are designed to learn dictionaries through sparse coding, and to train classifiers through kernel methods using normal, necrotic, apoptotic, and tumor regions with characteristics of high cellularity. Two different kernel methods, that of a support vector machine (SVM) and a kernel discriminant analysis (KDA), were used for comparative analysis. Preliminary investigation on the histological samples of Glioblastoma multiforme (GBM) indicates the kernel methods perform as good, if not better, than sparse coding with redundant representation. Index Terms— Histology sections, sparse coding, dictionary learning, kernel methods 1. INTRODUCTION Histological sections, typically stained by haematoxylin and eosin (H&E), are widely used in cancer diagnosis, prognosis, and theranostics. In a clinical setting, pathologists examine cellular morphology and tissue organization of a stained histological section under a microscope, and make judgments based on their prior knowledge. However, such a subjective evaluation may lead to considerable variability [1]. Moreover, vast amounts of data generated by pathology laboratories on a regular basis also, creates a demand for the development of a quantitative histopathological analysis. A more automated system would better serve pathologists as a diagnostic aid and contribute to summarization of large scale datasets. However, one of the critical issues with building an automated diagnostic system has to do with the variations associated with sample preparation (e.g., fixative and staining), that originate from different clinical protocols. For example, our data set includes samples that have been frozen and then stained, as well as those that have been paraffin-embedded This research was supported by a grant from National Cancer Institute (U24 CA1437991) and the U.S. Department of Energy under contract number DE-AC02-05CH1131.
and then stained. Furthermore, the visualized color representation is highly variable because of technical and biological inconsistencies. Technical variations originate from heterogeneity in fixation and in the amount of stain that is utilized. On the other hand, biological variations originate from sample type, tissue location, and the health of the tissue. For example, when cells go through apoptosis, they can release some of their protein contents into the nearby region, and as a result, increase the pink content locally. Therefore, the main motivation for evaluating sparse coding and redundant representation is to capture a rich dictionary, where classification error is measured as reconstruction error. However, such a method would then need to be compared with the classical methods, such as kernel methods. Over the past two decades, much research has been conducted on automated histological image analysis [2]. Nakazato et al. developed a method for nuclear grading of primary pulmonary adenocarcinomas based on the correlation between nuclear size and prognosis [3]. Tambasco et al. graded tumors by quantifying the degrees of architectural irregularity and complexity of histological structures based on fractal dimensions [4]. Wittke et al. classified prostate carcinoma by combining morphological characteristics with Euler number. Wang et al. detected and classified follicular lesions of the thyroid gland based on its nuclear structure, which is characterized by shape and texture features [5]. A simple voting strategy coupled with support vector machine was used for classification. Tabesh et al. aggregated color, texture, and morphometric features at the global and object levels for classification of histological images [6]. The performance of several existing classifiers coupled with feature selection strategies were subsequently evaluated. Doyle et al. developed a multi-scale scheme for detecting prostate cancer using high resolution [7] images, where a pixel-wise Bayesian classification was performed at each image scale while an AdaBoost classifier combined discriminating features in a hierarchal manner. Monaco et al. [8] proposed an efficient high throughput screening of prostate cancer using probabilistic pairwise Markov models. Bhagavatula et al. defined a set of histopathology-specific vocabularies for region-based segmentation, which was realized through the neural networks [9]. Recent advances in histological image data analysis hold great promise for large-scale use in advanced cancer diagnosis, prognosis, and theranostics. There is a rapidly growing interest in the development of appropriate technology to address the processing and analysis issues associated with it, including (i) the large dimensions of the digitized samples, (ii) artifacts introduced during sample preparation, (iii) variations in fixation and staining across different laboratories, and (iv) variations in phenotypic signatures across different samples. Here, we investigated emerging methods in dictionary learning and sparse coding, which has been widely applied to image reconstruction and classification [10, 11]. The rest of this paper is
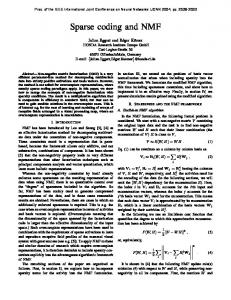
Fig. 1. Four classes of patch-level histology from Glioblastoma multiforme (GBM), which is the one of the most aggressive type of primary brain tumors: first row - apoptotic regions; second row - necrotic regions; third row - high cellularity regions; and fourth row - normal regions. Note that there is a significant amount of heterogeneity in the signature of these samples, which originates from variations in sample preparation among multiple clinics. Each image has 160 × 160 pixels (80 × 80µm).
organized in the following manner: Section 2 describes the computational steps and the detailed implementation. Section 3 discusses the preliminary results of application of sparse coding for classification. Section 4 concludes the paper. 2. TECHNICAL APPROACH Steps for the classification of histological images are summarized below. First, we represented local patches by aggregating invariant features at the global and object levels. Then, class-specific dictionaries were learned for each class through sparse coding. This was accomplished by iteratively removing shared elements among the dictionaries. Finally, classification of histological patches were performed by comparing the error in sparse constrained reconstruction against all dictionaries. 2.1. Histological characterization of tumors Under the light microscope, biological samples have little inherent contrast; therefore, enzymatic staining is used to give both contrast to the tissue as well as to highlight particular features of interest. In histology, Haematoxylin and eosin (H&E stain) is the most commonly used light microscopical stain; the haematoxylin stains the nuclei blue, and eosin stains all protein components pink [12]. Pathologists use certain identifiable tumor characteristics to determine a tumor’s grade and to develop a prognosis. Additionally, med-
ical teams use the tumor’s characteristics to determine the theranostics. While detailed morphometric analysis is one facet of diagnostic capability, global descriptions of the tissue sections in terms of the rate of high cellularity, apoptosis, and necrosis are pathologically important. Here, we focus on classification of tumors associated with Glioblastoma multiforme (GBM), which is the most aggressive type of primary brain tumor in humans. The three different histopathological classes of GBM are apoptosis, necrosis and high-cellularity as shown in Figure 1, which is a small sample of the training set used, having been previously annotated by a pathologist. The significance of this training set is that there is a substantial heterogeneity in the sample signature, which is a result of technical variation in sample preparation. We aim to investigate this issue through the sparse dictionary model. Apoptosis is the process of programmed (e.g., normal) cell death, which can be induced through a varieties of scenario such as chemotherapeutic agents, ultraviolet and γ-irradiation, heat, osmotic imbalance [13]. During apoptosis, individual cells are triggered to undergo self-destruction in a manner that will neither injure neighboring cells nor elicit any inflammatory reaction; therefore, only scattered cells are involved. Cell changes in morphology caused by apoptosis include loss of cell membrane asymmetry and attachment, blebbing, cell shrinkage, nuclear fragmentation, chromatin condensation, and chromosomal DNA fragmentation. Necrosis, on the other hand, is the premature death of cells and tissue induced by
external injuries, such as infection, toxins, or trauma. Unlike apoptosis, necrosis leads to a destruction of a large group of cells in the same area. In necrosis, the chromatin is not marginated, instead, it is unevenly distributed as clumps that are irregular and poorly defined. Moreover, there is no nuclear fragmentation, cellular shrinking, or “body” formation in necrosis. Our objective is to detect and classify the apoptosis, necrosis, and high-cellularity regions in samples that have been prepared at different clinical centers. 2.2. Representation Each image patch of 40 × 40 pixels, at 10× magnification, is represented with global and local invariant features. Global features refers to the basic statistics in the color space (e.g., RGB), which consists of six features (mean and variance in each of the color space). Other color representations, such as HSV, did not improve performance of the classifier. Local representation is based on a multi-scale Laplacian of Gaussian (LoG) blob detector, which was applied on a gray scale images constructed from the ratio of the blue to red and green B ). This ratio image highlights the chromatin conchannels (e.g., R+G tents, which eliminates the needs for higher dimensional representation in the RGB space. The local representation can then be computed by using a direct convolution of the second derivative of the Gaussian kernel with the ratio image, or by computing the difference of two Gaussians for improved performance [14]. The kernel response was measured at four scales (e.g., σ = 1, 2, 3, 4), and at each statistics of filter response (e.g., mean and variance) was computed for each local patch. The main rationale is that apoptotic regions should have a high filter response at lower scales of the LoG filter, while tumor regions should have a higher filter response at higher scales of the LoG filter. We have also experimented with the distribution of the LoG response; however, this representation did not improve the performance of the classifier. The above representation was normalized with a zero mean and variance of one. 2.3. Classification with sparse coding In recent years, sparse representations has proven to be very effective for image reconstruction and classification [10]. The assumption is that the images can be well approximated by a linear combination of a few elements of some redundant basis, which are called dictionaries [11]. The basic ideas of dictionary learning and sparse coding are summarized below. In sparse coding, a signal is represented as a linear combination consists of a few elements from a given dictionary. Given a signal x ∈ Rn and a dictionary D ∈ Rn×k , the sparse representation problem can be stated as mina ||a||0 , s.t. x = Da, where ||a||0 is the number of non-zero elements. An alternative is to solve the unconstrained problem, mina ||x−Da||22 +λ||a||1 , where λ is a parameter that balances the tradeoff between reconstruction error and sparsity induced by ||a||1 . Furthermore, given a set of signals {xi }i=1,...,m in Rn , the dictionary D is learned by optimizing min
D,{ai }i=1,...,m
m ∑
||xi − Dai ||22 + λ||ai ||1
(1)
i=1
with constraints that elements have norm less than one. This optimization problem is then solved using an iterative approach that is composed of two convex steps: the sparse coding step on a fixed D and the dictionary update step on fixed a.
Eq. (1) provides a solution for dictionary learning within each class. Furthermore, given a signal x, the sparse constrained reconˆ struction error can be measured as R(x, D) = mina ||x − Da||22 + ˆ λ||a||1 . Optimizing minC R(x, D ) then leads to a predicted class i i=1 label of x, where C is the number of classes. However, the dictionaries so-obtained may not provide enough discriminating power due to the potential sharing elements among the dictionaries. Ramirez et al. [11] proposed an improved optimization method by adding a dictionary incoherence term as follows: { } mi C ∑ ∑ 2 j min ||Xi − Di Ai ||2 + λ ||ai ||1 + {Di ,Ai }i=1,...,C
i=1
η
∑
j=1
||DTi Dj ||2F
(2)
i̸=j
The solution of this optimization problem can be estimated by iteratively removing a certain percentage of shared elements from each ˆ library. Given a signal x, optimizing minC i=1 R(x, Di ) with the dictionaries learned from Eq. (2) leads to a predicted class label of x, where C is the number of classes. Parameters σ and T are empirically determined for a range of values. Parameters λ and N (library size) are empirically determined for a range of values. 2.4. Classification with kernel-based methods Kernel methods, such as the support vector machine (SVM) and the kernel discriminant analysis (KDA), represent powerful baseline methods for comparative analysis. The motivation for using the kernel methods is that, though the data may not be linearly separable in the original space, by mapping it into a much higher dimensional space, an improved class separation is revealed. These methods use a variety of kernel functions to operate in a higher dimensional space by computing the inner products in that space. For example, SVM constructs a hyperplane or set of hyperplanes in a high or infinite dimensional space for classification. Ideally, good separation is achieved by a hyperplane that has the largest distance to the nearest training data of any class, this is referred to as the functional margin. A modified maximum margin (soft margin) method is further suggested to allow for mislabeled training data [15]. KDA is another kernel method that essentially combines kernel principal analysis (KPCA) and linear discriminant analysis [16]. One possible choice of kernel functions which have been proven useful is Gaussian RBF (radial basis function) with a scaling factor σ. In addition, the rank of the kernel matrix can be large and, therefore, its eigenvectors corresponding to the largest T eigenvalues need to be selected following eigen-decomposition. Parameters σ and T are empirically determined for a range of values. 3. EXPERIMENTAL RESULTS The dataset consists of 61 images of varying sizes that have been collected from the NIH repository of The Cancer Genome Atlas. Two experiments were designed with and without normal tissue; however, in both cases, necrotic (16 images), apoptotic (16 images), and tumor (22 images) patches are annotated by the pathologist. Pixels that are close to the image boundary are removed from the analysis due to the edge effect. A total of 20, 000 pixels (samples) are selected as a library for evaluating each classifier, where each class has 5, 000 pixels, and images in the same class have approximately the same
Table 1. Comparison of classification performance of algorithms: Sparse (classification algorithm based on dictionary learning and sparse coding), KDA, and SVM with linear, quadratic, Gaussian rbf and polynomial kernels. All units are in %. Sparse 3-class 4-class
90.05 85.87
KDA 99.12 79.65
SVM linear 94.27 90.03
SVM quad 91.89 83.47
SVM rbf 91.44 81.84
SVM poly 88.22 82.58
5. REFERENCES [1] S.M. Ismail, A.B. Colclough, J.S. Dinnen, D. Eakins, D.M. Evans, E. Gradwell, J.P. OSullivan, J.M. Summerell, and R.G. Newcombe, “Observer variation in histopathological diagnosis and grading of cervical intraepithelial neoplasia,” Br. Med. J., vol. 298, pp. 707–710, 1989. [2] C. Demir and B. Yener, Automated cancer diagnosis based on histopathological images: a systematic survey, Technical Report, Rensselaer Polytechnic Institute, Department of Computer Science, 2009. [3] Y. Nakazato, Y. Minami, H. Kobayashi, K. Satomi, Y. Anami, K. Tsuta, R. Tanaka, M. Okada, T. Goya, and M. Noguchi, “Nuclear grading of primary pulmonary adenocarcinomas: correlation between nuclear size and prognosis,” Cancer, vol. 116, no. 8, pp. 2011–2019, 2010.
number of representative data points. The computational modules are implemented in MATLAB and integrated with other toolboxes for solving optimization problems of sparse coding and dictionary learning. Table 1 summarizes classification performance using the leave-one-image-out cross-validation. The rationale for adding the normal class is that these patches may come from the Grey matter that is distributed in the cerebral cortex; therefore, morphology of the larger neurons may be interpreted as tumor regions. Introducing this class reduced classification performance across the board by approximately 4.5%. Our analysis indicates that sparse and redundant representation itself did not advance classification accuracy. Moreover, although KDA outperformed SVM in the 3-class problem, it under-performed SVM in the 4-class problem. This is potentially due to the fact that we only used 2000 training samples in KDA, while we used all available training samples in SVM. The lower sample size in KDA training has to do with its inherent computational complexity and the large search space in the parameter setting (e.g., σ and T ). In this 3-class classification problem, the clusters have less overlap and, therefore, the lower sample size may not be an issue. KDA achieved better performance by denoises the data through dimensionality reduction. However, in the 4-class classification problem, the limited number of training samples may not have been sufficient for a complete representation. Our current efforts are to build an extensive library of training samples and to develop efficient and effective strategies for the classification of the entire tissue section in a large scale database.
4. CONCLUSIONS In this paper, we presented an approach for automatic classification of tissue histology based on dictionary learning and sparse coding, which we later compared with the traditional kernel methods. Histological images are processed and represented by a number of invariant features at the global and object levels. Class-specific dictionaries are then learned for each class through sparse coding by iteratively removing shared elements among the dictionaries. Classification of each patch is performed by comparing the reconstruction error among all dictionaries. The classifier performance is then compared with two kernel methods, that of SVM and KDA. The training data was selected to represent inherent heterogeneity that is present from multiple laboratories. Preliminary data indicates the kernel methods tend to perform better than sparse coding. Our current efforts are to construct an expanded training set and to classify the entire tissue section for a larger database.
[4] M. Tambasco, B.M. Costello, A. Kouznetsov, A. Yau, and A.M. Magliocco, “Quantifying the architectural complexity of microscopic images of histology specimens,” Micron, vol. 40, no. 5, pp. 486–494, 2009. [5] W. Wang, J.A. Ozolek, and G.K. Rohde, “Detection and classification of thyroid follicular lesions based on nuclear structure from histopathology images,” Cytometry A, vol. 77, no. 5, pp. 485–494, 2010. [6] A. Tabesh, M. Teverovskiy, H.Y. Pang, V.P. Kumar, D. Verbel, A. Kotsianti, and O. Saidi, “Multifeature prostate cancer diagnosis and gleason grading of histological images,” IEEE Trans Med Imaging, vol. 26, no. 10, pp. 1366–1378, 2007. [7] S. Doyle, A. Madabhushi, M. Feldman, and J. Tomaszeweski, “A boosting cascade for automated detection of prostate cancer from digitized histology,” IEEE Trans Inf Technol Biomed, vol. 9, no. Pt 2, pp. 504– 511, 2006. [8] JP Monaco, JE Tomaszewski, MD Feldman, Hagemann I, Moradi M, Mousavi P, Boag A, Davidson C, Abolmaesumi P, and Madabhushi A, “High-throughput detection of prostate cancer in histological sections using probabilistic pairwise markov models,” Medical Image Analysis, vol. 14, no. 4, pp. 617–629, 2010. [9] R. Bhagavatula, M. Fickus, W. Kelly, C. Guo, J.A. Ozolek, C.A. Castro, and J. Kovacevic, “Automatic identification and delineation of germ layer components in h&e stained images of teratomas derived from human and nonhuman primate embryonic stem cells,” in Proc. IEEE International Symposium on Biomedical Imaging: From Nano to Macro, 2010, pp. 1041–1044. [10] J. Mairal, F. Bach, J. Ponce, and G. Sapiro, “Online dictionary learning for sparse coding,” in International Conference on Machine Learning, 2009, pp. 689–696. [11] I. Ramirez, P. Sprechmann, and G. Sapiro, “Classification and clustering via dictionary learning with structured incoherence and shared features,” in IEEE Conference on Computer Vision and Pattern Recognition, 2010, pp. 3501–3508. [12] J.A. Kiernan, Histological and Histochemical Methods: Theory and Practice (4th ed.), Scion, Bloxham, UK, 2008. [13] Y. Soini, P. Paakko, and V.P. Lehto, “Histopathological evaluation of apoptosis in cancer,” Am J Pathol., vol. 153, no. 4, pp. 1041–1053, 1998. [14] Q. Yang and B. Parvin, “Harmonic cut and regularized centroid transform for localization of subceullar structures,” IEEE Transactions on Biomedical Engineeing, vol. 50, no. 4, pp. 469–475, April 2003. [15] C. Cortes and V. Vapnik, “Support-vector networks,” Machine Learning, vol. 20, no. 3, pp. 273–297, 1995. [16] G. Baudat and F. Anouar, “Generalized discriminant analysis using a kernel approach,” Neural Computing, vol. 12, no. 10, pp. 2385–2404, 2000.