APPLIED AND ENVIRONMENTAL MICROBIOLOGY, May 2001, p. 2156–2166 0099-2240/01/$04.00⫹0 DOI: 10.1128/AEM.67.5.2156–2166.2001 Copyright © 2001, American Society for Microbiology. All Rights Reserved.
Vol. 67, No. 5
Comparison of Statistical Methods for Identification of Streptococcus thermophilus, Enterococcus faecalis, and Enterococcus faecium from Randomly Amplified Polymorphic DNA Patterns GIANCARLO MOSCHETTI,1 GIUSEPPE BLAIOTTA,1 FRANCESCO VILLANI,1 SALVATORE COPPOLA,1 AND EUGENIO PARENTE2* Dipartimento di Scienza degli Alimenti, Universita ` degli Studi di Napoli “Federico II,” 80055 Portici,1 and Dipartimento di Biologia, Difesa, e Biotecnologie Agro-Forestali, Universita ` degli Studi della Basilicata, 85100 Potenza,2 Italy Received 29 September 2000/Accepted 18 February 2001
Thermophilic streptococci play an important role in the manufacture of many European cheeses, and a rapid and reliable method for their identification is needed. Randomly amplified polymorphic DNA (RAPD) PCR (RAPD-PCR) with two different primers coupled to hierarchical cluster analysis has proven to be a powerful tool for the classification and typing of Streptococcus thermophilus, Enterococcus faecium, and Enterococcus faecalis (G. Moschetti, G. Blaiotta, M. Aponte, P. Catzeddu, F. Villani, P. Deiana, and S. Coppola, J. Appl. Microbiol. 85:25–36, 1998). In order to develop a fast and inexpensive method for the identification of thermophilic streptococci, RAPD-PCR patterns were generated with a single primer (XD9), and the results were analyzed using artificial neural networks (Multilayer Perceptron, Radial Basis Function network, and Bayesian network) and multivariate statistical techniques (cluster analysis, linear discriminant analysis, and classification trees). Cluster analysis allowed the identification of S. thermophilus but not of enterococci. A Bayesian network proved to be more effective than a Multilayer Perceptron or a Radial Basis Function network for the identification of S. thermophilus, E. faecium, and E. faecalis using simplified RAPD-PCR patterns (obtained by summing the bands in selected areas of the patterns). The Bayesian network also significantly outperformed two multivariate statistical techniques (linear discriminant analysis and classification trees) and proved to be less sensitive to the size of the training set and more robust in the response to patterns belonging to unknown species. both the position and the intensity of bands are measured with image analysis software (3, 28, 31). Although unknown isolates can be assigned to a species on the basis of their similarity to identified strains, this approach is still more adequate for classification than for identification (as defined in reference 29). In fact, the observed intraspecific similarity levels may be as low as 40%, the metric and ultrametric conditions for best performance of hierarchical cluster analysis (9) are not necessarily met, the calculation of similarity or distance measures and clustering must be repeated for the classification of new isolates, and the fuzzy nature of RAPD-PCR patterns (with the occurrence of major and minor bands) may complicate the analysis. Once a database of identified patterns is available, discriminant analysis (20) or regression and classification trees (CT) (4) may be used to assign unknown patterns to established groups (species). In linear discriminant analysis (LDA), the linear functions (canonical variables) of the variables that provide the best discrimination of cases in two or more predefined groups are estimated, and cases are attributed to the group for which the classification function provides the highest value or, equivalently, to the group whose centroid is nearest. Canonical scores, Mahalanobis distances, and posterior probabilities are also calculated. Violation of the statistical assumptions often has a minor effect (20), making LDA a popular technique. CT are an appealing alternative to LDA. The data set is divided into a series of branches using the value of a splitting variable at the nodes chosen to minimize a loss function; this procedure effectively results in a dichotomic key for the identification of
A large variety of genotypic and phenotypic methods are currently used for the identification and classification of microorganisms (32). Many of these techniques generate complex patterns whose interpretation for classification and identification purposes requires multivariate statistical techniques. Randomly amplified polymorphic DNA (RAPD) PCR (RAPDPCR) is one of the most popular genotypic typing techniques. It was developed to reveal intra- and interspecific differences in bacterial genomes (33, 35), and since it can be performed not only on purified DNA (35) but also on untreated (19) or lysed cells without DNA extraction (23), it can replace time-consuming restriction endonuclease analysis in strain typing and DNADNA hybridization techniques for species identification. In fact, RAPD-PCR has been used for the classification of a variety of food-borne microorganisms, including Saccharomyces spp. (21), Bacillus spp. (30), Lactococcus spp. (31), Lactobacillus spp. (3, 7, 28), Penicillium spp. (8), and Streptococcus and Enterococcus spp. (23). Statistical treatment of RAPD-PCR patterns usually involves calculation of a similarity matrix and use of hierarchical cluster analysis for grouping of the patterns. Similarity can be calculated using the formula of Nei and Li (24) when only the presence or the absence of bands is scored (21, 23), while Pearson’s product-moment correlation coefficient is used when
* Corresponding author. Mailing address: Dipartimento di Biologia, Difesa, e Biotecnologie Agro-Forestali, Universita` degli Studi della Basilicata, Campus di Macchia Romana, 85100 Potenza, Italy. Phone: 39–0971-205561. Fax: 39–0971-205561. E-mail:
[email protected]. 2156
VOL. 67, 2001
RAPD-PCR IDENTIFICATION OF THERMOPHILIC STREPTOCOCCI
2157
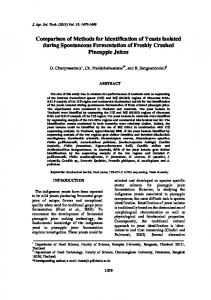
FIG. 1. (A) Schematic representation of an artificial neuron. The neuron is a simple processing unit connected to other neurons by synapses. A synaptic weight (wi) is associated with each synapsis. An output y is produced by using the weighted sum (z ⫽ ⌺xiwi) of its inputs (xi; x0 is fixed, and the product x0w0 is known as bias) as an argument of the activation function f(z). Different types of activation functions (nonlinear sigmoid functions as the logistic and hyperbolic tangent, but also threshold or linear functions) can be used. (B) Architecture of the ANNs used in this study. All types of networks used as an input the number of bands in selected molecular weight (in kilobases) intervals of the RAPD-PCR patterns and had three output nodes, one for each of the three species to be identified (EFM, E. faecium; EFS, E. faecalis; and ST, S. thermophilus). Both the MLP and the BN had a hidden layer with five nodes and used hyperbolic tangent activation functions, but they differed in the algorithm used to iteratively adjust the synaptic weights during supervised training (see the text for details). The hidden layer of the RBF was made up of 25 centers. For each of these, the Euclidean distance between an input pattern and the center was used as an argument of a nonlinear radial basis function, and the result was passed to the output nodes, which in turn had a linear activation function. The number and coordinates of the centers in the input space and the synaptic weights of the output neurons were adjusted during supervised training.
cases. However, the efficiencies of both of these techniques may be reduced by violation of the underlying statistical assumptions and by the inadequacy of the database used to build the models. Artificial neural networks (ANNs) are a valuable alternative to multivariate statistical methods for the analysis of data structures which are complex, nonlinear, fuzzy, probabilistic, and inconsistent (15). ANNs simulate in software the behavior and properties of biological neural networks, such as the human brain. An ANN is made of simple processing units, called neurons (Fig. 1). Artificial neurons are linked in a variety of architectures to other neurons by means of connections called synapses, making up a network. Neurons in the input layer receive stimuli from the “external” environment, while neurons in the hidden and output layers receive their inputs from other neurons and produce outputs by using the weighted sum of inputs as an argument for an activation function. The synaptic weights are adjusted during a training process using a learning algorithm. Thus, ANNs learn to perform their task by experience, and their knowledge is stored in the synaptic
weights. The learning process can be supervised (i.e., each set of input signals is paired with the desired response during training) or unsupervised (i.e., no response is paired to the input patterns and the network is allowed to create its own representation of the data). After training is completed, ANNs can be used repeatedly to solve a given identification, classification, or prediction problem. Important properties of properly designed and trained ANNs are as follows (15): (i) their ability to generalize, i.e., to provide reasonable outputs to inputs not seen before; (ii) their ability to process nonlinear problems, due to the presence of multiple layers of neurons and/or to the use of nonlinear activation functions; and (iii) their fault tolerance, i.e., their ability to produce reasonable outputs even if inputs are degraded (for example, because of missing or inconsistent data). Several types of supervised ANNs have been used for identification problems. The most popular model is the Multilayer Perceptron (MLP) trained by a backpropagation algorithm, but a Radial Basis Function network (RBF) or a Bayesian network (BN), which differ in architecture and/or in the train-
2158
MOSCHETTI ET AL.
APPL. ENVIRON. MICROBIOL. TABLE 1. List of microbial strains used in this study
Groupa
a
Streptococcus thermophilus
T
Enterococcus faecium
CNRZ: 302; NCDO: 573 , 821, 822, 1968; CRAA: 45, 51, 207, 208, 221, 226, 229, 251, 256, 263, 261, 267, 268, 284, 286, 288, 289, 292, 297, 299, 303, 305, 308, 315, 327, 333; DBPZ: S0205, S0403, S0405, S0502, S0505, S0605, S0804, S0902, S1004, S1203, S1304, S1404, S1503, S1601, S1703, S1804, S2103, SY; DISAABA: CF1, CF4, LC29, L1, LP25, LP30, LP45, LP75; IMAUN: 7C17, 8C6, 8C11, 9C4, 9C9, 9C9a, Y1C, Y5C, Y13C ATCC: 19433T; DBPZ: EF1; DISAABA: LC1, LC5, LC12, LC18, LC24, LC28, LC30, LC31, LC36, LP16, LP21, LP26, LP36, LP51, LP77, LP79, LP81 ATCC: 19434T; DISAABA: LC11, LC15, LC40, LP4, LP18a, LP42, LP68
Streptococcus thermophilus Streptococcus salivarius Streptococcus spp.c Enterococcus faecalis Enterococcus faecium Enterococcus durans Enterococcus gallinarum Enterococcus spp.
DBPZ: S317, S901b; TH: 169T, 174T, 176T, 421T, 426T, 434T, 435T, 475T, 678T, 681T DSMZ: 20560T CRAA: 59, 75, 232, 240, 243, 244, 248, 252, 253 DBPZ: S211, S224, S228, S807a, S821b; TH: 536T DBPZ: S309; TH: 538T, 649T TH: 481T, 640T TH: 479T, 564T DBPZ: S214, S222, S313, S314, S320, S818, S906c; TH: 512T, 514T
Enterococcus faecalis
b
Strain(s)b
Species
a
a, strains used for building statistical models and ANNs; b, other strains. Strain sources: ATCC, American Type Culture Collection, Manassas, Va.; CNRZ, Centre National de la Recherches Zootechniques, Jouy-en-Josas, France; CRAA, Consorzio per la Ricerca Applicata in Agricoltura, Faculty of Agriculture, Portici, Italy; DBPZ, Dipartimento di Biologia, Difesa, e Biotecnologie AgroForestali, Potenza, Italy; DISAABA, Dipartimento di Scienze Ambientali Agrarie e Biotecnologie Alimentari, Sassary, Italy; DSMZ, Deutsche Sammlung von Mikroorganismen und Zelkulturen, Braunschweig, Germany; IMAUN, Istituto di Microbiologia Agraria, Universita` degli Studi di Napoli “Federico II,” Portici, Italy; NCDO, National Collection of Dairy Organisms, now National Collection of Industrial and Marine Bacteria, Aberdeen, United Kingdom; TH, Veneto Agricoltura, Istituto per la Qualita` e le Tecnologie Agroalimentari, Thiene, Italy. c Streptococcus spp. were not identified to the species level, but their phenotypes and genotypes were clearly different from those of S. thermophilus or enterococci. b
ing algorithm (Fig. 1), can also be used (15, 34; networks are discussed in Neural Connection 2.0 User’s Guide, SPSS Inc., Chicago, Ill.). Requirements (metric or statistical) on the input data for ANNs are less stringent than those for corresponding statistical methods (regression analysis, discriminant analysis, cluster analysis, and so forth); continuous, categorical, and symbolic data can be easily analyzed with supervised and/or unsupervised networks, which often prove to be superior to and more robust than conventional statistical or modeling approaches (15). ANNs have been successfully exploited for the identification of microorganisms at the genus, species, or strain level using complex patterns, such as restriction patterns (5), whole-cell protein analysis (12), signature lipid biomarkers (2), pyrolysismass spectrometry (10, 14), fatty acid composition (11, 12), flow cytometry data (34), and phenotypic characters (16), and for the interpretation of patterns generated for the analysis of microbial communities (25, 26). Although supervised ANNs have recently been applied to the separation of Registered Designation of Origin fermented foods from different areas based on metabolic profiles of lactic acid bacteria (18), to our knowledge there is no report of the application of ANNs for the identification of industrially important bacteria. Streptococcus thermophilus and other thermophilic streptococci, including Enterococcus faecalis and Enterococcus faecium, are among the dominant members of the microflora of many cheeses produced with the use of natural starter cultures (6, 13, 17, 22, 27). The identification of thermophilic streptococci with phenotypic tests is often not conclusive, due to the frequent occurrence of abnormal biochemical patterns in strains isolated from natural populations (23). Because of the industrial importance of thermophilic streptococci and of the potential public health significance of some enterococci (13), rapid and reliable techniques for the identification and typing of these species are needed. In a previous work (23), a poly-
phasic approach (32) was used for the classification of thermophilic streptococci isolated from dairy sources; RAPD-PCR proved to be an effective tool for both identification and typing of S. thermophilus, E. faecalis, and E. faecium. However, two different primers were needed, and the traditional approach to the analysis of data (calculation of a similarity matrix and hierarchical cluster analysis) was cumbersome and time-consuming. The objective of this work was therefore to compare ANNs with multivariate statistical techniques (cluster analysis, LDA, and CT) in order to determine the best method for the identification of S. thermophilus and some enterococci based on RAPD-PCR patterns. MATERIALS AND METHODS Bacterial strains. A total of 138 strains of thermophilic streptococci from several sources (Table 1) were identified at the species or genus level using phenotypic and/or genotypic tests as S. thermophilus (79 strains), Streptococcus salivarius (1 strain), Streptococcus spp. (9 strains), E. faecium (11 strains), E. faecalis (25 strains), Enterococcus durans (2 strains), Enterococcus gallinarum (2 strains), and Enterococcus spp. (9 strains). RAPD-PCR assay. The RAPD-PCR conditions used with primer XD9 (5⬘GAAGTCGTCC) were described previously (23). Since the objective of this work was identification at the species level rather than strain typing, this primer was selected because it resulted in reproducible (⬎95% similarity in replicate runs performed with the same strain) patterns with 5 to 14 bands (Fig. 2) and had a slightly lower discrimination index than primer XD8 (23). The sizes of all bands were visually recorded by three trained operators. Use of cluster analysis for the classification of RAPD-PCR patterns. Hierarchical cluster analysis (unweighted pair group method with arithmetic means [UPGMA]) was carried out on the matrix of similarity data obtained using the formula of Nei and Li (24): Fxy ⫽ 2nxy/(nx ⫹ ny) where Fxy is the proportion of the reproducible bands common to the patterns compared, nxy is the number of bands shared by both strains, and nx ⫹ ny is the total number of reproducible bands in both strains. Comparison of supervised ANNs for the identification of thermophilic streptococci. Three supervised ANNs (MLP, RBF, and BN) (Fig. 1) were initially compared for their ability to identify S. thermophilus, E. faecalis, and E. faecium
VOL. 67, 2001
RAPD-PCR IDENTIFICATION OF THERMOPHILIC STREPTOCOCCI
2159
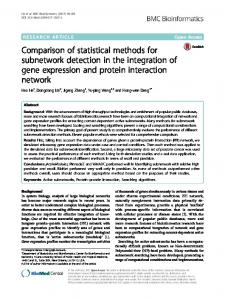
FIG. 2. Ethidium bromide-stained 1.5% (wt/vol) agarose gel displaying RAPD patterns of 32 strains of thermophilic streptococci obtained with primer XD9 (5⬘GAAGTCGTCC). Strain designations are shown above the lanes. Lane M, 1-kb DNA ladder (Gibco BRL) used as molecular size marker.
on the basis of simplified RAPD-PCR patterns with seven groups of bands as an input. In fact, to obtain a reasonable compromise between reduction of the amount of data for processing and preservation of information on strain diversity, the gel was subdivided into seven zones (⬎2.7, 2 to 2.7, 1.6 to 2, 1 to 1.6, 0.75 to 1, 0.5 to 0.75, and ⬍0.5 kb) and bands in each zone were summed. All networks had three output nodes, one for each species to be identified; a pattern was identified as belonging to the species whose node gave the lowest output. The MLP and the BN had similar architectures (seven input nodes, five hidden nodes, and three output nodes; the number of hidden nodes was set using the automatic node generation facility provided by the software) but different training strategies; a conjugate gradient algorithm was used to minimize the error sum of squares between training examples and network outputs for the MLP, while the algorithm used in BN minimized a cost function by using Bayesian statistics and steepest descent (15; SPSS Neural Connection 2.0 User’s Guide). The RBF had a completely different structure (Fig. 1); computations in the hidden layer were performed by radial basis functions (thin-plate spline) which measured the distance of the data from nodes (centers) in the data space, while neurons in the output layer had a linear activation function. The number of centers (25 centers were used in the final configuration) and their positions were adjusted during training, a process which was therefore equivalent to finding the multidimensional surface which provides the best fit for the training set. Ninety-three strains whose identification was confirmed with both genotypic and phenotypic tests were used for training and testing of the networks (Table 1, group a). Since unequal numbers of patterns were available for the three species (67 S. thermophilus strains, with 53 different patterns; 19 E. faecalis strains, with 11 patterns; and 8 E. faecium strains, with 8 different patterns), the patterns for enterococci were randomly duplicated until approximately equal numbers of examples were available for all species. Patterns were randomly assigned to training (80% of the data, used by the supervised learning algorithms to obtain error measures between network outputs and examples and to guide the adjustment of synaptic weights or center coordinates), validation (10%, used during training to validate the results and avoid overtraining and loss of generalization ability), and test (10%, used to cross validate the performance of the network after training) sets. Because of the approach used for training, the BN does not need a validation set, since overtraining is automatically prevented by its learning algorithm (15; SPSS Neural Connection 2.0 User’s Guide). Assignment of cases
and training were repeated 15 times, and the percentage of correct identifications was scored. Comparison of BN, LDA, and CT for the identification of thermophilic streptococci. The same set of 93 RAPD-PCR patterns (188 patterns after random duplication of E. faecium and E. faecalis patterns) was used to compare the abilities of the best ANN selected in the previous experiment (BN) and two multivariate statistical techniques (LDA and CT; the phi coefficient was used as a loss function for CT) to identify S. thermophilus, E. faecalis, and E. faecium from simplified (seven groups of bands; see above) RAPD-PCR patterns. To evaluate the accuracies of the three methods and the effect of the size of the sample used for training the ANN or for building the statistical models, patterns were randomly assigned to two sets: a training set, which was used for building the models, and a test set, which was used to evaluate model performance. The size of the training set was decreased from 90 to 40% of the data set, and the size of the test set was correspondingly increased from 10 to 60%. For each sample size, random assignment of patterns and calculations were repeated five times, and the percentages of correct identifications for both training and test sets were scored. To evaluate the robustness of the three techniques, two different approaches were used: identification of unknown patterns (Table 1, group b, including strains belonging to species not used during the training stage) and evaluation of the correlation between the identification results for the same pattern read by different operators. The whole set of RAPD-PCR patterns (groups a and b in Table 1) read by a single operator was identified using the three techniques. In addition to species assignment, probabilities (for LDA) and network outputs (for BN) were also calculated. Moreover, identification results were estimated for each pattern read by three different operators, and percentages of matching identifications were calculated. Software. ANNs were developed using Neural Connection 2.0 (SPSS). Statistical analysis and graphics were generated with Systat 7.0 for Windows (SPSS).
RESULTS Use of RAPD-PCR with primer XD9 and cluster analysis for the identification of thermophilic streptococci. RAPD-PCR
2160
MOSCHETTI ET AL.
with a single primer (XD9), which yielded distinctive and reproducible patterns with 5 to 14 bands (Fig. 2), was coupled with cluster analysis; the combination was evaluated as a technique for the rapid identification of thermophilic streptococci. The abridged dendrogram showing the similarity relationships among the RAPD-PCR patterns for the 138 strains listed in Table 1 is shown in Fig. 3. Five main clusters were found at the 40% similarity level. Although almost all S. thermophilus strains were found in cluster 3 (with the exception of strains S317 and S901b, whose identity had be confirmed with phenotypic tests only), all the other clusters contained more than one species. Therefore, the use of RAPD-PCR with primer XD9 and cluster analysis would allow the identification of S. thermophilus but not that of E. faecalis or E. faecium. Comparison of three supervised ANNs for the identification of thermophilic streptococci from RAPD-PCR patterns. In order to develop a simple, rapid, and inexpensive procedure for the identification of S. thermophilus, E. faecalis, and E. faecium using RAPD-PCR patterns obtained with primer XD9, three supervised ANNs (MLP, RBF, and BN) (Fig. 1) were trained to identify the three species using simplified RAPD-PCR patterns. The RAPD patterns obtained from 93 strains whose identification had been confirmed by both genotypic and phenotypic tests were used (Table 1). After class equalization by random duplication of the patterns of the less-represented species (E. faecium and E. faecalis), the patterns were randomly assigned to training (80%), validation (10%), and test (10%) sets. The assignment and the training of the networks were repeated 15 times, and ANN performance was evaluated as the percentage of correct identifications for the test set (which had not been used for training). Although both the MLP and the RBF correctly identified 98 to 100% of the patterns of the training set, their performance for the test set was sometimes significantly worse: the MLP correctly identified 84 to 100% of the patterns (median, 95%) of the test set, while the corresponding values for the RBF were 73 to 100% (median, 92%). In both cases, some S. thermophilus strains were misidentified as E. faecium, while E. faecalis was always identified correctly. The BN always identified correctly all the patterns in both the training and the test sets and was therefore chosen for further analysis. Comparison of BN, LDA, and CT for the identification of thermophilic streptococci. Two multivariate statistical techniques, LDA and CT, are valuable alternatives to cluster analysis for the identification of strains. These techniques were therefore compared to the BN for the identification of thermophilic streptococci using simplified RAPD-PCR patterns. In order to compare the performances of the three methods and to evaluate the effect of the size of the training set on the reliability of the results, 93 simplified RAPD-PCR patterns (strains listed in Table 1, group a) were used after random duplication for class equalization as described above. The resulting patterns were randomly assigned to training and test sets (the validation set is not needed for the BN); the size of the training set was decreased from 90 to 40% of the whole data set, while the size of the test set (used for cross validation) was increased accordingly. The assignment and the training of the network or the estimation of the statistical models was repeated five times for each training set size. The results, in
APPL. ENVIRON. MICROBIOL.
terms of percentages of correct identifications for the test set, are shown in Table 2. The BN always identified correctly all the strains in the training set. Even when the size of the training set was reduced to 40% of the total (which resulted in the exclusion of many unique patterns from the training set), the network identified correctly more than 96% of the strains in the test set, thus showing excellent generalization. With ANNs, there is no direct way to estimate the relative effect of the input variables on the output of the network. To identify the inputs which affected the identification results the most, the following procedure was used. Eight E. faecium patterns, 10 E. faecalis patterns, and 20 S. thermophilus patterns were selected, and the number of bands in each band group of the pattern was systematically increased or decreased by one or two (as long as this process did not result in a negative number of bands); finally, the resulting patterns were used as a run set for the BN trained with the largest training set size. The effect of changing band groups on identification depended on the original pattern. For S. thermophilus, changes in the number of bands at ⬍1.6 or ⬎2.7 kb did not have any effect on identification, while changes in the number of bands between 1.6 and 2.7 kb resulted in a different identification. For E. faecium, increasing or decreasing by two the number of any group of bands always resulted in a change in identification. For E. faecalis, an increase in the number of bands at ⬎2.7 and 2 to 2.7 kb resulted in a change in identification. Overall, changes in band groups between 0.75 and 1.6 kb had the lowest impact on identification. Of the 553, 180, and 211 artificial patterns generated for S. thermophilus, E. faecium, and E. faecalis, only 24 (4.3%), 23 (13%), and 15 (7.1%) of the patterns, respectively, resulted in a change in identification. The performance of LDA was significantly affected by the number of examples used to build the model. There were ⬎98% correct identifications for the training set, but with some exceptions, performance during cross validation for the test set was lower and was as low as 84% correct identifications when smaller training sets were used. With LDA, the relative importance of input variables can be judged on the basis of the F values for each variable. Band groups at ⬎2.7, 1.6 to 2, and ⬍0.5 kb consistently had the highest discriminant value in LDA for all training set sizes (with F values of 97.6, 93.4, and 42.64, respectively), while bands between 0.5 and 1 kb had the lowest (F values of 7.6 and 3.4 for the two band groups in this interval). On the basis of the between-groups F matrix, discrimination of S. thermophilus from enterococci was relatively clear-cut, while differentiation of E. faecalis from E. faecium was more difficult. This result was also evident from the canonical score plot shown in Fig. 4. Discrimination between S. thermophilus and enterococci occurred along the first canonical factor, which explained 81.1% of the variance, while a partial overlap of the 95% confidence ellipses for the E. faecalis and E. faecium groups occurred. CT had the worst performance. A typical dichotomic key generated by the CT procedure is shown in Fig. 5. Although the procedure allowed us to find a simple heuristic rule for identification of the three species (choices were made on the basis of the same variables as those identified as most significant in LDA and BN), the percentages of correct identifications for the training set were usually ⬍95% and the size of the
FIG. 3. Abridged dendrogram showing the similarity relationships among RAPD-PCR patterns of 138 strains of thermophilic streptococci. Percent similarity was calculated with the formula of Nei and Li (24), while clustering was carried out using UPGMA. 2161
2162
MOSCHETTI ET AL.
APPL. ENVIRON. MICROBIOL.
TABLE 2. Performance of a supervised ANN (BN), LDA, and CT for the identification of S. thermophilus, E. faecalis, and E. faecium using simplified RAPD-PCR patterns obtained with primer XD9 No. (%) of patterns in the training set:
169 (90) 158 (80) 132 (70) 113 (60) 94 (50) 75 (40) a
Median (range) % correct identifications obtained witha: BN
LDA
CT
100 (100–100) 100 (100–100) 100 (100–100) 100 (100–100) 99 (97–100) 97 (96–100)
100 (100–100) 100 (95–100) 95 (94–100) 96 (96–98) 95 (94–99) 91 (84–96)
96 (94–100) 97 (94–98) 98 (95–98) 96 (87–97) 93 (88–98) 96 (94–97)
Values are for five replicate runs.
training set severely affected performance for the test set, with correct identifications as low as 88% in some cases. Moreover, with smaller training sets, the identification rule was highly dependent on the set used. While with most of the random trials the rule for identification was that shown in Fig. 5, in a few cases trees with a smaller number of branches (⬍1 band at 1.6 to 2 kb and ⬍1 band at ⬎2.7 kb), with many S. thermophilus strains being classified as E. faecium, were generated. The performance of the three methods was also tested with another set of strains, which included species not used in training the network and/or building the statistical models (Table 1, group b). In fact, a good identification technique should allow not only identification of the species used in the training and building phase but also flagging of unknown species. Unfortunately, CT do not provide any measure of the reliability of identification and therefore systematically misidentified all Streptococcus spp. and Enterococcus spp. listed in Table 1, group b. Both LDA and BN provide some measure of the reliability of identification. In addition to calculating canonical scores and distances to group centroids, LDA generates posterior probabilities for identification. Table 3 shows a revised crosstabulation matrix in which the ability of LDA to differentiate Streptococcus spp. and Enterococcus spp. from the three species used in building the classification function is taken into account. A fourth category (“other species”) was created to include all strains identified by LDA as S. thermophilus, E. faecium, and E. faecalis with a posterior probability of ⬍0.80. With this criterion, the percentages of correct identifications for E. faecium, E. faecalis, S. thermophilus, and other species were, respectively, 64, 96, 91, and 26%. The last value reflects the misidentification of most Streptococcus and Enterococcus spp. Increasing or decreasing the posterior probability criterion resulted in even worse results. The poor ability of LDA to discriminate Streptococcus and Enterococcus spp. is also evident from the canonical score plot shown in Fig. 4, since their patterns often fell within the 95% bivariate confidence ellipses for the three species used to build the model (S. thermophilus, E. faecium, and E. faecalis). ANNs do not generate true probabilities for identification; rather, each of the three output nodes (one for each species) generates a numerical output when the network is exposed to a pattern. The pattern is identified as belonging to the species whose node had the lowest output (winning node). In a typical situation for a clear-cut identification, the winning node has an
output close to 0, while the other two nodes have an output close to 1; this situation was in fact true for most of the strains used for training the network. The network will still provide an output for patterns which are highly dissimilar from those used during training, either because they belong to a different species or because they are comparatively rare among one of the species used for training, but the result will be ambiguous values (far from 0 or 1) for two or more nodes. To define a criterion for the definition of ambiguous identifications, the following approach was used. First, to obtain a representation in two dimensions for the output of the BN which would be comparable to the canonical score plot obtained with LDA, a principal-component analysis was carried out for the outputs of the three nodes. In the resulting score plot (Fig. 6), the patterns belonging to strains identified as E. faecium, E. faecalis, and S. thermophilus are more tightly clustered than those in the canonical score plot generated with LDA (Fig. 4) and, as a consequence, the 95% bivariate ellipses for the three species are much smaller than with LDA. With a single notable exception (S. salivarius DSM20560 was identified as E. faecium), all Streptococcus strains fell outside the ellipses. E. durans and E. gallinarum strains were clearly differentiated from E. faecium, E. faecalis, and S. thermophilus strains by the BN; this finding was also obtained for most of the enterococci, for which a conclusive identification based on independent testing (i.e., other than RAPD-PCR) was not available. However, two E. faecium strains (538T and 649T), a few S. thermophilus strains (CNRZ302, L1, S0605, and NCDO573), and one E. faecalis strain (536T), whose identification had been confirmed by phenotypic and genotypic tests, were also comparatively far from the ellipses. When the outputs for
FIG. 4. Canonical score plot of simplified RAPD-PCR patterns obtained with primer XD9 for 138 strains of thermophilic streptococci. The canonical scores were calculated by discriminant analysis for the identification of S. thermophilus (E), E. faecalis (‚), and E. faecium (䡺) using RAPD-PCR patterns for a set of 93 strains (Table 1, group a). Other symbols: ⽧, Streptococcus spp.; , other enterococci. Open symbols correspond to patterns used for building the model; closed symbols correspond to patterns not used for building the model. The 95% confidence ellipses for the patterns of each species used for building the model are also shown.
VOL. 67, 2001
RAPD-PCR IDENTIFICATION OF THERMOPHILIC STREPTOCOCCI
2163
FIG. 5. Dichotomic key generated by CT for the identification of S. thermophilus, E. faecalis, and E. faecium using RAPD-PCR patterns for a training set of 93 strains (Table 1, group a).
strains lying far from the confidence ellipses of the three species were examined, it was found that they had outputs of ⬎0.20 and ⬍0.80 for one or more output nodes. This criterion was therefore used to build the cross-tabulation matrix shown in Table 3. Accordingly, the percentages of correct identifications for E. faecium, E. faecalis, S. thermophilus, and other species were, respectively, 82, 96, 95, and 83%. In this work, RAPD-PCR patterns were visually examined by trained human operators, rather than treated with image analysis software. Since during visual reading different operators may introduce small errors in the patterns by misplacing or ignoring bands, a factor that may affect the identification results, the 137 patterns were read by three operators and the results were compared in terms of the number of patterns which resulted in mismatching identifications when read by different operators. Identifications for the three operators always matched the CT, probably because of the limited number of features (only three of the band groups were used for identification) used by the procedure. With either the LDA or the BN, the percentages of identifications which did not match when the patterns were read by different operators were 0.9% (operator 1 versus operator 2), 2.5% (operator 2 versus operator 3), and 4.2% (operator 1 versus operator 3), with identical results for the two procedures. Most of the mismatching identifications corresponded to enterococci. Pearson’s r values between outputs of corresponding nodes for different operators were very high (0.99), and the same was true for correlations between posterior probabilities of corresponding species for different operators with LDA. Therefore, errors introduced by different operators in reading the patterns had only a minor effect. DISCUSSION When RAPD-PCR is used for classification and typing, the patterns obtained from amplification with two or three different primers are usually combined (3, 7, 8, 21, 23, 28, 30, 31), and the procedures for reading the patterns, calculating similarity or distance measures, and clustering the patterns are
time-consuming and cumbersome when performed by human operators or require expensive instrumentation or software. In order to develop a rapid, inexpensive, robust, and reliable method for identification at the species level of S. thermophilus, E. faecium, and E. faecalis, we compared three multivariate statistical techniques (cluster analysis, LDA, and CT) with ANNs for the analysis of RAPD-PCR patterns generated with a single primer (XD9). Even though RAPD-PCR with two separate primers (XD8 and XD9) coupled to hierarchical cluster analysis was a powerful and convenient tool for the classification and typing of thermophilic streptococci of dairy origin (23), when primer XD9 alone was used, only S. thermophilus strains could be reliably separated from the other groups. This result may reflect a limitation of the procedures used for calculating similarity measures and clustering or the low level of intraspecific similarity due to the use of a single primer. Moreover, when the purpose is identification rather than classification, cluster analysis is less appropriate for the interpretation of the results
TABLE 3. Cross-tabulation matrix (true identification in rows, predicted identification in columns) for identification of the strains listed in Table 1 with LDA or BN Method a
Organism
No. of strains of: EFM
EFS
ST
OTH
Total no. of strains
% Correct identifications
LDA
EFM EFS ST OTH
7 0 1 10
3 24 6 7
0 0 72 0
1 1 0 6
11 25 79 23
64 96 91 26
BNb
EFM EFS ST OTH
9 0 0 3
0 24 0 0
0 0 75 1
2 1 4 19
11 25 79 23
82 96 95 83
a A strain was scored as belonging to the other species (OTH) group if the probability for identification as E. faecium (EFM), E. faecalis (EFS), and S. thermophilus (ST) was ⬍0.80. b A strain was scored as belonging to the other species group if the output for the winning node (i.e., the node with the lowest output) was ⬎0.20.
2164
MOSCHETTI ET AL.
than other multivariate statistical techniques (such as LDA and CT) and supervised ANNs. Three supervised ANNs (MLP, RBF, and BN) were compared for the identification of S. thermophilus, E. faecalis, and E. faecium using simplified RAPD-PCR patterns obtained by pooling the bands in selected molecular weight ranges. This procedure significantly reduced the amount of input data, thus allowing the use of relatively small training sets, and had the additional advantage of simplifying the process of reading the band patterns. The size and composition of the training set are both very important for the performance of ANNs. The minimum size and complexity of the training set (N) needed to achieve a predefined error level have a complex relationship with network architecture, but it has been suggested (15) that a training set size of at least W/⑀ cases (where W is the number of free parameters [weight and biases] of the network and ⑀ is the fraction of classification error allowed for the test data) should be sufficient to obtain good generalization. Therefore, to achieve 95% correct identifications for the test set, the N/W ratio should be larger than 20. However, smaller training sets can still provide acceptable results in pattern classification tasks (15). In fact, small training sets have been used with success in the identification of microorganisms using complex input patterns (2, 5, 10, 11, 12, 14). In a recent study (1), the issue of size and imbalance of training sets was addressed for the identification of marine microalgae using flow cytometry data and RBF. Even with very complex networks (7 input nodes, 1 to 5 hidden nodes for each output node, and 20 to 60 output layer nodes), relatively small training sets were sufficient to obtain comparatively high percentages of correct identifications: 50 and 100 to 200 training examples per species were sufficient for networks trained to identify 20 and 40 to 60 species (with an N/W ratio of between ⬍0.5 and 1.4, depending on the number of hidden nodes), respectively. Imbalance in the training set (i.e., unequal numbers of training examples for each species to be identified) severely affected the performance of networks trained to identify 40 to 60 species but had a much smaller effect on networks trained to identify 20 species. Adjusting the network outputs to account for differences between proportions of taxa in training and test data sets improved the results (1). In this work, the N/W ratios were 1.9 for the MLP and the BN and 0.56 for the RBF. However, when only unique patterns are accounted for, N/W ratios of 0.9 for the MLP and the BN and 0.3 for the RBF are obtained. Even when approximately equal numbers of patterns for each species were used for training, the numbers of unique patterns for the species were unbalanced, with more patterns available for S. thermophilus than for E. faecium and E. faecalis. Over 15 replicate runs, the BN showed the best performance and the RBF showed the worst. This result may have been due to a number of factors, including performance of the training algorithm and inadequacy of the training set. Both the MLP and the RBF had a tendency to lose generalization ability because of overtraining, as shown by the better performance for the training set (98 to 100% correct identifications) than for the validation and test sets (73 to 100% correct identifications). The RBF, which had the most unfavorable N/W ratio, may also have been more affected by unbalanced training set composition than the other networks. The ability of the BN to correctly identify all pat-
APPL. ENVIRON. MICROBIOL.
FIG. 6. Score plot for the principal-component analysis carried out on the outputs of a BN trained to identify S. thermophilus (E), E. faecalis (‚), and E. faecium (䡺) using RAPD-PCR patterns for a set of 93 strains (Table 1, group a). The output for all 138 strains of Table 1 is shown. Other symbols: ⽧, Streptococcus spp.; , other enterococci. Open symbols correspond to patterns used for building the model; closed symbols correspond to patterns not used for building the model. The 95% confidence ellipses for the patterns of each species used for building the model are also shown.
terns in the training and test sets was probably due to both a favorable N/W ratio and a training strategy better suited than the MLP convergence algorithm to prevent overtraining and to cope with unbalanced training sets and partially overlapping decision boundaries (15). An additional advantage of the BN is that there is no need for a validation set, thus making more data available for training. Thus, this network was chosen for further study. Since the size and composition of the sample used for building the model (training set) may affect the performance of both ANNs and multivariate statistical techniques, the BN and two multivariate statistical techniques (LDA and CT) were compared for their ability to identify S. thermophilus, E. faecalis, and E. faecium using training sets of decreasing sizes (from 90 to 40% of the available patterns). The BN significantly outperformed LDA and CT: the percentage of correct identifications with the BN was always higher (usually 100%), and the results were less dependent on the size of the training set. These results are not surprising, since the superiority of ANNs over conventional multivariate statistical techniques in classification problems is well known (15) and has already been proven for the identification of a number of microorganisms at the species or strain level (2, 14, 34). However, it is remarkable how the BN showed excellent generalization even when very small training sets were used (N/W ratio of ⬍1.4, with many unique patterns not being used for training). The robustness and fault tolerance of the BN were also proven by its better ability to discriminate unknown species (i.e., species not included in the training set) compared to LDA and CT (even at the cost of a slight reduction in the percentages of correct identifications for the species used to train the network) and by the relative insensitivity of the identification results to errors introduced by reading of the RAPD-PCR patterns by different operators and
VOL. 67, 2001
RAPD-PCR IDENTIFICATION OF THERMOPHILIC STREPTOCOCCI
by artificial alteration of the number of bands for selected patterns. The misidentification of some E. faecium and E. faecalis strains with all techniques may have been caused by the unbalanced composition of the training set. However, S. thermophilus is by far the species most frequently isolated in Italian cheeses produced with thermophilic natural starter cultures, followed by E. faecalis and E. faecium, while other species (E. durans, E. gallinarum, Streptococcus uberis, and Streptococcus bovis) occur rarely (6, 13, 17, 22, 27); therefore, the risk of incorrect identifications is relatively small in practice, even with a network trained to identify three species only. A different training strategy, with the specific inclusion of a fourth class in the training set (unknown species, as proposed in reference 1, or random patterns, as proposed in reference 26), may have resulted in further improvements in the identification ability of the networks. The use of a single primer and the massive simplification of the input (by grouping the bands in seven groups in order to reduce the number of input features and to simplify the task of gel reading by human operators) may have contributed to reducing the discriminatory ability of RAPDPCR. However, we believe that simplification of the patterns had only a minor effect on the classification abilities of LDA, CT, and BN. In fact, even when complete band patterns were used in cluster analysis, they did not result in any improvement in classification. Even though the application of ANNs for the identification of microorganisms using complex patterns (including electrophoretic patterns [5, 12]) is not new, the approach used in this study provides the basis for a fast and inexpensive method for the identification of thermophilic streptococci which can easily be applied to other microorganisms. RAPD-PCR patterns can be obtained in a matter of a few hours, starting directly from colonies (compared to a few days with pulsed-field gel electrophoresis or whole-cell protein analysis); the procedure used for reading the patterns (summing the bands in molecular weight groups) can be performed rapidly even by untrained operators; the software used for building the neural networks is relatively inexpensive compared to the current packages for automatic acquisition and classification of electrophoretic patterns; and the ANN, once trained, can be used repeatedly for the identification of new patterns and upgraded by introduction of new patterns for different species to expand its identification capability. Finally, the identification procedure is robust, and incorrect assignment of bands to groups usually causes only minor changes. ACKNOWLEDGMENTS This work was funded by grants from MURST and ENEA, Rome, Italy. We are grateful to Angiolella Lombardi for providing some of the strains used in this study. REFERENCES 1. Al-Haddad, L., C. W. Morris, and L. Boddy. 2000. Training radial basis function neural networks: effects of training set size and imbalanced training sets. J. Microbiol. Methods 43:33–44. 2. Almeida, J. S., A. Sonesson, D. B. Ringelberg, and D. C. White. 1995. Application of artificial neural networks to the detection of Mycobacterium tuberculosis, its antibiotic resistance and prediction of pathogenicity amongst Mycobacterium spp. based on signature lipid biomarkers. Bin. Comput. Microbiol. 7:159–166. 3. Berthier, F., and S. D. Ehrlich. 1999. Genetic diversity of Lactobacillus sakei and Lactobacillus curvatus and design of PCR primers for its detection using randomly amplified polymorphic DNA. Int. J. Syst. Bacteriol. 49:997–1007.
2165
4. Breiman, L., J. H. Friedman, R. A. Olshen, and C. I. Stone. 1984. Classification and regression trees. Wadsworth, Belmont, Calif. 5. Carson, C. A., J. M. Keller, K. K. McAdoo, D. Wang, B. Higgins, C. W. Bailey, J. G. Thorne, B. J. Payne, M. Skala, and A. W. Hahn. 1995. Escherichia coli O157:H7 restriction pattern recognition by artificial neural network. J. Clin. Microbiol. 33:2894–2898. 6. Coppola, S., E. Parente, S. Dumontet, and A. La Peccerella. 1988. The microflora of natural whey cultures utilized as starters in the manufacture of mozzarella cheese from water-buffalo milk. Lait 68:295–310. 7. Du Plessis, E. M., and L. M. Dicks. 1995. Evaluation of random polymorphic DNA (RAPD)-PCR as a method to differentiate Lactobacillus acidophilus, Lactobacillus crispatus, Lactobacillus amylovorus, Lactobacillus gallinarum, Lactobacillus gasseri, and Lactobacillus johnsonii. Curr. Microbiol. 31:114– 118. 8. Dupont, J., S. Magnin, A. Marti, and M. Brousse. 1999. Molecular tools for identification of Penicillium starter cultures used in the food industry. Int. J. Food Microbiol. 49:109–118. 9. Everitt, B. 1974. Cluster analysis. Heinemann Educational Books, London, England. 10. Freeman, R., R. Goodacre, P. R. Magee, A. C. Ward, and N. F. Lightfoot. 1994. Rapid identification of species within the Mycobacterium tuberculosis complex by artificial neural networks analysis of pyrolysis mass spectra. J. Med. Microbiol. 40:170–173. 11. Giacomini, M., C. Ruggiero, S. Bertone, and L. Calegari. 1997. Artificial neural network identification of heterotrophic marine bacteria based on their fatty-acid composition. IEEE Trans. Biomed. Eng. 44:1185–1191. 12. Giacomini, M., C. Ruggiero, L. Calegari, and S. Bertone. 2000. Artificial neural network based identification of environmental bacteria by gas-chromatographic and electrophoretic data. J. Microbiol. Methods 43:45–54. 13. Giraffa, G., D. Carminati, and E. Neviani. 1997. Enterococci isolated from dairy products: a review of risks and potential technological use. J. Food Prot. 60:732–738. 14. Goodacre, R., M. J. Neal, D. B. Kell, L. W. Greenham, W. C. Noble, and R. G. Harvey. 1994. Rapid identification using pyrolysis mass spectrometry and artificial neural networks of Propionibacterium acnes isolated from dogs. J. Appl. Bacteriol. 76:124–134. 15. Haykin, S. 1999. Neural networks. A comprehensive foundation. Prentice Hall International, London, United Kingdom. 16. Kennedy, M. J., and M. S. Thakur. 1993. The use of artificial neural networks to aid microorganism identification: a case study of Haemophilus species identification. Antonie Leeuwenhoek 63:35–38. 17. Limsowtin, G. K. Y., I. B. Powell, and E. Parente. 1995. Types of starters, p. 101–129. In T. M. Cogan and J.-P. Accolas (ed.), Dairy starter cultures. VCH, New York, N.Y. 18. Lopes, F. S. M., C. I. Pereira, F. M. S. Rodrigues, M. P. Martins, M. C. Mimoso, T. C. Barros, J. J. Figueiredo Marques, R. P. Tenreiro, J. S. Almeida, and M. T. Barreto Crespo. 1999. Registered designation of origin areas of fermented food products defined by microbial phenotypes and artificial neural networks. Appl. Environ. Microbiol. 65:4484–4489. 19. Mazurier, S.-I., and K. Wernars. 1992. Typing of Listeria strains by random amplified polymorphic DNA. Res. Microbiol. 143:499–505. 20. McLachlan, G. J. 1992. Discriminant analysis and statistical pattern recognition. John Wiley & Sons, Inc., New York, N.Y. 21. Molna ´r, O., R. Messner, H. Prillinger, U. Stahl, and E. Slavikova. 1995. Genotypic identification of Saccharomyces species using random amplified polymorphic DNA analysis. Syst. Appl. Microbiol. 18:136–145. 22. Morea, M., F. Baruzzi, and P. S. Cocconcelli. 1999. Molecular and physiological characterization of the dominant bacterial populations in traditional mozzarella cheese processing. J. Appl. Microbiol. 87:574–582. 23. Moschetti, G., G. Blaiotta, M. Aponte, P. Catzeddu, F. Villani, P. Deiana, and S. Coppola. 1998. Random amplified polymorphic DNA and amplified ribosomal DNA spacer polymorphism: powerful methods to differentiate Streptococcus thermophilus strains. J. Appl. Microbiol. 85:25–36. 24. Nei, M., and W. Li. 1979. Mathematical model for studying genetic variation in terms of restriction endonucleases. Proc. Natl. Acad. Sci. USA 76:5269– 5273. 25. Noble, P. A., K. D. Bidle, and M. Fletcher. 1997. Natural microbial community compositions compared by a back-propagation neural network and cluster analysis of 5S rRNA. Appl. Environ. Microbiol. 63:1762–1770. 26. Noble, P. A., J. S. Almeida, and C. R. Lovell. 2000. Application of neural computing methods for interpreting phospholipid fatty acid profiles of natural microbial communities. Appl. Environ. Microbiol. 66:694–699. 27. Parente, E., M. A. Rota, A. Ricciardi, and F. Clementi. 1997. Characterization of natural starter cultures used in the manufacture of pasta filata cheese in Basilicata (southern Italy). Int. Dairy J. 7:775–783. 28. Quiberoni, A., P. Taillez, P. Que´ne´e, V. Sua ´rez, and J. Reinheimer. 1998. Genetic (RAPD-PCR) and technological diversities among wild Lactobacillus helveticus strains. J. Appl. Microbiol. 85:591–596. 29. Staley, J. T., and N. R. Krieg. 1986. Classification of procaryotic organisms: an overview, p. 1–4. In N. R. Krieg and J. G. Holt (ed.), Bergey’s manual of systematic bacteriology, vol. 1. Williams & Wilkins, Baltimore, Md. 30. Stephan, R., H. Schraft, and F. Untermann. 1994. Characterization of Ba-
2166
MOSCHETTI ET AL.
cillus licheniformis with the RAPD technique (randomly amplified polymorphic DNA). Lett. Appl. Microbiol. 18:260–263. 31. Tailliez, P., J. Tremblay, S. D. Ehrlich, and A. Chopin. 1998. Molecular diversity and relationship within Lactococcus lactis, as revealed by randomly amplified polymorphic DNA (RAPD). Syst. Appl. Microbiol. 21:530–538. 32. Van damme, P., B. Pot, M. Gillis, P. De Vos, K. Kersters, and J. Swings. 1996. Polyphasic taxonomy, a consensus approach to bacterial systematics. Microbiol. Rev. 60:407–438.
APPL. ENVIRON. MICROBIOL. 33. Welsh, J., and M. McClelland. 1990. Fingerprinting genomes using PCR with arbitrary primers. Nucleic Acids Res. 18:7213–7218. 34. Wilkins, F. M., L. Boddy, C. W. Morris, and R. R. Jones. 1999. Identification of phytoplankton from flow cytometry data by using radial basis function neural networks. Appl. Environ. Microbiol. 65:4404–4410. 35. Williams, G., A. Kubelik, K. Livak, A. Rafalski, and S. Tingey. 1990. DNA polymorphisms amplified by arbitrary primers are useful as genetic markers. Nucleic Acids Res. 18:6531–6535.