COMPARISON OF TWO INDEPENDENTLY DEVELOPED BRIDGE WEIGH-IN-MOTION SYSTEMS Eugene J. O’Brien1, Aleš Znidaric2 and Anthony T. Dempsey3
1. Civil Engineering Department, University College Dublin, Dublin 2, Ireland; Tel: +353-872309931; Fax: +353-1-6773072; Email:
[email protected] 2. ZAG, Slovenian National Building and Civil Engineering Institute, Ljubljana, Slovenia; Tel: +386-61-1888207; Fax: +386-61-1888484; Email:
[email protected] 3. Dept. of Civil, Structural & Environmental Engineering, Trinity College, Dublin 2, Ireland; Tel: +353-1-6081457; Fax: +353-1-6773072; Email:
[email protected]
Abstract: An experiment is described in which two independently developed Bridge Weigh-inMotion (WIM) systems are tested and compared both for accuracy and durability. The systems, one a prototype Irish one still under development, the other a commercially available American one, were tested on a bridge in Slovenia. Eleven statically pre-weighed trucks were each driven over the bridge several times at a range of typical highway speeds. Accuracy's for axle and gross vehicle weights are presented within the framework of the draft European WIM specification and the bias which can be introduced by the selection of calibration truck demonstrated. Performance factors relating to durability are also discussed with particular emphasis on axle detectors. Keywords: weigh-in-motion, WIM, bridge, gross vehicle weight, axle weight, accuracy, test.
1. Introduction There is an upper limit on the accuracy of individual WIM strip sensors due to the effect of truck bounce. Even for moderately good pavement conditions, dynamic axle forces can exceed the corresponding static weights by between 15% and 40% depending on the degree of pavement roughness and the truck suspension. Hence, regardless of the accuracy of individual strip sensors, they can only provide axle weight for one point in time and their potential accuracy for calculating static weights is therefore limited. This problem can be overcome by using an array of low-cost strip sensors (multiple-sensor WIM) as recommended by Barbour and Newton (1995). Alternatively, the use of a bridge for weigh-in-motion can allow measurement of impact forces over more than one eigenperiod of truck vibration. In addition to accuracy, Bridge WIM systems have advantages over conventional pavement systems in terms of durability, particularly in sub-arctic and mountain climates. The concept of using bridges as scales to weigh trucks in motion was developed by Moses and others in the United States in the 1970’s (Moses 1979). In the early 1980’s in Australia, another Bridge WIM system was developed by Peters (1984). However, this system was replaced in further Australian development work with one based on the use of culverts (Peters 1986) of which there are now more than one hundred in operation. Culvert systems have advantages of availability of sites and of accuracy stemming from the damping out of dynamic vibrations by the soil surrounding the
1
culvert. In the early 1990’s, a Bridge WIM system was developed independently at Trinity College Dublin in Ireland by O’Brien and others (Dempsey et al. 1995). A commercially available American Bridge WIM system, based on the work of Moses (1979), was bought by the Slovenian National Building and Civil Engineering Institute in 1993. This and the Irish system are the only Bridge WIM systems known to be in use in Europe at present. In 1995, a comparative test of the two systems was sponsored by the European Commission COST Transport programme within the framework of the COST 323 action (Weigh-in-Motion of Road Vehicles) (Jacob 1994). Both systems were installed on the same bridge in Slovenia and eleven statically preweighed trucks with different axle configurations and weights were driven across it several times. The WIM weights of both systems were then compared to the static weights. This paper reports the results of this test of the accuracy and durability of the two systems.
2. Differences Between the Two Systems Bridge WIM systems consist of axle detectors, devices for measuring strain and data acquisition equipment and are based on the principle that an instrumented bridge is used as a weighing scales. The axle detectors, which are placed on the road surface, provide information on truck velocities, axle spacing and classification. This information is essential for the calculation of axle weight and the inferred weights are quite sensitive to the accuracy of the axle detector results (Dempsey et al. 1996). Strain gauges or transducers are attached to the soffit of the bridge, generally at the longitudinal position which gives maximum strain. These provide information on axle weights, gross vehicle weights, impact factors and the lateral distribution of loads. While both systems are based on the same principles, the two vary in many ways both in software and hardware. Each system has the data acquisition and signal conditioning equipment necessary to record strain at a sufficiently fast rate to calculate axle weights. However, there are two principal differences in the hardware of the systems. The American system uses highly sensitive commercially available strain transducers to record the strain while the Irish system uses electrical resistance strain gauges and inexpensive mechanical strain amplifiers. The mechanical strain amplifiers operate on the principle of converting an axial strain into a bending strain. Magnifications of between 7 and 8 are typically obtained. The American installation used tape switches for axle detectors, consisting of two metal plates separated from each other. When an axle hits the tape switch, the metal plates are pushed together and an electrical circuit is closed, registering an axle. The Irish system, on the other hand, uses pneumatic road tubes to detect axles. These operate on the principle that, as an axle hits the tube, a pulse of air is sent to a pneumatic converter which changes the pulse to an electrical signal. In the American system, the axle detectors were placed approximately 4 m apart before the start of the bridge whereas the Irish system had one axle detector placed before the bridge and the other placed after the bridge. Hence the American system calculated the velocity before the bridge and assumed that a vehicle travelled at a constant speed as it crossed the bridge whereas the Irish system calculated the average velocity over the entire bridge length. 2
Originally the Irish system used the method described by Dempsey et al. (1995) to calculate gross vehicle weights. After initial field trials on a test bridge in Dublin the method was found to give satisfactory results. However, a major disadvantage of the system was that, while gross vehicle weights were determined, it did not allow for the calculation of axle weights. The system was subsequently amended and, at the time of the experiment, used the same basic principle for the calculation of axle weights as the American system (Moses 1979). This approach is based on the fact that the measured strain in a bridge at any point in time is a linear combination of the axle weights, each axle factored by an influence ordinate appropriate to its location. The number of unknowns is equal to the number of axles, n. Therefore, n different truck locations are sufficient to give n equations which can be solved to determine the n unknown axle weights. However, since the recording of strain is carried out continuously while the truck is on the bridge, there is a considerable quantity of “redundant” data which can be used to increase the number of separate “weighings” of the truck. Both systems employ all of the data in the calculation of axle weights making use of a least squares error minimisation algorithm. This has the effect of averaging out the influence of dynamic oscillation. For both systems, a knowledge of the bridge influence line is not critical as a calibration truck of known weight is used to determine the relationship between strain (or bending moment) and weight. The influence line used is a theoretical one and is simply scaled up or down after several crossings of the calibration truck. Unlike the influence ordinates, the axle spacings are important in that they dictate the relevant point on the influence line corresponding to each axle. The Irish system, unlike the American one, used an analogue filtering process to smooth out oscillations at frequencies in excess of 5 Hz. This is based on assumed truck oscillations in the range 1.5 Hz to 4 Hz. An analysis of the strain data yielded a fundamental longitudinal eigenfrequency for the bridge of approximately 8.5 Hz. The American system calculated axle and gross vehicle weights in real time whereas the Irish system did not. It simply recorded strain and axle detector records; weights were calculated later off-site.
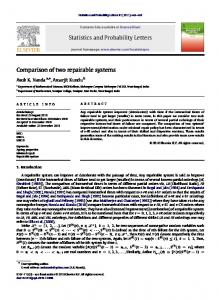
3. Experimental and Field Procedures The instrumented bridge was located approximately 50 km South East of Ljubljana (in Slovenia), on National Road No. 1 on the main route Eastwards from Zagreb in Croatia to Ljubljana. The bridge is a 6-span double box girder which is curved in plan (Figure 1) but only the first span (11.75m) was instrumented. It carries a two-lane road, one lane in each direction. For this study the Irish system monitored only one lane while the American system monitored both lanes. Only data recorded while traffic was present in the instrumented span was processed. Accuracy would have been improved by processing data from more than one lane but the number of occasions when multiple trucks were present would have increased and neither system can calculate the weight of two simultaneously occurring trucks.
3
Figure 1 - Layout of Bridge used for Weigh-in-Motion
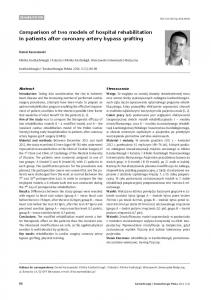
Figure 2 - Strain Transducers and Mechanical Strain Amplifiers
4
The bridge was chosen because: 1. it is in quite a remote area so the possibility of vandalism was small, 2. the existence of an embankment under the bridge beside the abutment meant that installation was quite simple and did not require the use of ladders or hoists. 3. a lay-by close to the bridge meant that the testing could be monitored with relative ease and safety. The installation of both systems took approximately 4 hours. Strain transducers and mechanical strain amplifiers were bolted to the soffit of the bridge (Figure 2) and axle detectors (tape switches and pneumatic tubes) were placed on the road overhead and fixed in place using asphalt-based tape. Both the road and the tape were heated by a gas burner prior to installation. Due to the fact the bridge is located on a major trans-European road, it was considered impracticable to close it off to traffic when carrying out the tests. Instead the trucks were driven across the bridge under normal traffic conditions and at regular highway speeds. Each truck drove first in one direction and then turned and drove back in the other direction and this process was continued about five times. Over the course of two weeks, pre-weighed trucks with different configurations and axle loads were driven across the bridge under normal traffic conditions. The trucks varied from 2- and 3-axle rigid trucks to 4- and 5-axle articulated and tractor-trailer trucks. In general, two different static gross weights were obtained in each case.
4. Results Figure 3 shows a typical strain response at one sensor location on the bridge due to a moving truck on the road overhead. As can be seen the strain record for the Irish system is quite smooth as it was filtered and does not show the dynamic oscillations recorded by the American system. However, this had little effect on the end result as the data was automatically smoothed in the least squares minimisation algorithm. The Irish system records strains from once the truck triggers the first axle detector. At this stage, the truck is on a span other than the instrumented one and generates a hogging moment there. The American system initiates the recording of data just before the truck arrives on the instrumented span. In calculating the axle and gross vehicle weights a theoretical influence line was used for both systems. This theoretical influence line was then simply scaled after many crossings of the first truck, deemed to be the calibration truck. These calibration factors were input into both systems and were used to calculate the WIM weights of other pre-weighed trucks. Figure 4 shows a histogram of the accuracy of the Irish system for gross vehicle weight. There appears to be a slight skew in these results and, in general, the trucks are slightly overweighed. On calculation of all the data collected over the entire period, it became clear that the truck which was used for calibration had a higher calibration factor than that of the other trucks which would explain the skew.
5
250 200
Irish American
150 Strain
100 50 0 -50 -100 -150 0
5
10
15
20
25
Distance (m)
Figure 3 - Strain induced by 3-Axle Truck (GVW = 16.3 t , Weight of First Axle = 10.1 t, Weight of Rear Tandem = 6.2 t)
30
No. of vehicles
25
Westbound
20 15 10 5
140-145
130-135
120-125
110-115
100-105
90-95
80-85
70-75
60-65
50-55
0
WIM w eight/Static w eight (% )
Figure 4 - Histogram of Accuracy of Irish System for Gross Vehicle Weight (Westbound traffic) Results presented in Figure 5 show how the calibration factor changes when trucks of different configuration are used for calibration purposes. The variation is due to the significantly different
6
configurations of the trucks used. For example, the calibration factor of 1.10 corresponds to a 2-axle rigid truck while the factor of 0.975 results from a truck of similar gross weight but which is articulated with four axles. Clearly there is scope for improvement in the method of calibration, perhaps using multiple trucks. In the American system, the accuracy of which is illustrated in Figure 6, a similar bias was observed to that in the Irish system.
Calibration Factor (normalised about the mean of the 7 calibration factors)
1,15 1,10 Calibration truck 1,05 1,00 0,95 0,90 0,85 80
120
160
200
240
280
Gross Vehicle Weight (kN)
Figure 5 - Calibration Factors (normalised about mean) for Trucks of Various Configurations and Weights
16
Eastbound
14
Westbound
12 10 8 6 4 2 140-145
130-135
120-125
110-115
100-105
90-95
80-85
70-75
60-65
0 50-55
No. of vehicles
18
WIM w eight/Static w eight (% )
Figure 6 - Accuracy of the American System for Gross Vehicle Weight
7
All of the trucks used in this study were driven across the bridge at differing velocities. Figure 7 shows how the gross vehicle weights for the Westbound lane are affected by velocity, for both systems. Velocity would appear to have little influence on the accuracy of gross vehicle weight. A similar lack of correlation between velocity and accuracy was found for axle weights. Figure 7 also gives an indication of the typical accuracy that might be expected from either bridge WIM system although it should be borne in mind that many of the points in the figure represent repeat runs of the same eleven trucks. If all of the points represented different trucks (random traffic), a greater spread in the data would be expected. The mean bias (inaccuracy) for the repeat runs of each truck are presented in Table 1. The coefficients of variation are also presented to indicate the spread in the results for repeat runs of the same vehicle. Overall, 90% of the gross WIM weights of Westbound trucks recorded by the American system, were within -15.5% and +15.3% of the corresponding static value. The corresponding interval for the Irish system was -15.9% to +7.0%. The American system also recorded WIM weights for Eastbound trucks of which 90% were within the range 14.2% to +15.6%.
WM Weight / Static Weight
200% Irish American
175% 150% 125% 100% 75% 50% 25% 0% 50
60
70 80 Velocity (km/hr)
90
100
Figure 7 - Effect of Truck Velocity on Accuracy of Gross Vehicle Weights (both systems, Westbound traffic)
The calculated axle weights were, as might be expected, considerably less accurate than the gross vehicle weights. Typical results are presented in Figures 8 (Irish system, Westbound traffic) and 9 (American system, Westbound traffic). Individual axles are identified in these figures using a truck reference (refer to Table 2) followed by a hyphen and the axle number (TA = Tandem, TR = Tridem).
8
Table 1 - % Bias and % Coefficient of Variation (COV) in Axle and Gross Vehicle Weights (A=American, I=Irish, GVW=Gross Vehicle Weight.
GVW Axle 1 Axle 2 Axle 3 Axle 4 Axle 5 Truck GVW Sys. No. Config. (t) Runs Bias COV Bias COV Bias COV Bias COV Bias COV Bias COV 2 Axle 2 Axle 2 Axle 3 Axle 3 Axle 3 Axle
16.22 9.2 11.73 26.49 25.45 23.90
A
4
-1.5 1.1 63.2 0.9 -15.2 1.2
I
7
-9.6 4.2 -14.5 -14.9 -7.4 5.1
A
3
2.2
0.9 24.0 6.3 -6.1 3.0
I
9
5.5
2.2
A
3
I
5
2.8
A
3
22.1 3.6 18.6 5.1 28.4 3.6 28.4 3.6
I
7
2.3
A
8
-1.7 1.8 -6.4 6.9 -0.3 2.8 -0.3 2.8
I
5
0.5
3.6 52.4 5.1 -20.6 6.0 -20.6 6.0
A
4
2.3
4.2
A
13
2.5
7.0 -22.0 4.6 11.4 8.9 11.4 8.9
I
10
2.5
4.2 -18.5 13.6 36.7 13.6 36.7 13.6
A
9
1.2
8.1 69.2 4.5 -46.2 9.7 22.6 13.0 54.8 13.8
I
7
-0.8 47.1 -54.7 5.4 -16.9 8.6 57.1 7.4 42.6 7.3
A
8
6.7
6.6 55.2 4.2 -44.8 13.0 9.6 11.4 14.2 7.3 63.2 5.2
9
6.9
6.8 -30.2 11.3 -1.5 9.3 44.7 7.9 44.7 7.9 44.7 7.9
A
9
6.4
5.0
3.8
6.4
3.8
6.4
3.8
I
7
-0.2 1.0 -47.9 41.5 10.5 13.3 22.7 4.2
1.2
4.2
1.2
4.2
5.6
3.1
5.4
7.7
-11.3 3.4 19.8 2.4 -21.2 4.0 8.2 -15.2 13.7 9.9
6.7
7.8 11.0 16.5 -1.3 4.7 -1.3 4.7
8.9
3.4 -5.2 6.7 -5.2 6.7
I 3 Axle 4 Axle 5 Axle
16.30 16.43 16.43
I 5 Axle
14.12
A I
5 Axle
40.56
3.9
2.6
2.1
5.7
6.4
Table 2 - Truck classes as referred to in Figures 8 - 10
T2
T3
2S3
3T2
Overall, 90% of the Irish axle WIM weights were within the range -33.8% and +51.7%. The corresponding ranges for the American system are -37.2% to +35.9% for Eastbound traffic and 39.2% to +72.2% for Westbound traffic. Much of the less accurate data involved lighter axles. This
9
WM Weight / Static Weight
can be seen in Figure 10 which is identical to Figure 9 except for the exclusion of all weights less than 6 tonnes.
200% 180% 160% 140% 120% 100% 80% 60% 40% 20% 0%
T2-1 T2-2 T3-1 T3-TA 2S3-1 2S3-2 2S3-3 2S3-4 2S3-5
50
60
70 80 Velocity (km/hr)
90
100
Figure 8 - Accuracy of WIM Axle Weights, Irish system, Westbound Traffic (Axle Weights under 3 tonnes not included) 5. Accuracy Classification A draft European specification for the weigh-in-motion of road vehicles has recently been prepared by the COST 323 management committee (Jacob et al. 1998, COST 323 1997) with support from the European Commission Transport directorate. The draft specification defines seven accuracy classes, A(5), B+(7), B(10), C(15), D+(20), D(25) and E. To be in a given class, there must be an acceptable level of confidence that WIM weights will be within a specified percentage of the static values. If there is an acceptable level of confidence that the gross weights are within 5% of the static values, the system is classified as Class A(5). Similarly, systems are classified as Class B(10), C(15), D+(20), D(25) or E if the required number of records are within 10%, 15%, 20%, 25% or more than 25% of the static values respectively. In addition to the requirements for gross vehicle weight, there are specified error limits for the weights of groups of axles (tandems or tridems), individual single axles and axles of a group taken individually.
For the American system, 19.8% of gross vehicle weights were within the specified limits giving an accuracy class of D+(20). Single axle and axle group results were, as would be expected, considerably less accurate. In each case, only 50% of weights were within the allowable limits resulting in an accuracy classification of E. The Irish system had 16.0% of gross vehicle weights within the specified limits which again gives an accuracy class of D+(20). However, the accuracy of the individual axles and axle groups were less than the American system with only 105% and 45% of individual axle and axle group results respectively falling within the required interval. The classification for these is clearly Class E.
10
WIM weight/Static weight
200% 180%
T3-1 T3-TA 2S3-1 2S3-2 2S3-TR T2-1 T2-2 3T2-1 3T2-TA 3T2-4 3T2-5
160% 140% 120% 100% 80% 60% 40% 20% 50
60
70 80 Velocity (km/h)
90
100
Figure 9 - Accuracy of WIM Axle Weights, American system, Westbound Traffic (Axle Weights under 3 tonnes not included)
WIM weight/Static weight
200% 180%
T3-1 T3-TA 2S3-1 2S3-2 2S3-TR T2-1 T2-2 3T2-1 3T2-TA 3T2-4 3T2-5
160% 140% 120% 100% 80% 60% 40% 20% 50
60
70 80 Velocity (km/h)
90
100
Figure 10 - Accuracy of WIM Axle Weights, American system, Westbound Traffic (Axle Weights under 6 tonnes not included) These results can be put in context by considering accuracy classifications obtained from a large scale test of six WIM systems on an urban roadway in Zürich, Switzerland (Doupal & Caprez 1995, Caprez et al. 1998). Gross weights from some thousands of statically weighed vehicles were used to determine the levels of gross weight accuracy for each system, with reference to the draft European specification. No static axle weight measurements were carried out.
11
Of the 6 systems considered, one, using bending plate technology, was placed in Class C(15). A second system, a prototype using piezo-quarz sensors, was placed in Class D+(20). A capacitive plate system was also placed in this class. The other three systems were placed in Class E. The IRI on this site was 3.7 mm/m, considerably higher than the Slovenian bridge site, which may explain the relatively poor results.
6. Discussion 6.1 Durability Axle detectors are particularly important as they provide the processing algorithm with the necessary information on axle spacings and truck velocities to which the weight results are quite sensitive (Dempsey et al. 1996). Axle detectors need to be reliable and durable. The tape switches used in the American system were found to be accurate but not sufficiently durable. It was found that, on a day when heavy rain occurred, the tape switches failed. (Treadle switches have however been reported to be working well with the Australian CULWAY system (Peters et al., 1996) and are apparently insensitive to rain.)
Prior to this study, pneumatic tubes were used for the Irish system which were fixed to the road surface by clamps at discrete intervals. This meant that when an axle passed over the tube, it vibrated resulting in a noisy signal. As a result, it was found that the signal processing circuit occasionally transmitted multiple signals in response to one axle. In the early stages of this study, this policy was changed and the tubes were fixed to the road surface by means of an asphalt-based tape, 120 mm wide, as was already used to fix the American tape switches. This had the effect of fixing the tube to the road surface over its entire length so that it did not vibrate when an axle crossed it. During the course of the experiments, this new arrangement was found to give considerably improved results. While the American system used high-precision strain transducers in a full Wheatstone bridge configuration, the Irish system used simple mechanical strain amplifiers and electrical resistance strain gauges in a half Wheatstone bridge configuration. Both systems were found to be sufficiently sensitive to give accurate and reliable results. 6.2 Bridge Site The type of bridge used for Bridge WIM is quite important (Znidaric et al. 1995) and has a considerable influence on the accuracy achieved. The bridge used for this project was a six-span box girder which was curved in plan and on a slight longitudinal slope (0.3%). The pavement surface on the approach to the bridge was quite uneven, particularly close to the expansion joint. The curvature and the number of spans should not, in theory, influence accuracy. However, in a site with heavier traffic, multi-span bridges can result in problems due to the frequent occurrence of more than one truck on the bridge at the same time. Neither the Irish nor the American Bridge WIM algorithms can cater for multiple truck presence at the present time although the American system is capable of counting and classifying such vehicles.
12
The surface roughness would be expected to influence accuracy as it has the effect of exciting the truck dynamics; as with all other WIM systems, a smooth road surface considerably increases the accuracy of static weight estimates. The International Roughness Index (IRI) was found to be between 1.85 and 2.10 mm/m at the site which, according to the draft European specification, is 'good'. However, this index does not properly account for the unevenness near the expansion joint which is an important factor in bridge WIM. 6.3 Accuracy The major source of inaccuracy in Bridge WIM systems would appear to be truck and bridge dynamics (Dempsey et al. 1996). At the time of the experiment, neither system made any attempt to model the dynamics of the system as suggested by some authors (O’Connor & Chan 1988). However, for the Irish system, the conventional Bridge WIM algorithm developed by Moses (1979) is currently being adapted under the WAVE (Weigh-in-motion of Axles and Vehicles for Europe) project (Jacob and O’Brien 1996) to take account of dynamic effects. It is anticipated that this will result in considerable improvements in the accuracy of the system. 7. Conclusions The accuracy and durability of two independently developed Bridge WIM systems are compared in tests carried on a bridge in Slovenia. A number of pre-weighed trucks were driven over the bridge several times and WIM weights calculated using both systems. The two systems are based on the same principal but are significantly different in the details of both the hardware and software. The relative accuracy's of the systems for predicting static weight are compared and the combined accuracy of both systems compared to a typical pavement-based WIM system. The influence of the configuration of the truck used for calibration is demonstrated.
While the strain-sensing devices for both systems performed well, there were problems with the axle detectors in each case. The choice of site was felt to be of considerable importance to the accuracy of the results; this particular site was considered to be far from ideal. Bridge and truck dynamics were considered to be the most likely cause for inaccuracy and are the subject of further research.
References •
•
• •
Barbour I.A. and Newton W.N., “Multiple-sensor weigh-in-motion”, in Post Proceedings of First European Conference on Weigh-in-Motion of Road Vehicles, eds. B. Jacob et al., ETH, Zürich,1995, pp133-142. Caprez, M., Doupal, E., Jacob, B.A., O'Connor, A.J. and O'Brien, E.J., "Test of WIM Sensors and Systems on an Urban Road", International Journal of Vehicle Design, Heavy Vehicle Systems, in print, 1998. COST 323, European Specification on Weigh-In-Motion of Road Vehicles, Draft 2.2, EUCOCOST/323/5/97, EC/DGVII COST Transport Secretariat, Brussels, June 1997, 56 pp.. Dempsey, A.T., Kealy, N.J., O’Brien, E.J. and Hartnett, M.A., “Improvements in the Accuracy of Weigh-in-Motion Systems”, National Traffic Data Acquisition Conference (NATDAQ ‘96), Vol.
13
•
•
•
•
•
•
•
• • •
•
•
II, ed. G. Knoebel, Alliance for Transportation Research, Albuquerque, New Mexico, 1996, 509526. Dempsey, A.T., O’Brien, E.J. and O’Connor, J.M., “A bridge weigh-in-motion system for the determination of gross vehicle weights”, Post Proceedings of First European Conference on Weigh-in-Motion of Road Vehicles, eds. B. Jacob et al., ETH, Zürich, 1995, pp 239-249. Doupal, E. and Caprez, M., “European test of WIM systems in Switzerland”, Post-Proceedings of First European Conference on Weigh-in-Motion of Road Vehicles, eds. B. Jacob et al., ETH, Zürich, 1995, pp 189-207. Huhtala, M. and Jacob, B., ‘OECD DIVINE Project - Spatial Repeatability of Axle Impact Forces’, in Post-proceedings of the First European Conference on Weigh-in-Motion of Road Vehicles, Eds. B. Jacob et al., ETH, Zürich, March 1995, pp121-132. Jacob, B.A., ‘European Research Activity COST323 - Weigh-In-Motion of Road Vehicles’, National Traffic Data Acquisition Conference (NATDAQ ‘94), Rocky Hill, Connecticut, Sept. 1994. Jacob, B.A. and O’Brien, E.J., "WAVE - A European Research Project on Weigh-in-Motion", National Traffic Data Acquisition Conference (NATDAQ ‘96), Vol. II, ed. G. Knoebel, Alliance for Transportation Research, Albuquerque, New Mexico, 1996, 659-668. Jacob, B.A., O’Brien, E.J., and Newton, W., 'Classification of the Accuracy of Weigh-in-Motion Systems, Part II - European Specification on WIM of Road Vehicles', International Journal of Vehicle Design, Heavy Vehicle Systems, in print, 1998. Moses, F., ‘Weigh-in-Motion System Using Instrumented Bridges’, Transportation Engineering Journal of ASCE, Proceedings of the American Society of Civil Engineers, Vol. 105, No. TE3, May 1979, pp233-249. O’Connor, C. and Chan, H.T., “Wheel loads from bridge strains: laboratory studies”, Journal of Structural Engineering, ASCE, 114, 8, 1988, pp 1724-1740. Peters, R.J., “AXWAY - A system to obtain vehicle axle weights”, Proceedings 12th ARRB Conference, Australian Road Research Board, 12, 1, 1984, 17-29. Peters, R.J., “CULWAY- an unmanned and undetectable highway speed vehicle weighing system”, Proceedings 13th ARRB Conference, Australian Road Research Board, 13, 6, 1986, pp. 70-83. Tierney, O.F., O’Brien, E.J. and Peters, R.J., "The Accuracy of Australian and European Culvert Weigh-in-Motion Systems", National Traffic Data Acquisition Conference (NATDAQ ‘96), Vol. II, ed. G. Knoebel, Alliance for Transportation Research, Albuquerque, New Mexico, 1996, 647656. Znidaric, A., Synder, R.E., Znidaric, J. and Moses, F., “Bridge weigh-in-motion testing of gross vehicle weights in Slovenia”, Post Proceedings of First European Conference on Weigh-inMotion of Road Vehicles, eds. B. Jacob et al., ETH, Zürich, 1995, pp. 251-258.
Acknowledgements The support of the European Commission COST Transport programme and Trinity Trust is acknowledged for financial assistance with the Short Term Scientific Mission from Ireland to Slovenia.
14