Gustavo H. C. Peixoto, Hans Joachim Menzel, FabrÃcio AnÃcio Magalhães,. Beatriz Magalhães Pereira, Antonio Eustáquio Melo Pertence, Ricardo Luiz. Carneiro ...
Vilas-Boas, Machado, Kim, Veloso (eds.) Biomechanics in Sports 29
Portuguese Journal of Sport Sciences 11 (Suppl. 2), 2011
COMPARISON OF TWO METHODS TO CALCULATE PASSIVE MUSCLE STIFFNESS IN HUMAN Gustavo H. C. Peixoto, Hans Joachim Menzel, Fabrício Anício Magalhães, Beatriz Magalhães Pereira, Antonio Eustáquio Melo Pertence, Ricardo Luiz Carneiro and Mauro Heleno Chagas Laboratory of Biomechanics, CENESP, Federal University of Minas Gerais (UFMG), Belo Horizonte, Brazil The aim of the present study is to compare and to correlate the results of two methods of calculating the muscle-tendon unit stiffness. Eighteen male and 18 female healthy students performed a hamstring passive stretch at 5º/s until maximum range of motion (ROM) was reached. Angle and passive torque were measured throughout the stretch maneuver and passive stiffness was calculated using two different parts of the torqueangle curve. Passive stiffness was then named stiffness 10% and stiffnessIII, based on the part of the curve used for calculation of stiffness. Results showed no significant difference between both methods of calculating passive stiffness and a significant high correlation coefficient between stiffness10% and stiffnessIII. StiffnessIII method seems more reliable because of lower dispersion. KEY WORDS: flexibility, ROM, stretch resistance, passive torque.
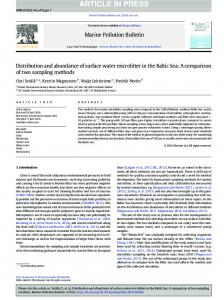
INTRODUCTION: Assessment of viscoelastic properties of muscle-tendon unit (MTU) involves measuring its resistance while increasing in length. This can be achieved throughout passive stretch, when passive torque and angle variables are measured simultaneously (Magnusson, 1998, Halbertsma & Goeken, 1994). The slope of the passive torque-angle curve represents the passive stiffness, and its change represents an alteration of viscoelastic properties of MTU. Although passive stiffness is considered an important variable to understand MTU behaviour under load (Halbertsma & Goeken, 1994, Magnusson, 1998), there is no general agreement about the method to calculate it. Since the passive stiffness is calculated dividing torque (ΔM) by angle (Δ ), different parts of the torque-angle curve might be used to calculate stiffness during stretch maneuver. Magnusson et al. (1996) and Magnusson et al. (1997) divided the curve in three parts and used the last third of it to calculate stiffness, whereas Magnusson et al. (2001) and Reid & McNair (2004) only used the final 10%. It seems appropriate to verify if these methods generate similar results, since assessment results may depend on the applied method to calculate stiffness. Therefore, the aim of the present study is to compare and to correlate the results of the two above mentioned methods. METHODS: Thirty-six healthy university students (recreational athletes) with mean age of 24.2 years (±3.2), body mass of 67.2 kg (±12.8) and height of 169.8 cm (±7.9) participated of this study. The participants were free of any pathology of lower extremities or lower back at the time of testing and they were included in the study if they had a shortened hamstring defined as a 20 degree knee angle restriction to extension when positioned at 45 degree hip flexion. Only the right lower limb was tested. Prior to study participants were informed about the purpose of the study and the procedures involved. The study was approved by the local Ethics Committee of the university in accordance with international standards and all participants signed an informed consent. Instrumentation: Passive stiffness of the hamstring muscle group was assessed by an isokinetic instrument (flexmachine) shown in FIGURE 1, which had been developed by the research group (Peixoto et al., 2007). This instrument consists of two chairs laterally attached to a lever arm where a force plate (Refitronic®, Schmitten, Germany) was positioned. The participant was seated with the trunk at a 95 degree angle to the seat and a 45 degree hip flexion. The pelvis and lower limb were firmly strapped to minimize
ISBS 2011
923
Porto, Portugal
Vilas-Boas, Machado, Kim, Veloso (eds.) Biomechanics in Sports 29
Portuguese Journal of Sport Sciences 11 (Suppl. 2), 2011
compensatory movements. This position ensured that participants maximal ROM was caused by a tension on the hamstring muscles without involvement of posterior capsule. The lateral epicondyle was aligned to the mechanical axis of the flexmachine through horizontal and vertical dislocation of the instrument. The calcaneus was placed on the force plate located in the lever arm of the instrument. The torque was measured by the use of a force plate and gravity corrected by the weight of leg and foot. The lever arm angular velocity was a constant 5º/s. The electrical motor (SEW eurodrive, Belo Horizonte, Brazil) of the flexmachine which passively extended or flexed the participant knee was activated by a two buttons remote control.
Figure 1: Flexmachine.
Electromyography (EMG) recording: Hamstring and triceps surae electrical activities were measured by Ag/AgCl surface electrodes (Kendall Midi-Trace® 200 Foam) at 1kHz. Hamstring electrodes were placed midway between isquial tuberosity and medial condyle. To place the electrodes over the medial gastrocnemius, participants were asked to perform a plantar flexion against examiner resistance. The electrodes were placed on one third of the distance between medial condyle and calcaneus according to McHugh et al. (1992). The EMG signal was full wave rectified and filtered by 15Hz second order Butterworth filter. The EMG signal was recorded in order to assure that passive torque measures were not influenced by the contractile elements during stretch maneuvers. The registration of EMG signal of hamstring muscle started 2s prior to stretch and was used to calculate the hamstring resting activity (mean ± 2 standard deviation). Maximum ROM and maximum passive torque were considered as the highest registered values without exceeding the EMG resting activity. Therefore, muscle resistive torque due to stretch could be considered passive, since the torque-angle curve registered during stretch maneuver was performed without significant hamstring EMG activity. Experimental Protocol: A familiarization session was performed at least 24 hours before testing session. At familiarization session body mass, height and lower leg mass were measured. Then volunteers were positioned on flexmachine and received all instructions. Each participant performed at least 3 trials until they felt secure to the instrument. During the testing session, participants were asked to push the first remote button to start the flexmachine, so that the lever arm started to move until the maximum tolerated knee ROM was reached. At the moment of the maximum tolerated knee ROM, the participants pressed the second button, which returned the lever arm to starting position. By the use of DasyLab 5.0 software the passive torque and knee angle were plotted into a torque-angle curve and stiffness was calculated by the following methods: a) Stiffness10% as the difference of passive torque divided by the difference of knee angle at 90% and 100% of maximum passive ROM.
ISBS 2011
924
Porto, Portugal
Vilas-Boas, Machado, Kim, Veloso (eds.) Biomechanics in Sports 29
Portuguese Journal of Sport Sciences 11 (Suppl. 2), 2011
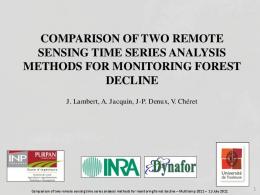
b) StiffnessIII as the difference of passive torque divided by the difference of knee angle at beginning and end of the third part of the passive stretching period. Statistical Analysis: In order to verify the reliability the intra-class correlation coefficients (ICC) of the two stiffness variables were calculated. A descriptive analysis was performed in order to calculate mean and standard deviation of body mass, height and passive stiffness variables (Stiffness10%, StiffnessIII). Shapiro-Wilks normality test was performed to verify normal distribution of the variables. Stiffness10% and StiffnessIII were compared using paired T-test and then correlated using Pearson productmoment coefficient. Data were analyzed with PASW Statistics 18.0 software and statistical significance level was set at 0.05. RESULTS AND DISCUSSION: ICC of Stiffness10% was 0.86 and of StiffnessIII 0.95 respectively, which means that two measures are high reliable. Shapiro-Wilks test showed a non-significant result for stiffness 10% (p=0.188) and stiffnessIII (p=0.367), which demonstrates that parametric test can be applied. The mean and standard deviation were 0.72 Nm/° (±0.52) for stiffness10% and 0.70 Nm/° (±0.31) for stiffnessIII (FIGURE 2) which result in a CV of 0.72 for stiffness10% and 0.44 for stiffnessIII. The Pearson product-moment coefficient (r) was 0.85 (p < 0.001). Paired T-test results showed no significant difference between variables (p= 0.629) 1,4 1,2
Stiffness [Nm/°]
1,0 0,8 0,6 0,4 0,2 0,0 Stiffness 10%
Groups
Stiffness III
Figure 2: Mean and standard deviation of Stiffness10% and StiffnessIII.
The results of the present study showed a high, significant correlation between results obtained by both methods of calculating stiffness, without significant difference between their means. These results indicate that both methods generate similar information about the MTU stiffness. A possible explanation for these results is the shape of the passive torque-angle curve and its relation with the studied methods. Magnusson et al. (1996) described that the curve can be divided into three parts; an initial toe, a transition period and a linear portion. Even though these methods used different stretching amplitudes (67-100% vs. 90-100% of passive ROM) represented by different parts of the curve to calculate stiffness, both methods use data from the linear section of the curve. The smaller coefficient of variation found on stiffness III (CV = 44%) in comparison with stiffness10% (CV= 72%) shows that this variable is more stable which might indicate a higher reliability. Therefore future studies may benefit from stiffness III method. CONCLUSION: Since the results of ICC for the two investigated variables indicate a high reliability, it can be concluded that the there is no significant difference between the results of the two frequently used methods of calculating passive stiffness, and that there is a high correlation coefficient between these variables.
ISBS 2011
925
Porto, Portugal
Vilas-Boas, Machado, Kim, Veloso (eds.) Biomechanics in Sports 29
Portuguese Journal of Sport Sciences 11 (Suppl. 2), 2011
REFERENCES: Halbertsma, J. P., & Goeken, L. N. (1994). Stretching exercises: effect on passive extensibility and stiffness in short hamstrings of healthy subjects. Arch Phys Med Rehabil, 75(9), 976-981. Magnusson, S. P., Aagaard, P., Dyhre-Poulsen, P., & Kjaer, M. (2001). Load-displacement properties of the human triceps surae aponeurosis in vivo. J Physiol, 531(Pt 1), 277-288. Magnusson, S. P., Simonsen, E. B., Aagaard, P., Boesen, J., Johannsen, F., & Kjaer, M. (1997). Determinants of musculoskeletal flexibility: viscoelastic properties, cross-sectional area, EMG and stretch tolerance. Scand J Med Sci Sports, 7(4), 195-202. Magnusson, S. P., Simonsen, E. B., Aagaard, P., Sorensen, H., & Kjaer, M. (1996). A mechanism for altered flexibility in human skeletal muscle. J Physiol, 497 ( Pt 1), 291-298. McHugh, M. P., Magnusson, S. P., Gleim, G. W., & Nicholas, J. A. (1992). Viscoelastic stress relaxation in human skeletal muscle. Med Sci Sports Exerc, 24(12), 1375-1382. Peixoto,G. H. C., Moreira Júnior, L. A., Bergamini, J. C., Bhering, E. L., Menzel, H. J., Pertence, A. E. & Chagas, M. H. (2007). The chronic effect of strength and flexibility training on stiffness and range of motion. XXV ISBS Symposium, Ouro Preto, Brazil; 436. Reid, D. A., & McNair, P. J. (2004). Passive force, angle, and stiffness changes after stretching of hamstring muscles. Med Sci Sports Exerc, 36(11), 1944-1948.
ISBS 2011
926
Porto, Portugal