JUNE 2008
NOTES AND CORRESPONDENCE
589
Comparison of Two Raindrop Size Distribution Retrieval Algorithms for X-Band Dual Polarization Observations MARIOS N. ANAGNOSTOU
AND
EMMANOUIL N. ANAGNOSTOU
Department of Civil and Environmental Engineering, University of Connecticut, Storrs, Connecticut
JOTHIRAM VIVEKANANDAN National Center for Atmospheric Research, Boulder, Colorado
FRED L. OGDEN Department of Civil and Architectural Engineering, University of Wyoming, Laramie, Wyoming (Manuscript received 6 March 2007, in final form 5 November 2007) ABSTRACT In this study the authors evaluate two algorithms, the so-called beta () and constrained methods, proposed for retrieving the governing parameters of the “normalized” gamma drop size distribution (DSD) from dual-polarization radar measurements. The  method treats the drop axis ratio as a variable and computes drop shape and DSD parameters from radar reflectivity (ZH), differential reflectivity (ZDR), and specific differential phase shift (KDP). The constrained method assumes that the axis-ratio relation is fixed and computes DSD parameters from ZH, ZDR, and an empirical relation between the DSD slope and shape parameters. The two techniques are evaluated for polarimetric X-band radar observations by comparing retrieved DSD parameters with disdrometer observations and examining simulated radar parameters for consistency. Error effects on the  method and constrained method retrievals are analyzed. The  approach is found to be sensitive to errors in KDP and to be less consistent with observations. Large retrieved  values are found to be associated with large retrieved DSD shape parameters and small median drop diameters. The constrained method provides reasonable rain DSD retrievals that agree better with disdrometer observations.
1. Introduction Obtaining accurate estimates of rain rates R at high spatial and temporal resolution as well as the hydrometeor size distribution and phase is an important goal in radar meteorology. Rain rate can be estimated from radar reflectivity Z using a standard Z–R relation on a physical basis using convective–stratiform rain classification information (Anagnostou and Krajewski 1999; Liu and Chandrasekar 2000). A Z–R relation is obtained by regression analysis of gauge measurements and radar reflectivity and from drop size distribution (DSD) spectra measured by aircraft and in situ dis-
Corresponding author address: Prof. Emmanouil N. Anagnostou, Civil and Environmental Engineering, U-37, University of Connecticut, Storrs, CT 06269. E-mail:
[email protected] DOI: 10.1175/2007JHM904.1 © 2008 American Meteorological Society
drometers. However, the standard Z–R relation does not carry enough information to account for the climatological and orographic uniqueness of each location and temporal changes in the DSD. Thus, it cannot provide accurate rain-rate estimates for different types of storms associated with varying microphysical processes. The relation between radar reflectivity and rain rate can be analytically estimated only if the DSD is specified. Further, the rain DSD could relate microphysical processes of evaporation, accretion, and precipitation rate together with vertical air motion in a bulk sense. Hence, various rain-rate estimators are derived using multiple polarimetric radar observations, that is, reflectivity, differential reflectivity, and differential propagation phase shift that are related to DSD (Doviak and Zrnic´ 1993). Dual-polarization weather radars have a significant advantage over single-polarization systems because
590
JOURNAL OF HYDROMETEOROLOGY
they allow multiparameter measurements using orthogonal polarization states. As orthogonal linearly polarized electromagnetic waves propagate through an atmospheric medium containing distributed hydrometeor targets, the radiation undergoes scattering, differential attenuation, differential phase shift, and depolarization due to the oblate shape of raindrops. These multiparameter measurements carry significant information that is very useful for estimating rain-path signal attenuation, raindrop particle size, and rainfall rate owing to the strong relationship of raindrops shape with size discussed in a subsequent section. Seliga and Bringi (1976, 1978) first used polarimetric radar data assuming an exponential DSD to retrieve the median volume diameter D0 (mm) of rainfall by directly relating to the differential reflectivity ZDR (dB) measurement (i.e., the ratio of horizontal to vertical polarization reflectivity). Extensive research on fittings to observed raindrop spectra suggests that over short time periods commensurate with radar measurements, DSDs are more typically represented by a gamma distribution (Ulbrich 1983), N共D兲 ⫽ N0D exp共⫺⌳D兲,
共1兲
where N0 (m⫺3 mm⫺1⫺) is a number concentration parameter, is a distribution shape parameter, ⌳ (mm⫺1) is a slope term, and D (mm) is the drop equivalent volume diameter. However, since the gamma DSD is described by three parameters, it requires three independent measurements or relationships. Several techniques have been proposed to estimate the governing gamma DSD model parameters in rainfall from radar measurements (Testud et al. 2000; Bringi and Chandrasekar 2001; Gorgucci et al. 2001, 2002a,b; Bringi et al. 2002; Brandes et al. 2004; Matrosov et al. 2005; Park et al. 2005). Most of these were focused on estimating D0 and/or the N0, but not all three parameters that characterize the gamma distribution. In this study we examine two of the retrieval techniques modified here to estimate all three DSD parameters from dual-polarization X-band observations. The first retrieval technique is an adaptation for X-band of the technique proposed by Zhang et al. (2001) and later revised by Brandes et al. (2004), which is based only on the two power-related radar parameters: the reflectivity at horizontal polarization ZH (dBZ ) and the differential reflectivity ZDR (dB). This technique assumes that the axis-ratio relation is fixed and computes DSD parameters from horizontal reflectivity ZH (dBZ ) and differential reflectivity ZDR (dB) to estimate two governing parameters that characterize the normalized gamma distribution (NW and D0), while for the estimation of
VOLUME 9
the third parameter () an empirical relation between the DSD slope and shape parameter is used to derive from the above-estimated DSD parameters. The –⌳ relation essentially reduces the three-parameter normalized gamma DSD to a two-parameter model. The second method examined was first implemented by Gorgucci et al. (2001, 2002a,b) for C band, and by Bringi et al. (2002) for S band. The technique retrieves the rain DSD parameters from ZH, ZDR, and the nonpower-related specific differential propagation phase shift (KDP). The procedure yields the mean axis ratio of the drops, the DSD shape factor, which is a normalized number concentration, and the DSD median volume diameter. There is some uncertainty with the use of KDP for DSD parameter retrieval; KDP is computed from measurements of differential propagation phase shift, which can be noisy, particularly at lower rain rates. To reduce uncertainty in KDP, the differential phase measurements are filtered in range, often over several kilometers (e.g., Ryzhkov and Zrnic´ 1996; Hubbert et al. 1993). However, retrievals of drop mean shape with KDP can produce large variations in space and time, which have not been independently verified. Furthermore, Illingworth and Blackman (2002) argue that the redundancy among ZH, ZDR, and KDP precludes the retrieval of all three DSD parameters in Eq. (1) with this parameter set. Bringi et al. (2002) applied the method only to situations in which KDP ⱖ 0.3° km⫺1 (rain rates ⬎20 mm h⫺1). Hence, the technique has limited application for general DSD retrievals. In section 2 we provide background information on radar observations and a brief review of the attenuation correction algorithm. Section 3 gives an overview of the data used in this study. The DSD retrieval techniques are presented and evaluated in section 4, using disdrometer data. Finally, in section 5, we demonstrate a limited evaluation of the X-band DSD estimates from the two techniques using in situ Joss–Waldvogel-type (JW) disdrometer (Joss and Waldvogel 1967) measurements available from National Research Institute for Earth Science and Disaster Prevention (NIED), Ebina, Japan.
2. Rainfall microphysics The difference between the scattering amplitudes at the two polarizations depends on the raindrop shape (else defined as axis ratio for approximate oblate spheroids), which in turn is related to size. The form of the DSD and the raindrop axis-ratio model are crucial in the development of polarimetric rain estimators and must be correctly modeled to accurately correct for attenuation and to retrieve DSD parameters from radar
JUNE 2008
591
NOTES AND CORRESPONDENCE
measurements. The raindrop size distribution model used for this purpose is the ‘‘normalized gamma distribution’’ function as presented in recent polarimetric radar rainfall studies (Willis 1984; Testud et al. 2001; Bringi et al. 2004): N共D兲 ⫽ NW f 共兲
冉 冊 D D0
e⫺共3.67⫹兲
冉 冊共mm D
D0
⫺1
m⫺3兲, 共2兲
with f 共兲 ⫽
共3.67 ⫹ 兲共⫹4兲 , ⌫共 ⫹ 4兲 3.674
6
共3兲
where NW (mm⫺1 m⫺3) is called the “normalized intercept parameter” and is the same as N0 of an equivalent exponential DSD, which has the same liquid water content (LWC, g m⫺3) and raindrop median volume diameter (D0, mm) as the normalized gamma DSD, while the is the shape parameter (unitless). The governing parameters of the gamma DSD model (NW, D0, and ) can be estimated from raindrop spectra by first calculating D0 and LWC, and then NW (mm⫺1 m⫺3) as a direct derivative from LWC and D0 as follows: NW ⫽
冉 冊
3.674 LWC . w D40
共4兲
The shape parameter can then be determined by minimizing (with respect to ) the least squares difference of calculated [from Eq. (2)] versus observed drop counts over a range of drop diameter bins. As indicated by past investigations based on models and observations, the shape of raindrops can be well approximated by oblate spheroids (e.g., Pruppacher and Beard 1970; Beard and Chuang 1987; Bringi et al. 1998). The spheroid minor-to-major axis ratio (r) can be approximately related to the equivolumetric spherical diameter (D). In this study, two raindrop shape–size relationships will be used. The first relationship is given by Brandes et al. (2002) r ⫽ 0.9951 ⫹ 0.02510D ⫺ 0.03644D2 ⫹ 0.00503D3 ⫺ 0.0002492D4.
共5兲
The second is a simple model for the axis ratio (r) based on a linear fit to wind tunnel and given by the linear relationship between r and D (D is in mm) originally presented by Pruppacher and Beard (1970): r ⫽ 1.03 ⫺ 0.062D共1 ⱕ D ⱕ 9 mm兲.
共6兲
Gorgucci et al. (2000) assumed a simple linear model for axis ratio versus size of the form
r ⫽ 1.03 ⫺ D
共7兲
and derived radar-based estimators of . A point to note about this relationship is that  may vary and that this variability can be determined on the basis of polarimetric radar parameters (Gorgucci et al. 2000, 2001; Matrosov et al. 2002; Bringi et al. 2003).
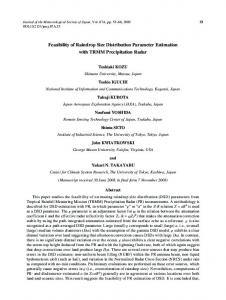
3. Data In this study we use radar and disdrometer data from Ebina, Japan (35.4°N, 139.4°E), where NIED is operating a dual-polarization and Doppler X-band radar (named MP-X) (Maki et al. 2005). For the validation of MP-X there is a network of in situ stations that consists of four rain gauges and three JW disdrometers at approximate 10-km intervals along an azimuth of about 257° from the radar site (the sites are shown in Fig. 1). For the objectives of this study we used about 17 h of coincident MP-X and JW measurements from the Shibusawa (SBS) site (⬃18-km range from the radar) during the passage of Typhoon Etau (Kabayan) on 9 August 2003. As shown in Fig. 1 the disdrometer measured both high (80–150 mm h⫺1) and moderate (50–30 mm h⫺1) rainfall rates in this storm passage. Data from the other two disdrometer sites were either not available or unreliable due to the severe blockage of the radar ray. The JW drop counts were quality controlled and a 3-min time-average window was used to remove the noise in the DSDs. The DSD model of Eq. (2) was fit to the 3-min raindrop spectra. For the typhoon storm case the JW spectra gave D0 and log10NW with modes close to 1.5 (mm) and 3.5 (NW in mm⫺1 m⫺3), respectively. Large numbers of negative ’s were not observed and the mode of is close to 4. MP-X provided volume scan measurements from 11 elevation sweeps with a repeat time of 3 min. Here we used data from the second and third elevation scan (1.1° and 2.1°) because lower elevation angles are affected by beam blockage or ground clutter over the SBS site. On the basis of the 3-min DSD parameter sets determined from raindrop spectra the MP-X radar variables (ZH, ZDR, KDP, AH, ADP, etc.) at X-band frequency are computed from T-matrix scattering calculations (Barber and Yeh 1975), assuming 1) the axis-ratio models of Eqs. (5) and (7), 2) a Gaussian canting angle distribution with zero mean and standard deviation 10°, and 3) an 8-mm maximum drop diameter. The dielectric constant of the water was evaluated for an average atmospheric temperature (20°C) of the region of the DSD spectral observations. The disdrometer-calculated radar (at MP-X frequency) parameters are used next to determine the DSD relationship parameters and evaluate the algorithms.
592
JOURNAL OF HYDROMETEOROLOGY
VOLUME 9
FIG. 1. Map showing the locations of the MP-X radar (⫹) and the rain gauge networks (ⵧ) during the observation in 2003 (taken from Park et al. 2005). The arrow shows the JW (SBS site) disdrometer location used in this study.
4. Description of the DSD parameter retrieval algorithms Two methods originally developed for S-band dualpolarization measurements, named the constrained method and  method, are parameterized and evaluated here for the X-band frequency.
a. The constrained method Many studies have shown that the governing parameters of the gamma DSD model are not mutually independent. This aspect can be of great significance because it can help to reduce the number of unknowns, and thus enable the retrieval of the DSD parameters from a pair of more independent radar measurements, that is, ZHmm (mm6 m⫺3) and ZDR (dB). The method starts with the estimation of D0 and LWC parameters based on relationships derived from scattering calculations using raindrop spectra and the Brandes et al. (2002, 2004) axial ratio model [Eq. (5)]. The relationships between the nonattenuated X-band radar parameters [ZHmm (mm6 m⫺3) and ZDR (dB)] with D0 (mm) and LWC (g m⫺3) are as follows: 2 3 ⫹ dZDR , D0共mm兲 ⫽ a ⫹ bZDR ⫹ cZDR
共8兲
2 3 4 共BZDR⫹CZDR⫹DZDR⫹EZDR兲
LWC共g m⫺3兲 ⫽ AZHmm10
.
共9兲
Having determined D0 and LWC, NW can be calculated through Eq. (4). The last parameter to be estimated is the shape parameter . Analysis of DSD data revealed a good correlation between and ⌳ that led to the derivation of an empirical –⌳ relation (Zhang et al. 2001). The relationship is conditioned to drop counts greater than 1000 min⫺1 and rain rates ⬎5 mm h⫺1 to better retrieve values of and ⌳ associated with higher rain rates and larger number of drop counts. The functional form of the relationship is ⌳共mm⫺1兲 ⫽ ␥ ⫹  ⫹ ␣2,
共10兲
and for a gamma DSD the D0 is related to and ⌳ according to the following relationship: ⌳D0 ⫽ 3.67 ⫹ .
共11兲
Combining the above relationships the following equation for is obtained:
␥1 ⫹ 1 ⫹ ␣12 ⫽ 0,
共12兲
where ␣1 ⫽ ␣D0, 1 ⫽ D0 ⫺ 1, and ␥1 ⫽ ␥ D0 ⫺ 3.67. Solving the above quadratic equation yields two solutions, from which the that is within the physically acceptable range of ⫺2 and 12 is selected. Table 1
TABLE 1. Fitted coefficients of Eqs. (8)–(12) from the measured DSD spectra. a 0.5
b 1.5
c ⫺0.4
d 0.03
A 10
⫺2.9
B
C
D
E
␣

␥
⫺2.48
1.72
⫺0.5
0.06
0.008
0.3
3.13
JUNE 2008
593
NOTES AND CORRESPONDENCE
shows the coefficients of this technique’s X-band frequency determined from the DSD spectra in Japan.
b. The  method This method treats the raindrop shape–size relationship, or raindrop axis-ratio model of Eq. (7), as variable. The method starts with estimating the  parameter (hence the name of the method) of the linear axisratio model from the nonattenuated radar parameters [ZHmm (mm6 m⫺3), ZDR (dB), and KDP (° km⫺1)] using the algorithm described by Gorgucci et al. (2000) and modified by Park et al. (2005) for X-band frequency using the same DSD spectra from Japan:
 ⫽ 0.9425
冉
KDP ZHmm
冊
0.2624
共DR ⫺ 1兲0.377,
共13兲
where DR ⫽ 100.1ZDR is the differential reflectivity in linear units. This method uses KDP, the standard error of which depends on and varies according to the number of radar samples, the amount of range averaging performed and the type of precipitation. Aydin et al. (1995) for S-band radar measurements determined an error of ⫾0.5° km⫺1 for KDP while Gorgucci et al. (2002a,b) provided a lower estimate for the KDP error, that is, 0.32° km⫺1. For X-band measurements, Matrosov et al. (2005) estimated an error of about 20% in KDP, while Park et al. (2005) gives an estimate of 0.3° km⫺1. The method uses the estimated  parameter to retrieve D0 and NW for polarimetric measurements exceeding the thresholds of 0.3° km⫺1 for KDP and 35 dBZ and 0.2 dB for ZH and ZDR, respectively, and given by Park et al. (2005) for X band: 0.057 共0.03 D0共mm兲 ⫽ 0.627Z Hmm DR
⫺1.22
0.07 ⫺0.03 共DR NW共mm⫺1 m⫺3兲 ⫽ 2.97Z Hmm
兲
⫺1.26
,
共14兲
兲
共15兲
.
For the retrieval of NW and D0 in low-intensity rainfall Bringi et al. (2002) suggested power-law relations based on disdrometer observations and drop shapes given by Beard and Chuang (1987) and Andsager et al. (1999). Similarly, the derived relationships between DSD (D0 and NW) and X-band radar parameters for ZH ⬍ 35 dBZ and ZDR ⱖ 0.2 dB are as follows: NW共mm⫺1 m⫺3兲 ⫽
18.87ZHmm D7.692 0
0.34 D0共mm兲 ⫽ 1.38Z DR .
,
共16兲 共17兲
For ZH ⬍ 35 dBZ and ZDR ⬍ 0.2 dB the corresponding relationships are
FIG. 2. Time series comparisons of ZH and ZDR parameters from raindrop spectra calculations and attenuation-corrected MP-X radar measurements.
NW共mm⫺1 m⫺3兲 ⫽
冉 冊 冉 冊 1.465 ␥
D0共mm兲 ⫽ 1.465 where
␥ ⫽ 1.38
7.692
共18兲
,
ZHmm NW
0.13
冉 冊 ZDR
0.25 Z Hmm
0.13 ⫽ ␥Z Hmm ,
共19兲
0.34
.
共20兲
To estimate the constrained –⌳ relationship of Eq. (12) is used, which is a modification to the original approach described in Bringi et al. (2002).
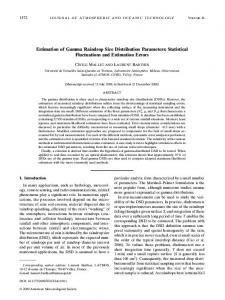
5. Algorithm evaluation This study seeks to investigate the accuracy in the estimation of DSD gamma model parameters from Xband polarimetric measurements. Joint radar (from MP-X) and DSD (from JW) data from the Typhoon Etau (Kabayan) storm case are used to evaluate the above DSD retrieval techniques. As described in section 3, the three gamma DSD parameters D0, NW, and were determined by fitting the model to 3-min JW spectra observations. Subsequently, those DSD model parameters were used to simulate X-band radar parameters (i.e., ZHmm, ZDR, KDP etc.) on the basis of T-matrix calculations. The MP-X radar observations were corrected for rain-path attenuation using the Anagnostou et al. (2006) algorithm and matched with the disdrometer-derived DSD and radar parameters. Figure 2 shows time series comparison of ZH (dBZ ) and ZDR parameters from the attenuation-corrected MP-X measurements and the JW disdrometer calculations. The figure shows strong correlations for both ZH
594
JOURNAL OF HYDROMETEOROLOGY
VOLUME 9
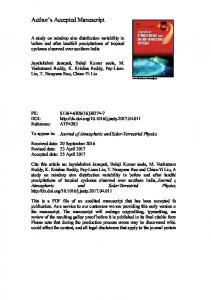
FIG. 3. Frequency histograms of log10NW (NW; mm⫺1 m ), D0 (mm), and parameters calculated from raindrop spectra (dark gray) and retrieved from MP-X radar parameters using the constrained (light gray) and  (dash line) methods, shown for reflectivity values greater than 20 dBZ. ⫺3
(r ⫽ 0.99) and ZDR (r ⫽ 0.98) and negligible biases (0.984 and 0.986) in the MP-X attenuation-corrected ZH and ZDR measurements. The MP-X radar measurements were used to retrieve the three constrained gamma distribution parameters. The constrained- and -method retrievals were compared using two sets of frequency histograms. The first set shown in Fig. 3 included all rain rates where ZH ⬎ 20.0 dBZ and ZDR ⬎ 0.1 dB. The second histogram shown in Fig. 4 includes only moderate-to-low rain rates where 35 ⬎ ZH ⬎ 20.0 dBZ and ZDR ⬎ 0.1 dB. The constrained-method has better statistical consistency with the observed DSD spectra parameters and exhibits high correlations for all three governing parameters (r of 0.88, 0.78, and 0.57 for D0, log10NW, and ). The corresponding correlations for the  method were notably weaker (r of 0.67, 0.56, and 0.46, respectively). As for the biases, the D0 and log10NW in both methods were close to one (1.03 and 0.99 for the constrained method, and 0.95 and 0.98 for the  method), and had moderate standard deviation (0.45 mm and 0.47 mm⫺1 m⫺3 for the constrained method and 0.56 mm and 0.59 mm⫺1 m⫺3 for the  method). In the case
of the parameter we note large biases and variability in the estimates from both methods. For the constrained method there was a bias of 65% and a standard error of around 5, while for the  method the bias was 36% with a standard error near 6. Table 2 summarizes the comparison statistics of the constrained and  method MP-X retrievals with the JW observations. Figure 5 shows the joint frequency plots of log10NW versus D0. This figure shows similarities in terms of the slope between the radar retrievals and the spectra measured parameters. The constrained method, with the same number of D0 and log10NW occurrences, produced smaller values of log10NW compared to the JW disdrometer spectra. At the same time for the same number of occurrences in log10NW there were no frequent large D0 values compared to the JW disdrometer spectra. In the constrained and  method retrievals the two cores (the dark eye in the center of the plot) in the main body of the shape are different from the shape of the disdrometer retrievals. However, in the case of the  method there is a separate core for log10NW below the 3 mm⫺1 m⫺3 similar to the one in the histogram of log10NW in Fig. 3. Figures 6 and 7 show time series comparisons of the
JUNE 2008
595
NOTES AND CORRESPONDENCE
FIG. 4. Same as in Fig. 3, but statistics are shown for reflectivity values between 20 and 35 dBZ.
two DSD retrievals with in situ disdrometer observations, and the corresponding simulated radar parameters. The constrained method gave the best performance when compared to DSD parameter calculations and radar parameter simulations from the measured JW disdrometer spectra. Figure 7 shows the consistency of the two retrieval algorithms relative to the radar observations. Strong correlation is seen (r ⫽ 0.89 and r ⫽ 0.98) as is low bias (⫺1.0031 dBZ and ⫺0.2866 dB) in both ZH and ZDR for the constrained method. Weaker correlations are seen in the case of the 
method (r ⫽ 0.81 and r ⫽ 0.84) as are higher biases (⫺1.101 dBZ and ⫺0.986 dB). Overall, the constrained method is found to be more consistent with the disdrometer observations both in the predicted DSD parameters and the simulated radar parameters. Statistical comparisons of the MP-X retrieved versus disdrometer-calculated DSD parameters determined for different rainfall-rate categories are presented in Fig. 8. The figure shows the mean relative error (MREi) and efficiency coefficient (eff) defined as MREi ⫽
兺 Ni
TABLE 2. Summary of DSD comparison statistics between the two methods and JW. Correlation 0.88 0.78 0.57 0.67 0.56 0.46
Bias
RMSE
JW vs constrained 1.0317 0.454 0.9936 0.469 1.6531 5.454 JW vs  0.945 0.565 0.98 0.598 0.64 6.012
D0 log10NW D0 log10NW
MPXDSD ⫺ JWDSD , JWDSD
eff ⫽ 1 ⫺
var共MPXDSD ⫺ JWDSD兲 var共JWDSD兲
共21兲
,
共22兲
where Ni is the number of MP-X/JW samples in rain rate category i; MPXDSD represents DSD parameters retrieved (either using the constrained or  method) from MP-X corrected for attenuation radar measurements; and JWDSD represents DSD parameters determined from the JW-measured raindrop spectra. The mean error in D0 and log10NW estimation from
596
JOURNAL OF HYDROMETEOROLOGY
VOLUME 9
FIG. 5. Contour plots of joint frequency between log10NW (NW; mm⫺1 m⫺3) and D0 (mm) parameters: (left) calculated from JW observed raindrop spectra, (middle) retrieved from MP-X using the constrained method, and (right) retrieved from MP-X using the  method.
FIG. 6. Time series comparisons of the three DSD governing parameters of the gamma distribution model retrieved from MP-X measurements using the two methods (constrained method: dark gray line;  method: light gray line) and estimated from the JW observed raindrop spectra.
JUNE 2008
NOTES AND CORRESPONDENCE
597
FIG. 7. Time series comparisons of ZH and ZDR parameters calculated from the DSD gamma model with parameters retrieved from MP-X observations using the two DSD retrieval algorithms and determined from the JW raindrop spectra.
the constrained method was below 2% and weakly dependent on rainfall rate. The mean error for was slightly higher and more dependent on rainfall rate. Specifically, it ranged from values well below 2% at very low rain rates (⬍0.5 mm h⫺1) to about 35% for rain rates greater than 25 mm h⫺1. The corresponding mean relative errors for the  method have shown that the method tended to underestimate (overestimate) the D0 (log10NW) in the range of 7% (1%) to 11% for low (⬍0.5 mm h⫺1) to high (⬎25 mm h⫺1) rain rates. In terms of the mean relative error ranged from 50% to 30% with increasing rain rates. Comparing the mean relative error statistics of the two techniques the constrained method was deemed to have lower errors and weaker dependence on rain rate. In terms of the efficiency scores significant differences between the two techniques were seen. Efficiency is a statistical measure of the variability of the error normalized by the natural variability of the estimated parameter and is scaled from ⫺⬁ to 1. A value of 1 indicates that the estimate is perfect. An efficiency value of 0 indicates that the estimation is no better than using simply the arithmetic average of the predicted parameter. A negative efficiency value indicates that the estimation is worse than using the mean value of the predicted parameter. Based on the above description of efficiency we make the following observations from Fig. 8: the constrained method gave high efficiency values for D0 and log10NW with very weak dependence on rainfall rate. On the
contrary, the  method exhibited strong dependence on rainfall rate (especially for D0) and values well below those from the constrained method. In particular, for the log10NW estimation efficiency scores were below zero, indicating weakness of the ability of the technique to capture the variability of the parameter. In terms of the parameter, both techniques did not give good efficiency values. The constrained method gave zeros over the entire rain-rate range tested, indicating that it did not perform any better than using the climatological (or long-term average) value of . The  method resulted in significantly negative values, which indicated poor performance relative to the use of a climatological value of the parameter.
6. Conclusions This study presented a comparison of two DSD retrieval techniques from polarimetric radar observations. The three-parameter “normalized” gamma DSD model was used to model the drop size distribution. The retrieval algorithms tested were originally developed and evaluated to estimate gamma DSD parameters from C- and S-band polarimetric radar measurements. In this study these methods were adapted for use at X band and evaluated using disdrometer and polarimetric X-band radar observations. With the  method, an empirical relation, the axis ratios of oscillating drops, are computed from radar
598
JOURNAL OF HYDROMETEOROLOGY
VOLUME 9
FIG. 8. (left) Mean relative error and (right) efficiency scores of D0, log10NW, and parameters estimated from the two DSD retrieval algorithms (constrained and  method) applied on MP-X observations vs parameters calculated from the JW raindrop spectra, presented for different rainfall rate thresholds (mm h⫺1).
measurements of ZH, ZDR, and KDP. The procedure is founded on simulations with variable  and random distributions of the governing parameters of the gamma DSD that are used to establish relationships with the radar variables ZH, ZDR, and KDP. The constrained method incorporates the ZH, ZDR measurements and an empirical relation between the slope and shape parameters of the DSD as determined from disdrometer measurements. The –⌳ relation reduces the normalized gamma DSD from three to two parameter distributions in that only two radar measurements are required. Axis ratios are assumed constant for the radar measurement volume. The two methods were compared and evaluated using actual X-band (MP-X) polarimetric radar measurements of a typhoon storm in Japan. In situ JW disdrometer spectra observations taken in approximately 10 km from the radar were used as reference. For the evaluation of the algorithms time series plots were used to compare the three gamma model parameters estimated using radar measurements versus those determined di-
rectly from raindrop spectra. Overall, the constrained method showed better performance compared to the  method. Error statistics showed low relative error in the constrained method for D0, log10NW, and , while for the  method higher errors and a systematic underestimation in D0 and log10NW for moderate and large rainfall were seen. The efficiency statistic for the constrained method was shown to only moderately increase with rainfall indicating that MP-X attenuationcorrected time series can be used for estimation of DSD even in moderate to high rainfall rate cases using that method. To summarize, the major disadvantage of the  method is that it introduces errors from the use of KDP. Furthermore, the use of a linear axis–ratio relation may not be representative of actual raindrop variability, and the power-law fit employed does not guarantee an unbiased estimator with minimum error because the relations may not capture the true functional form and account for the error distribution (Illingworth and Blackman 2002). The constrained method avoids the use of
JUNE 2008
NOTES AND CORRESPONDENCE
simulated axis ratio and the error propagation associated with the use of KDP. The procedure works reasonably well at both low and high rain rates and provides relatively accurate retrieval of the DSD parameters. However, additional studies are needed to verify the stability of the constrained method in different storm types and radar ranges. Future extensions of this study include investigating alternative approaches to the problem of estimating DSD parameters. There are several aspects we consider including a variable axial ratio model and an iterative technique that would use precipitation classification as a means of deciding on the selected axis-ratio model. Other approaches such as neural networks and fuzzy logic should be tested as well. Acknowledgments. The study was supported by an NSF-CAREER grant to Prof. E. N. Anagnostou. The MP-X and disdrometer data from Japan were provided by Dr. Maki of the National Research Institute for Earth Science and Disaster Prevention (NIED), Ebina, Japan. We acknowledge and appreciate insightful comments by three anonymous reviewers. REFERENCES Anagnostou, E. N., and W. F. Krajewski, 1999: Real-time radar rainfall estimation. Part I: Algorithm formulation. J. Atmos. Oceanic Technol., 16, 189–197. Anagnostou, M. N., E. N. Anagnostou, and J. Vivekanandan, 2006: Correction for rain path specific and differential attenuation of X-band dual-polarization observations. IEEE Geosci. Remote Sens., 44, 2470–2480. Andsager, K., K. V. Beard, and N. F. Laird, 1999: Laboratory measurements of axis ratios for large drops. J. Atmos. Sci., 56, 2673–2683. Aydin, K., V. N. Bringi, and L. Liu, 1995: Estimation of rain and hail rates in mixed-phase precipitation. J. Appl. Meteor., 34, 404–410. Barber, P., and C. Yeh, 1975: Scattering of electromagnetic waves by arbitrarily shaped dielectric bodies. Appl. Opt., 14, 2864– 2872. Beard, K. V., and D. Chuang, 1987: A new model for the equilibrium shape of raindrops. J. Atmos. Sci., 44, 1509–1524. Brandes, E. A., G. Zhang, and J. Vivekanandan, 2002: Experiments in rainfall estimation with polarimetric radar in a subtropical environment. J. Appl. Meteor., 41, 674–685. ——, ——, and ——, 2004: Drop size distribution retrieval with polarimetric radar: model and application. J. Appl. Meteor., 43, 461–475. Bringi, V. N., and V. Chandrasekar, 2001: Polarimetric Doppler Weather Radar: Principles and Applications. Cambridge University Press, 662 pp. ——, ——, and R. Xiao, 1998: Raindrop axis ratio and size distributions in Florida rainshafts: An assessment of multiparameter radar algorithms. IEEE Trans. Geosci. Remote Sens., 36, 703–715. ——, G.-J. Huang, V. Chandrasekar, and E. Gorgucci, 2002: A methodology for estimating the parameters of a gamma rain-
599
drop size distribution model from polarimetric radar data: Application to a squall-line event from the TRMM/Brazil campaign. J. Atmos. Oceanic Technol., 19, 633–645. ——, V. Chandrasekar, J. Hubbert, E. Gorgucci, W. L. Randeu, and M. Schoenhuber, 2003: Raindrop size distribution in different climatic regimes from disdrometer and dual-polarized radar analysis. J. Atmos. Sci., 60, 354–365. ——, T. Tang, and V. Chandrasekar, 2004: Evaluation of a new polarimetrically based Z–R relation. J. Atmos. Oceanic Technol., 21, 612–623. Doviak, R., and D. S. Zrnic´ , 1993: Doppler Radar and Weather Observations. 2nd ed. Academic Press, 562 pp. Gorgucci, E., G. Scarchilli, V. Chandrasekar, and V. N. Bringi, 2000: Measurement of mean raindrop shape from polarimetric radar observations. J. Atmos. Sci., 57, 3406–3413. ——, ——, ——, and ——, 2001: Rainfall estimation from polarimetric radar measurements: Composite algorithms immune to variability in raindrop shape–size relation. J. Atmos. Oceanic Technol., 18, 1773–1786. ——, V. Chandrasekar, and V. N. Bringi, 2002a: Drop size distribution retrieval from polarimetric radar measurements. Proc. Second European Conf. on Radar Meteorology, Delft, Netherlands, ERAD, 134–139. ——, ——, ——, and G. Scarchilli, 2002b: Estimation of raindrop size distribution parameters from polarimetric radar measurements. J. Atmos. Sci., 59, 2373–2384. Hubbert, J. V., V. Chandrasekar, V. N. Bringi, and P. Meischner, 1993: Processing and interpretation of coherent dualpolarized radar measurements. J. Atmos. Oceanic Technol., 10, 155–164. Illingworth, A. J., and T. M. Blackman, 2002: The need to represent raindrop size spectra as normalized gamma distribution for the intercomparison of polarization radar observations. J. Appl. Meteor., 41, 286–297. Joss, J., and A. Waldvogel, 1967: A raindrop spectrograph with automatic analysis. Pure Appl. Geophys., 68, 240–246. Liu, H., and V. Chandrasekar, 2000: Classification of hydrometeors based on polarimetric radar measurements: development of fuzzy logic and neuro-fuzzy systems, and in situ verification. J. Atmos. Oceanic Technol., 17, 140–164. Maki, M., and Coauthors, 2005: Semi-operational rainfall observations with X-band multi-parameter radar. Atmos. Sci. Lett., 6, 12–18. Matrosov, S. Y., K. A. Clark, B. E. Martner, and A. Tokay, 2002: X-band polarimetric radar measurements of rainfall. J. Appl. Meteor., 41, 941–952. ——, D. E. Kingsmill, B. E. Martner, and F. M. Ralph, 2005: The utility of X-band polarimetric radar for continuous quantitative estimates of rainfall parameters. J. Hydrometeor., 6, 248– 262. Park, S.-G., V. N. Bringi, V. Chandrasekar, M. Maki, and K. Iwanami, 2005: Correction of radar reflectivity and differential reflectivity for rain attenuation at X band. Part I: Theoretical and empirical basis. J. Atmos. Oceanic Technol., 22, 1621– 1632. Pruppacher, H. R., and K. V. Beard, 1970: A wind tunnel investigation of the internal circulation and shape of water drops falling at terminal velocity in air. Quart. J. Roy. Meteor. Soc., 96, 247–256. Ryzhkov, A. V., and D. Zrnic´ , 1996: Assessment of rainfall measurement that uses specific differential phase. J. Appl. Meteor., 35, 2080–2090.
600
JOURNAL OF HYDROMETEOROLOGY
Seliga, T. A., and V. N. Bringi, 1976: Potential use of radar differential reflectivity measurements at orthogonal polarizations for measuring precipitation. J. Appl. Meteor., 15, 69–76. ——, and ——, 1978: Differential reflectivity and differential phase shift: Applications in radar meteorology. Radio Sci., 13, 271–275. Testud, J., E. Le Bouar, E. Obligis, and M. Ali-Mehenni, 2000: The rain profiling algorithm applied to polarimetric weather radar. J. Atmos. Oceanic Technol., 17, 332–356. ——, S. Oury, R. A. Black, P. Amayenc, and X. Dou, 2001: The concept of “normalized” distribution to describe raindrop
VOLUME 9
spectra: A tool for cloud physics and cloud remote sensing. J. Appl. Meteor., 40, 1118–1140. Ulbrich, C. W., 1983: Natural variations in the analytical form of the raindrop size distribution. J. Climate Appl. Meteor., 22, 1764–1775. Willis, P. T., 1984: Functional fits to some observed drop size distributions and parameterization of rain. J. Atmos. Sci., 41, 1648–1661. Zhang, G., J. Vivekanandan, and E. Brandes, 2001: A method for estimating rain rate and drop size distribution from polarimetric radar measurements. IEEE Trans. Geosci. Remote Sens., 39, 830–841.