Manhattan experimental data results with diamond showing 90% coverage at 2 ... irregularities, parking lots, traffic, terrain irregularities, details of wall material ...
IEEE JOURNAL ON SELECTED AREAS IN COMMUNICATIONS, VOL. 15, NO. 4, MAY 1997
677
Comparisons of a Computer-Based Propagation Prediction Tool with Experimental Data Collected in Urban Microcellular Environments Vinko Erceg, Member, IEEE, Steven J. Fortune, Jonathan Ling, A. J. Rustako, Jr., Fellow, IEEE, and Reinaldo A. Valenzuela
Abstract—Engineers designing and installing outdoor and indoor wireless communications systems need effective and practical tools to help them determine base station antenna locations for adequate signal coverage. Computer-based radio propagation prediction tools are now often used in designing these systems. In this paper, we assess the performance of such a propagation tool based on ray-tracing and advanced computational methods. We have compared its predictions with outdoor experimental data collected in Manhattan and Boston (at 900 MHz and 2 GHz). The comparisons show that the computer-based propagation tool can predict signal strengths in these environments with very good accuracy. The prediction errors are within 6 dB in both mean and standard deviation. This shows that simulations, rather than costly field measurements, can lead to accurate determination of the coverage area for a given system design. Index Terms—Microcells, propagation, ray-tracing.
I. INTRODUCTION
I
N this paper, we present comparisons between propagation predictions performed by a computer-based propagation prediction tool (WiSE)1 and experimental data collected in urban microcellular environments. In our study, terrain is assumed to be flat, with the transmitting and receiving antenna heights below the rooftops of the surrounding buildings, in which case the rooftop-diffracted rays can be neglected. If the antenna heights are comparable to the heights of the surrounding buildings or greater, then diffraction above the rooftops can become a dominant factor. In this case, predictions can be obtained using a full three-dimensional raytracing algorithm with rooftop diffractions. This case is not considered here. An important part of any computer-based propagation prediction tool is the building and street database on which the ray-tracing algorithm is performed. To compute predicManuscript received May 3, 1996; revised October 11, 1996. V. Erceg and A. J. Rustako, Jr. are with AT&T Labs–Research, Holmdel, NJ 07733 USA. S. J. Fortune is with Lucent Technologies, Bell Laboratories, Murray Hill, NJ 07974 USA. J. Ling and R. A. Valenzuela are with Lucent Technologies—Bell Laboratories, Holmdel, NJ 07733 USA. Publisher Item Identifier S 0733-8716(97)02670-X. 1 The Wireless System Engineering (WiSE) tool [1] was developed by AT&T Bell Laboratories researchers including the authors (now with AT&T Laboratories and Lucent Technologies). It was initially designed for indoor applications and later expanded to outdoor applications. It is used only internally, with no near future plans to make it available to the public.
tions, we used computer-aided-design (CAD) tools to generate building databases (wall files) from simple paper street maps (showing only blocks of buildings) for the areas of Manhattan and Boston where the measurements were taken. The importance of this paper is to show how accurately computer-aided propagation tools (based on ray tracing and diffraction theory) can predict signal strength in urban microcellular environments using very simple building and street databases. Extensive propagation measurements were performed in Manhattan and Boston to validate the predictions. Both individual experimental data files (propagation loss along individual streets) as well as collections of experimental data files (area coverage) were compared with predictions. The results show excellent agreement between predictions and measurements for different frequency bands and different locations. The prediction error is within 6 dB in both its mean and standard deviation. This shows that simulations, rather than costly field measurements, can lead to accurate determination of the coverage area for a given system design. When building and street databases are available, the computer-based radio propagation tools can be used to predict the signal coverage in large cities, thus allowing system designers to determine cell layouts, reuse factors, capacity, etc. The theoretical model and software of the radio propagation tool are described in Section II. The estimation of local mean power is presented in Section III. Comparisons between the experimental data and predictions are presented in Section IV. II. THEORETICAL MODEL
AND
SOFTWARE
A. Theoretical Model The theoretical model used in WiSE for outdoor locations is based upon geometrical optics (GO) and the uniform theory of diffraction (UTD) [2]–[8], [15]. The street corners are assumed to be dielectric wedges [8]. The electric field of a ray at the receiving antenna is calculated using (1) for reflected rays
0733–8716/97$10.00 1997 IEEE
Authorized licensed use limited to: Alcatel-Lucent. Downloaded on March 22,2010 at 21:03:41 EDT from IEEE Xplore. Restrictions apply.
(2)
678
IEEE JOURNAL ON SELECTED AREAS IN COMMUNICATIONS, VOL. 15, NO. 4, MAY 1997
B. WiSE Software
for rays diffracted once, and
(3) for rays diffracted twice, where is the Fresnel reflection coefficient, which is different for an electric field perpendicular to an incidence plane and for an electric field parallel to an incidence plane. It also depends upon the number of reflections, incidence angle, and the reflecting material. In our computations, we specified the reflection coefficient parameters (permittivity) and (conductivity). Also the propagation constant, ; the free space field strength; the wavelength; the propagation path length; the diffraction loss coefficient for the first wedge; the diffraction loss coefficient for the second wedge; the propagation path length from the source to the first diffracting wedge; the propagation path length from the first to the second diffracting wedge; the propagation path length from the second diffracting wedge to the receiver; and all quantities are in consistent units. The dielectric wedge diffraction constant for the parallel polarization was taken from [8], and can be calculated using
(4) where (5) is a Fresnel integral; (6) and (7) are the integers which most nearly satisfy the equations (8) are the reflection coefficients for the 0 face angle and for the face angle , respectively, where for the 90 wedge.
The WiSE propagation prediction software [1] uses a building database to determine propagation paths. The database is a collection of polygons, each representing a wall or ceiling of a building or the ground. Each polygon has a label that determines reflection coefficients. A diffracting wedge is formed whenever two polygons meet along a common edge and form a dihedral angle of more than 180 . A coverage map (such as Fig. 6 or 8) is determined by tracing propagation paths from a transmitter to a set of sample points (or bins). Typically, the sample points are the grid points of a square grid lying on a horizontal plane. WiSE finds all propagation paths up to a user-specified number of diffractions (at most four) and reflections (at most 20). Outdoor prediction uses a “ray launching” (or “pincushion”) algorithm [13]. A finite sample of the propagation directions from the transmitter is chosen. For each such direction, a ray is launched. If a ray hits a wall, then a reflecting ray is generated; if a ray hits a wedge, then a family of diffracting rays is generated. If a ray captures a sample point, then the propagation power to the sample point is recorded. A sample point is captured by a ray if it lies inside the “capture cone” of the ray; the “capture cone” is a polyhedral cone about the ray with triangular cross section. The capture cones for the initial set of rays are pairwise disjoint and together contain every point in space. Ray splitting [14] guarantees a fixed upper bound on the spatial separation of adjacent rays. A triangulation-based spatial data structure [1] allows the next wall intersected by a ray to be determined in constant time, independent of the size of the database. The contribution of multiple propagation paths to a sample point can be accumulated in two ways in WiSE, which can produce quite different results (see [2]). With the powerof-complex-sum method, each path contributes a field, with both strength and phase change from the transmitter. The total signal power is obtained from the sum of the individual complex rays. The paths may add constructively or destructively, depending upon the difference of the phase changes of the paths. With the sum-of-individual-ray-powers method, the total signal power is obtained by summing the individual ray powers. This summation predicts local mean power at the sample point, assuming no correlation of the spatial phase dependence of distinct incoming paths. Complex summation is useful if incoming paths phases are correlated; Section III describes averaging techniques useful in such cases to predict local mean power in outdoor environments. WiSE includes both a two-dimensional (includes groundreflected rays) and a three-dimensional pincushion algorithm. For the two-dimensional algorithm, the horizontal cross section of the building database must be constant above the ground. A ray is traced in the horizontal plane, using the vertical walls of the building database. If a propagation path to a sample point is found, then it is adjusted using the heights of the transmitter and sample point. If desired, a path reflecting off the ground (with the same horizontal projection) can also be generated. The two-dimensional algorithm is reasonably fast. A coverage map such as Fig. 6 or 8 requires about 10 min on a 200 MHz
Authorized licensed use limited to: Alcatel-Lucent. Downloaded on March 22,2010 at 21:03:41 EDT from IEEE Xplore. Restrictions apply.
ERCEG et al.: COMPARISON OF WiSE AND EXPERIMENTAL DATA
679
Fig. 1. 2 GHz experimental data with 10 and 20 m averaging windows.
workstation (ten reflections, two diffractions, initial angular separation of 2 , 125 000 sample points with 2 m bin size). The three-dimensional algorithm allows more complex scenarios, such as variable-height buildings, an antenna on a roof, and over-the-roof diffraction. Prediction is much slower for this algorithm, however. More details on WiSE are available in [1], particularly the indoor prediction algorithms. These papers describe the system architecture, the user interface, the data structures, and the optimization capabilities of WiSE. III. ESTIMATION
OF
LOCAL MEAN POWER
A. General Principles To estimate the local mean power of the received signal, the fast fading of the signal envelope has to be spatially averaged when using the complex sum method of combining rays. The number of samples ( ) averaged specifies a degree of certainty that the sample mean lies within some range about the true mean. This range is also called the “confidence interval.” In [9], it is shown that, assuming Rayleigh fast fading and samples measured in power (not voltage), for a 90% degree of confidence that the sample mean lies within dB, has to be 57. The 57 samples of the Rayleigh faded envelope have to be uncorrelated, which requires that the minimum distance between samples is 0.38 [9]. Therefore, the minimum distance over which the data have to be averaged is approximately 22 . At 900 MHz, 22 is approximately 7.3 m, and at 2 GHz, it is approximately 3.3 m. Fig. 1 shows the non-line-of-sight (NLOS) experimental data at 2 GHz collected in midtown Manhattan, together with the same data averaged using 10 and 20 m averaging windows. The transmitter and receiver antenna heights were 10 and 2 m, respectively. The experimental data samples were taken every 0.1 ms, which is approximately every 2 mm at a vehicle speed of 20 m/s, and then averaged every meter. From this figure, we can see that using a 20 m averaging window often fails to
follow the slow fading variation of the signal power. A 10 m averaging window is about the right size window to be used in these environments in that it follows the slow variations while giving adequate averaging over the fast ones (see [11] for a general treatment of this tradeoff). We used this window size in our analysis in Section IV for both experimental data and predicted results. When generating the coverage maps, the radio propagation tool divides the digital map into squares (bins) whose size is user-specified. For each bin, the received signal power is calculated. To calculate the local mean power, the bins are averaged using a two-dimensional sliding window. The bin size and the averaging window size have to be carefully specified so that the mean power is estimated with reasonable accuracy (confidence interval) and computation time. A potentially important issue is the precise location of the transmitting antenna. Specifically, we observe that, by moving the transmitter antenna location a couple of wavelengths, the predicted received mean signal power can vary significantly. This effect is especially strong for NLOS conditions. The reason for this is that the rays reaching a diffracting corner can add in a constructive or destructive manner. If one imagines a diffracting corner as a point source, the intensity of this point source depends on the relative phases and magnitudes of rays reaching it. By analyzing the predicted data, we find that both corner fading created by moving the transmitter and fading created by moving the receiver can have Rayleigh fading statistics at some locations. This results in two independent fading processes in cascade. In [12] (indoor environment), it was shown both theoretically and experimentally that when averaging is accomplished by moving only the receiving antenna, the result can vary as much as 2 dB when the transmitting antenna is moved by a fraction of a wavelength. In our predictions, the variation in mean received power as a result of small changes in transmitter location is much more pronounced. However, this is an artifact of the simple environmental model we use, which
Authorized licensed use limited to: Alcatel-Lucent. Downloaded on March 22,2010 at 21:03:41 EDT from IEEE Xplore. Restrictions apply.
680
IEEE JOURNAL ON SELECTED AREAS IN COMMUNICATIONS, VOL. 15, NO. 4, MAY 1997
Fig. 2. Fading statistics for the fixed and moving transmitting antenna.
ignores traffic and assumes perfectly smooth building walls. In reality, there is moving traffic, and building surfaces are rough and irregular (windows, columns, etc.), in which case ray phases are less coherent. Therefore, the dependence on the precise transmitter position should be far less pronounced. The nonidealities of the environment can be said to provide a kind of averaging, which we attempt to capture in our predictions via averaging over the transmitter position. Our results show that this way of accounting for the nonidealities leads to highly accurate predictions. B. Single and Cascaded Rayleigh Fading The probability density function of a Rayleigh fading signal envelope (field strength or voltage, not power) is given by (9) where is the mean power. By substituting is power, we get
, where
(10) The cumulative distribution function of (the probability that does not exceed a specified value ) is Prob
(11)
If there are two independent Rayleigh-distributed random variables and in cascade, the resulting random variable can be calculated as follows (we assume ): (12)
and it can be shown that (13) is the modified Bessel function of the second where kind and zero order. The cumulative distribution function of can be calculated using Prob
(14)
To investigate the effect of the transmitter antenna location on the statistics of the predicted received signal, 10 000 data points were computed with the transmitter antenna location both stationary and moving within a circle of a 1 m radius. The receiver antenna locations were randomly chosen within a 10 m 10 m square (NLOS conditions). The local mean of the received signal power within a 10 m 10 m square where the sample points were taken was approximately a constant, so that these samples represent the fast fading statistics of the received signal envelope. For both cases (fixed and moving transmitter antenna), Fig. 2 shows the CDF of the computed received signal powers, together with the theoretical results using (11) and (14). From this figure, we can see that the received signal has a Rayleigh characteristic (11) for the fixed transmitter antenna location, and the characteristic of two cascaded Rayleigh processes (14) for the varying transmitting antenna location. The probability of deep fades is higher for the varying transmitter antenna location than for the fixed transmitter antenna location. At other locations, we note that fading can be less pronounced (lower probability of deep fades), depending on the ray phases reaching the diffracting corner and the receiving antenna.
Authorized licensed use limited to: Alcatel-Lucent. Downloaded on March 22,2010 at 21:03:41 EDT from IEEE Xplore. Restrictions apply.
ERCEG et al.: COMPARISON OF WiSE AND EXPERIMENTAL DATA
681
Fig. 3. Manhattan experimental data versus prediction at 900 MHz (corner distance is 398 m).
Fig. 4. Manhattan experimental data versus prediction at 2 GHz (corner distance is 130 m).
IV. COMPARISONS OF PREDICTIONS WITH EXPERIMENTAL DATA
data were compared only on an individual street basis. The data collected at 2 GHz also contained global positioning system (GPS) and other vehicle location information, which made it possible to compute and compare area coverage plots.
A. Experimental Parameters To characterize the performance of the radio propagation tool, we have compared its predictions with the experimental data collected in Manhattan and Boston. Manhattan has mostly rectilinear streets, while some Boston areas have curvilinear streets. In Manhattan, data were collected at 900 MHz and 2 GHz; in Boston, data were collected only at 2 GHz. The transmitting and receiving antenna heights for all of the Manhattan and Boston measurements were 10 and 2 m, respectively. At 2 GHz, vertically polarized dipole antennas were used at both ends. At 900 MHz, the transmitting antenna was a vertically polarized dipole, and the receiving antenna was a monopole on a large ground plane. At both 900 MHz and 2 GHz, a CW signal was transmitted. The 900 MHz Manhattan
B. Results First, we compare predictions with experimental data on an individual street basis. The street geometry for this comparison is a rectilinear street grid such as Manhattan. The transmitter was located on one street, while the receiver was moving along an NLOS cross street. For different distances to the corner (cross street), path loss versus distance was plotted for both the experimental data and the predictions. Figs. 3 and 4 represent the local mean path loss curves where the fast fading was averaged over distance. For the predicted results, the mean path loss was also averaged over different transmitting antenna locations (within a circle of 1 m radius).
Authorized licensed use limited to: Alcatel-Lucent. Downloaded on March 22,2010 at 21:03:41 EDT from IEEE Xplore. Restrictions apply.
682
IEEE JOURNAL ON SELECTED AREAS IN COMMUNICATIONS, VOL. 15, NO. 4, MAY 1997
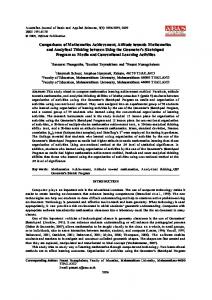
Fig. 5. Manhattan experimental data results with diamond showing 90% coverage at 2 GHz (120 dB path loss).
Fig. 7. Downtown Boston experimental data results with circle showing 90% coverage at 2 GHz (120 dB path loss).
Fig. 8. Downtown Boston predicted results with circle showing 90% coverage at 2 GHz (120 dB path loss). Fig. 6. Manhattan predicted results with diamond showing 90% coverage at 2 GHz (120 dB path loss).
Two diffractions, a maximum of ten reflections, and the powerof-complex-sum method of combining rays were specified in the computer program. The two-dimensional algorithm which includes ground-reflected rays was used in the prediction. Fig. 3 shows uptown Manhattan experimental data and predicted results at 900 MHz (corner distance is 398 m). Fig. 4 shows midtown Manhattan experimental data and predicted results at 2 GHz (corner distance is 130 m). The mean and standard deviation of the error between the experimental and prediction curves are shown on each of the graphs. Each graph shows excellent agreement. Considering other data not shown here (12 sets total), the results show that the mean of the error ranges from 5.3 to 0.6 dB, while the standard deviation ranges from 3.4 to 5.7 dB (the negative sign means that the predicted path loss is less than the experimental data path loss). The prediction accuracy is very good, even though the building database does not account for building surface irregularities, parking lots, traffic, terrain irregularities, details of wall material characteristics, etc. The prediction in most
cases over predicts the received signal power. The main reason is traffic blockage, which was experienced frequently while taking measurements. The second comparison deals with the area coverage plots at 2 GHz. Using vehicle location information, we generated area coverage plots on the digitized building and street databases using experimental data. We compared these plots with the ones generated using the prediction tool. The comparisons were made by assuming simple shapes of the microcell coverage area: in the curvilinear regions, it is a circle, and in rectilinear regions, it is a diamond.2 In both cases, the shape comprises an area that covers 90% of the averaged data points with path loss less than or equal to some chosen level. In the rest of this paper, we call this 90% coverage. Figs. 5–8 show coverage plots based on experimental data as well as coverage plots generated using the radio propagation tool, together with diamonds and circles showing 90% coverage. Figs. 5 and 6 are for midtown Manhattan, and Figs. 7 and 2 For NLOS rectilinear city streets like Manhattan, it has been shown that a diamond-shaped (square-shaped) contour is a very good approximation to a microcell coverage area [2], [10], [11]. For curvilinear city streets like Boston, it has been shown that a circle is a better approximation [10].
Authorized licensed use limited to: Alcatel-Lucent. Downloaded on March 22,2010 at 21:03:41 EDT from IEEE Xplore. Restrictions apply.
ERCEG et al.: COMPARISON OF WiSE AND EXPERIMENTAL DATA
Fig. 9. Results for diamond side
Fig. 10.
S
683
versus path loss at 2 GHz and 90% coverage.
Results for circle radius versus path loss at 2 GHz and 90% coverage.
8 are for Boston’s downtown area. All coverage plots were generated for a path loss of 120 dB (black color represents path loss less than or equal to 120 dB). For fair comparison, predictions are shown only for locations where experimental data were taken. In the propagation tool, we have specified a bin size of 2 m and a two-dimensional averaging window of 10 m. of a diamond versus path loss Fig. 9 shows the side in Manhattan for both coverage plots based on experimental data and coverage plots generated using the radio propagation tool. These results are in close agreement with the theoretical result for the side previously reported in [2] using a slightly different coverage criterion. of the circle versus path loss Fig. 10 shows the radius in Boston’s Financial District for both coverage plots based on experimental data and coverage plots generated using the radio propagation tool. The data-derived cell sizes for Boston were also reported in an earlier document [10].
The comparisons between predictions and experimental data show excellent agreement. The differences are not greater than 5 dB when the 90% criterion is used. That is, when a 5 dB increment (or less) is added to the mean path loss predicted by the radio propagation tool, the result corresponds to the coverage area determined experimentally.
V. CONCLUSION Ray theory, together with advanced computational methods, were used to characterize signal propagation characteristics in urban microcells. The prediction results have been compared with experimental data collected in New York and Boston. These comparisons show excellent agreement for different frequency bands and locations. The resultant ability to predict signal and interference levels using computer methods will allow system designers to determine cell layouts, reuse factors, and capacity with a minimum of city-specific measurements.
Authorized licensed use limited to: Alcatel-Lucent. Downloaded on March 22,2010 at 21:03:41 EDT from IEEE Xplore. Restrictions apply.
684
IEEE JOURNAL ON SELECTED AREAS IN COMMUNICATIONS, VOL. 15, NO. 4, MAY 1997
ACKNOWLEDGMENT The authors would like to thank O. Landron, L. J. Greenstein, and M. V. Clark for numerous comments and suggestions. Also, they would like to thank R. S. Roman, B. Locke, G. McArthur, and T. Renaldi for their help in the measurements.
Steven J. Fortune received the Ph.D. degree in computer science from Cornell University, Ithaca, NY, in 1979. He has been at Bell Laboratories, Murray Hill, NJ, since 1983. His current interest is computational geometry, particularly robustness issues.
REFERENCES [1] S. J. Fortune et al., “WISE design of indoor wireless systems: Practical computation and optimization,” IEEE Computational Sci. Eng. Mag., pp. 58–68, Spring 1995. [2] V. Erceg, A. J. Rustako, Jr., and R. S. Roman, “Diffraction around corners and its effects of the microcell coverage area in urban and suburban environments at 900 MHz, 2 GHz, and 6 GHz,” IEEE Trans. Veh. Technol., vol. 43, pp. 762–766, Aug. 1994. [3] T. Iwama et al., “Investigation of propagation characteristics above 1 GHz for microcellular land mobile radio,” in Proc. 40th IEEE Veh. Technol. Conf., May 1990, pp. 396–400. [4] T. S. Cheng, “Microcell RF propagation in city environment,” in Proc. 13th Int. Telecommun. Symp., Taipei, Feb. 1992, paper C2.1, pp. 51–60. [5] F. Niu and H. Bertoni, “Path loss and cell coverage of urban microcells in high-rise building environments,” in Proc. GLOBECOM’93 Conf., Dec. 1993, pp. 266–270. [6] J. F. Wagen and K. Rizk, “Simulation of radio wave propagation in urban microcellular environments,” in Proc. IEEE Int. Conf. Universal Personal Commun. ICUPC’93, Ottawa, Canada, Oct. 1993, pp. 595–599. [7] H. R. Anderson, “A ray-tracing propagation model for digital broadcast systems in urban areas,” IEEE Trans. Broadcast., vol. 39, pp. 309–317, Sept. 1993. [8] R. J. Luebbers, “Finite conductivity uniform GTD versus knife edge diffraction in prediction of propagation path loss,” IEEE Trans. Antennas. Propagat., vol. AP-32, pp. 70–76, Jan. 1984. [9] J. D. Parsons, The Mobile Radio Propagation Channel. New York: Wiley, 1992, ch. 8. [10] A. J. Rustako, Jr., V. Erceg, R. S. Roman, T. M. Willis, and J. Ling, “Measurements of microcellular propagation loss at 6 GHz and 2 GHz over non-line-of-sight paths in the city of Boston,” in Proc. GLOBECOM’95 Conf., Nov. 1995, pp. 758–763. [11] A. Goldsmith and L. J. Greenstein, “A measurement-based model for predicting coverage areas of urban microcells,” IEEE J. Selected Areas Commun., vol. 11, pp. 1013–1022, Sept. 1993. [12] W. Honcharenko, H. L. Bertoni, and J. Dailing, “Bilateral averaging over receiving and transmitting areas for accurate measurements of sector average signal strength inside buildings,” IEEE Trans. Antennas Propagat., vol. 43, pp. 508–512, May 1995. [13] S. Seidel and T. Rappaport, “A ray tracing technique to predict path loss and delay spread inside buildings,” in Proc. GLOBECOM’93 Conf., 1992, pp. 649–653. [14] P. Kreuzgruber, P. Unterberger, and R. Gahleitner, “A ray splitting model for indoor radio propagation associated with complex geometries,” in Proc. 1993 43rd IEEE Veh. Technol. Conf., 1993, pp. 227–230. [15] R. A. Valenzuela, “A ray tracing approach to predicting indoor wireless transmission,” in Proc. IEEE Veh. Technol. Conf., May 1993, pp. 214–218.
Vinko Erceg (M’92) was born in Sibenik, Croatia, in 1964. He received the B.Sc. degree in electrical engineering in 1988 and the Ph.D. degree in electrical engineering in 1992, both from the City University of New York. From 1990 to 1992, he was a Lecturer in the Department of Electrical Engineering, City College of New York. Concurrently, he was a Research Scientist with SCS Mobilecom, Port Washington, NY, working on spread-spectrum systems for mobile communications. In 1992, he joined AT&T Bell Laboratories and now he is with AT&T Laboratories–Research as a Member of Technical Staff in the Communication Infrastructure Research Department. He has been working on signal propagation as well as other projects related to the systems engineering and performance analysis of personal and mobile communication systems.
Jonathan Ling joined Bell Laboratories, Holmdel, NJ, in 1993. His interests are in radio propagation and computer tools.
A. J. Rustako, Jr. (S’55–A’58–M’67–SM’86– F’90) received the B.S. and M.S. degrees in electrical engineering from the New Jersey Institute of Technology, Newark, in 1965 and 1969, respectively. From 1965 to 1996, he was active primarily in radio propagation and system studies at AT&T Bell Laboratories. His contributions to mobile radio communications include the characterization of communication channels in urban and suburban environments, and the application of space diversity techniques to minimize the effects of multipath fading. He is currently a member of the Communications Infrastructure Research Laboratory, AT&T Laboratories–Research, Crawford Hill, Holmdel, NJ, where he is concerned with microcellular systems for personal and mobile radio communications.
Reinaldo A. Valenzuela received the B.Sc. degree in electrical engineering from the University of Chile, and the Ph.D. degree from the Imperial College of Science and Technology, University of London, England. His doctoral work introduced novel digital filter architectures for transmultiplexer design. At AT&T Bell Laboratories, he has studied indoor microwave propagation and modeling, packet reservation multiple-access techniques for indoor wireless systems, and optical WDM networks. During 1988 and 1989, he was Manager, Voice Research Department, at Motorola Codex, involved in the real-time implementation of low bit-rate voice coding for integrated voice and data packet systems. He is now with Bell Laboratories, Holmdel, NJ, where he is engaged in research on wireless systems for personal communication networks. His interests include wireless system design, propagation measurements, and site-specific propagation models for indoor and microcellular systems. He has led a multidisciplinary team effort to create a software tool for Wireless System Engineering (WiSE), now in widespread use in Bell Laboratories. He is currently Head of the Wireless Communications Research Department. Dr. Valenzuela recently received the AT&T Bell Laboratories Distinguished Member of Technical Staff Award.
Authorized licensed use limited to: Alcatel-Lucent. Downloaded on March 22,2010 at 21:03:41 EDT from IEEE Xplore. Restrictions apply.