water Technical Note
Comparisons of Different Instruments for Measuring Suspended Cohesive Sediment Concentrations Yuyang Shao 1, * 1 2
*
ID
and Jerome P.-Y. Maa 2
College of Harbour, Coastal and Offshore Engineering, Hohai University, Nanjing 210098, China Virginia Institute of Marine Science, College of William & Mary, Gloucester Point, VA 23062, USA;
[email protected] Correspondence:
[email protected]
Received: 17 October 2017; Accepted: 8 December 2017; Published: 12 December 2017
Abstract: Laboratory experiments were conducted to compare the performances of four different instruments for measuring suspended cohesive sediment concentrations (SSCs). Among these instruments, two were different models of optical backscatter sensor (i.e., OBS3+ and OBS5+), one was an acoustic Doppler velocimeter (MicroADV), and the last was a laser infrared optical sensor developed at Hohai University, China (HHU-LIOS). Sediments collected from the Yangtze River Estuary and a commercially available kaolinite were selected to check the responses of these four instruments. They were placed in an aqueous solution, and the SSCs were changed within a range from about 10 mg/L to 30 g/L to demonstrate the effective measuring ranges for each instrument. For the kaolinite suspension, the results showed that the HHU-LIOS has a much larger linear response range (0.1 to 13 g/L) when compared with other devices (the MicroADV: 0.1 to 1.35 g/L; the OBS3+: 0.1 to 5 g/L; and the OBS5+: 0.1 to 1 g/L). For the sediment sample from the Yangtze River Estuary, the results showed that the HHU-LIOS has a much wider usable range (from 0.1 to 25 g/L), compared with those for the others. It also showed that a combination of using a HHU-LIOS for the quadratic increasing range up to 25 g/L and the OBS5+ for the clear decreasing output are able to measure the SSCs of the estuarine mud up to 50 g/L. Keywords: laser infrared optical sensor; optical backscatter sensor; acoustic backscatter strength; suspended sediment concentration; cohesive sediment
1. Introduction Suspended sediment concentration (SSC) in river, estuary, and coastal waters is an important factor to better understand sediment transport processes, e.g., flocculation [1], settling [2], erosion [3], and deposition. To accurately and efficiently measure SSCs, however, is an important and difficult task. The early approach was limited to taking water samples back to a laboratory, then measuring the water volume and sediment mass. This is still the basic approach, and the measurement results may be claimed as a ground truth even today. This approach suggested that only time-averaged measurements at a specific point (or within a small volume) are possible. Later, more advanced measurement technologies have contributed to getting higher temporal resolution of SSCs, e.g., optical backscatter sensors [4]. The linear relationship between the OBS’s output voltage and the SSC can be used to measure the SSCs in real time. However, the measurements are limited to low SSC, with a maximum of around 1 g/L for cohesive sediment [5]. Techniques of using acoustic waves also contributed to save time and even possibly to measure SSC profiles [6]. Nevertheless, the possible linear measurement range is still limited to less than around 1 g/L for cohesive sediments. It has been frequently reported that the SSC is too high to be measured by using OBS when close to the bed in river, estuarial, or coastal waters [7]. When that happens, the OBS response is out of the
Water 2017, 9, 968; doi:10.3390/w9120968
www.mdpi.com/journal/water
Water 2017, 9, 968
2 of 8
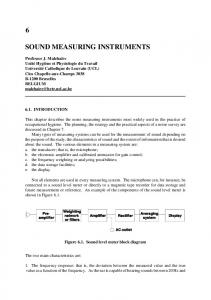
linear range, and thus, ambiguity on possible SSC readings becomes a problem. To address this high SSC problem, an improved version of OBS (i.e., OBS5+) has been created. Unfortunately, no sufficient test report clearly marks the advantages of OBS5+ and therefore makes the uses of this improved version of OBS unpopular. A fiber optic in-stream transmissometer was developed and tested to measure high SSC up to 10 g/L [8]; however, there is no market product based on this transmissonmeter. Since the beginning of planning the Deepwater Navigation Channel in the Yangtze River Estuary (also called Changjiang Estuary, the biggest estuary in China), many measurement approaches (i.e., water samples, using optical or acoustic instruments) have been applied [9–11]. The near bottom SSCs, measured by using the OBS and water-sample-taking approach, changed from less than 0.2 g/L to near 20 g/L in a tidal cycle [12]. It is important to measure these high SSCs near the bed because they represent a significant part of the total sediment mass transported through the Yangtze River Estuary. To address the high SSCs observed in the field, as well as in laboratories, the college of Harbour, Coastal and Offshore Engineering at Hohai University has developed an instrument that uses laser infrared light as the light source to measure SSC based on the Mie theory [13]. This intense light source is modulated by using 200 kHz square waves. The laser light is guided through a 6 mm (diameter) fiber optical cable toward the measurement point (which can be close and the light projected parallel to the bed). The backscatter light, caused by the suspended particles, is also guided back to the main module via another 6 mm optical fiber cable to measure SSC. This laser infrared optical sensor developed by Hohai University (Nanjing, China, HHU-LIOS: Figure 1 shows the schematic diagram) aims to have a much larger measuring range for cohesive sediment. At this time, details on the instrument cannot be released because of the patent applications. Nevertheless, it is worthwhile to inform the community of this product.
Figure 1. Schematic diagram of the HHU-LIOS.
Though many approaches have been used to measure SSCs in the Yangtze River Estuary, the responses of these different instruments on the sediment, from low to high concentrations, have not been documented. In order to better study the sediment transport at this estuary in the future, a series of lab experiments were conducted by using two different sediment samples to demonstrate the capability of the HHU-LIOS. This note serves as a preliminary introduction to the HHU-LIOS and as a comparison to other selected instruments (an OBS3+ and an OBS5+ from Campbell Scientific Company (Logan, UT, USA), and a 16 MHz MicroADV from Sontek Company (San Diego, CA, USA). It is understood that LISST can also be used to measure SSC and floc size distribution (Shao et al., 2011), but it is limited for low SSC ( C2 . C1 and C2 are roughly the same for kaolinite and YRE sediment, e.g., C1 = 1.5 g/L, C2 = 3.0 g/L, but Smax are different. For example, Smax = 106 dB for kaolinite suspension, but increases to 125 dB for YRE sediment suspension. ADV response depends on the sediment grain size, the sediment floc structure, and the acoustic wave frequency used. Thorne and Hanes [16] presented details of ADV response on suspended sediments, and thus, details are not repeated here.
Figure 3. MicroADV responses to the cchnages of SSC for YRE sediment and kaolinite.
OBS5+: The output of OBS5+ (in turbidity unit, T), also showed three responses (Figure 4). (1) Linear region: T increases linearly with SSC, up to a value, C3 , about 1 g/L. (2) When SSC > C3 , T increases exponentially with SSC, up to another critical value of SSC, i.e., C4 ~5 g/L. At C4 , the response reaches a maximum, and (3) after reaching the maximum response, T decreases exponentially with SSC.
Figure 4. OBSS+ responses to the changed of SSC for YRE sediment and kaolinite.
Within the linear range, the responses for kaolinite and YRE sediment are close. The difference becomes significant when SSC approaches C4 . In both the exponential increase and decrease ranges,
Water 2017, 9, 968
5 of 8
there are good correlations between OBS5+ responses and SSC. Kineke and Sternberg [17] measured the high SSC near 100 g/L by OBS and explained the possible reasons of having the 3rd region, and thus, those are not repeated here. The significant difference in the exponentially increasing region implies that in-situ calibration is important for a reliable correlation because of the possible different sediment compositions, particle size distribution (PSD), etc. Nikora et al. [18] showed that the performance of OBS can be used to obtain some rough information about PSD. It is interesting to get the particle (or floc) size information based on OBS output; however, it is not a simple subject and requires further studies. OBS3+: The output of OBS3+ (in voltage) can be divided into two regions (Figure 5). (1) Linear region: from small SSC and up to a specified SSC, C5 , the response increases with SSC in a linear manner. (2) Quadratic region: The response continues to increase, but in a manner of quadratic function, and eventually it reaches a maximum at C6 . For SSC higher than C6 , the response starts to decrease.
Figure 5. OBS3+ responses to the changes of SSC for YRE sediment and kaolinite.
The sensitivity of OBS3+ can be specified when ordering. Obviously, the tested OBS3+ had a rather low sensitivity. For this reason, a linear range from 0 to 5 g/L can be seen. If one selects a high sensitivity, a much low range would be the result. For example, Maa et al. [5] found that C6 is about 1 g/L in their test. HHU-LIOS: For the kaolinite suspension, there is a reasonably good linear response between the sensor output (in voltage) and the SSC for a quite large range of SSC, between 0 and 13 g/L. When the SSC is larger than 13 g/L, the sensor is fully saturated and stopped at 5 V (Figure 6).
Figure 6. HHU-LIOS responses to the changes of SSC for YRE sediment and kaolinite. (A dashed line is added to show the linear responses on kaolinite suspension).
Water 2017, 9, 968
6 of 8
For the YRE sediment suspension, the response is a clearly quadratic function and is always in the increasing domain, up to the tested maximum SSC (about 28 g/L). Although it is a nonlinear response, there is no ambiguity for the entire test range of SSC (from 0 to 28 g/L), and one single equation can be applied for the entire range. For responses such as that given in the previous paragraph, it is not critically important to have a linear response for a sensor if there are enough samples to provide an accurate calibration. Though more samples are always better for any field measurement, a linear response for any sensor would be preferred. For kaolinite suspension, the HHU-LIOS did show a linear characteristic for a large range of SSC. Tran et al. [19] used different suspended particle concentrations and known sizes to test the response of a kind of optical fiber sensor: their results showed that the backscatter light intensity increases by particle size. The linear relationship between the SSCs and HHU-LIOS outputs shows there are no change on sediment size for different SSC, probably because the floc size distribution (FSD) showed little change during the entire experiment period. The high turbulence from the stirring mechanism may prevent the flocculation and thus limit the change of FSD. For the YRE sediment suspension, the non-linear response was possibly caused by the change of sediment particle size distribution (PSD) or floc size distribution (FSD) associated with the change of SSC. High SSC may have larger prime particles and the sensitivity therefore decreases; conversely, high SSC may reduce the turbulence, or more organic matter contents in water, so that larger floc may be formed to decrease the sensitivity. Floc size maybe changed by lots of factors such as mineralogy, organic coatings, internal shear, and sediment concentration [20]. In order to know the floc size and to verify the floc size effects on the HHU-LIOS response, more studies using an in-situ device to measure FSD/PSD are necessary to address this concern. This is not a simple task, however, because measuring FSD/PSD at high SSCs is difficult, if not impossible. For further lab experiments, the camera system developed by Shen and Maa [1] would be used, but even that is not guarantee for a successful measurement of FSD/PSD at high SSCs, to check the PSD for YRE sediment suspension. This study clearly indicates that a HHU-LIOS has a clear linear or quadratic increasing relationship between the sensor outputs and SSCs for kaolinite and YRE sediment, respectively. The applicable range of SSCs is sufficiently large: 13 g/L for suspended kaolinite, and 29 g/L for suspended YRE sediment. This range of SSC may meet most of the requirements for measurement in the Yangtze River Estuary. When the SSC is small ( 30 g/L), a combination of a HHU-LIOS and an OBS5+ is suggested. With the combined instruments, SSC of more than 30 g/L can be clearly measured. While using any of the instruments, in-situ calibration with water samples is highly recommended, because sediment composition and particle size distribution may be changed temporally and spatially. Acknowledgments: The authors would like to acknowledge funding support from the National Natural Science Foundation of China (Grant No. 51409081), the State Key Program of National Natural Science of China (Grant Nos. 51339005 & 41230640), Open Foundation of State Key Laboratory of Hydrology-Water Resources and Hydraulic Engineering (No. 2014491511) and the financial support from the China Scholarship Council. Inventors of HHU-LIOS, Hui Cai and Zhibing Mao from Hohai University, are sincerely appreciated. We would also like to thank J. Hutchins and D. Betts for their help in editing. The preparation of these notes was completed at the Virginia Institute of Marine Science during the first author’s sabbatical leave. Author Contributions: For research articles with several authors, a short paragraph specifying their individual contributions must be provided. The following statements should be used “Y. Shao and J.P.-Y. Maa conceived and designed the experiments; Y. Shao performed the experiments; Y. Shao and J.P.-Y. Maa analyzed the data; Y. Shao contributed reagents/materials/analysis tools; Y. Shao and J.P.-Y. Maa wrote the paper.” Authorship must be limited to those who have contributed substantially to the work reported. Conflicts of Interest: The authors declare no conflict of interest.
References 1. 2. 3. 4. 5. 6. 7. 8.
9. 10. 11.
12.
13.
Shen, X.T.; Maa, J.P.-Y. A camera and image processing system for floc size distributions of suspended particles. Mar. Geol. 2016, 376, 132–146. [CrossRef] Shao, Y.Y.; Yan, Y.X.; Maa, J.P.-Y. In-situ measurements of settling velocity near Baimao Shoal in Changjiang Estuary. J. Hydraul. Eng. ASCE 2011, 137, 372–380. [CrossRef] Maa, J.P.-Y.; Wright, L.D.; Lee, C.-H.; Shannon, T.W. VIMS sea carousel: A field instrument for studying sediment transport. Mar. Geol. 1993, 115, 271–287. [CrossRef] Downing, J.P.; Sternberg, R.W.; Lister, C.R.B. New instrumentation for the investigation of sediment suspension process in the shallow marine environment. Mar. Geol. 1981, 42, 19–34. [CrossRef] Maa, J.P.-Y.; Xu, J.P.; Victor, M. Notes on the performance of an optical backscatter sensor for cohesive sediments. Mar. Geol. 1992, 104, 215–218. [CrossRef] Ha, H.K.; Hsu, W.Y.; Maa, P.Y.; Shao, Y.Y.; Holland, C.W. Using ADV backscatter strength for measuring suspended cohesive sediment concentration. Cont. Shelf Res. 2009, 29, 1310–1316. [CrossRef] Downing, J. Twenty-five years with OBS sensors: The good, the bad, and the ugly. Cont. Shelf Res. 2006, 26, 2299–2318. [CrossRef] Campbell, C.G.; Laycak, D.T.; Hoppes, W.; Tran, N.T.; Shi, F.G. High concentration suspended sediment measurements using a continuous fiber optic in-stream transmissometer. J. Hydrol. 2005, 311, 244–253. [CrossRef] Hamilton, L.J.; Shi, Z.; Zhang, S.Y. Acoustic backscatter measurement of estuarine suspended cohesive sediment concentration profiles. J. Coast. Res. 1998, 14, 1213–1224. Zhang, W.X.; Yang, S.L.; Zhu, J.; Gong, S.L.; Ding, P.X. Dry-season variability in suspended sediment concentrations in the south passage of the Changjiang Estuary. Int. J. Sediment Res. 2007, 22, 199–207. Ge, J.Z.; Ding, P.X.; Li, C.; Fan, Z.Y.; Shen, F.; Kong, Y.Z. Estimation of sediment transport with an in-situ acoustic retrieval algorithm in the high-turbidity Changjiang Estuary, China. China Ocean Eng. 2015, 29, 903–915. [CrossRef] Liu, G.F.; Zhu, J.R.; Wang, Y.Y.; Wu, H.; Wu, J.X. Tripod measured residual currents and sediment flux: Impacts on the silting of the Deepwater Navigation Channel in the Changjiang Estuary. Estuar. Coast. Shelf Sci. 2011, 93, 192–201. [CrossRef] Mie, G. Beitrage zur Optik truber Medien, speziell kolloidaler Metallosungen. Ann. Phys. 1908, 25, 377–445. [CrossRef]
Water 2017, 9, 968
14.
15. 16. 17. 18. 19. 20. 21.
8 of 8
Li, Z.Q.; Peterse, F.; Wu, Y.; Bao, H.Y.; Eglinton, T.I.; Zhang, J. Source of organic matter in Changjiang (Yangtze River) bed sediments: Preliminary insights from organic geochemical proxies. Org. Geochem. 2015, 85, 11–21. [CrossRef] Lan, X.H.; Zhang, Z.X.; Li, R.H.; Wang, Z.B.; Chen, X.H.; Tian, Z.X. Distribution of clay minerals in surface sediments of Yangtze River estuary. Mar. Sci. Bull. 2012, 14, 56–69. Thorne, P.D.; Hanes, D.M. A review of acoustic measurement of small-scale sediment processes. Cont. Shelf Res. 2002, 22, 603–632. [CrossRef] Kineke, G.C.; Sternbeg, R.W. Measurements of high concentration suspended sediments using the optical backscatterance sensor. Mar. Geol. 1992, 108, 253–258. [CrossRef] Nikora, V.; Aberle, J.; Green, M. Sediment Flocs: Settling Velocity, Flocculation Factor, and Optical Backscatter. J. Hydraul. Eng. ASCE 2004, 30, 1043–1047. [CrossRef] Tran, N.T.; Campbell, C.G.; Shi, F.G. Study of particle size effects on an optical fiber sensor response examined with Monte Carlo simulation. Appl. Opt. 2006, 45, 7557–7566. [CrossRef] [PubMed] Smith, S.J.; Friedrichs, C.T. Image processing methods for in situ estimation of cohesive sediment floc size, settling velocity, and density. Limnol. Oceanogr. Methods 2015, 13, 250–264. [CrossRef] Winterwerp, J.C.; Vroom, J.; Wang, Z.B.; Krebs, M.; Hendriks, E.C.M.; Maren, D.S.V.; Schrottke, K.; Borgsmuller, C.; Schol, A. SPM response to tide and river flow in the hyper-turbid Ems River. Ocean Dyn. 2017, 67, 559–583. [CrossRef] © 2017 by the authors. Licensee MDPI, Basel, Switzerland. This article is an open access article distributed under the terms and conditions of the Creative Commons Attribution (CC BY) license (http://creativecommons.org/licenses/by/4.0/).