the Optimization-Space Exploration (OSE) compiler organiza- tion, the first .... provided an experimental framework for constructing different optimizers with ...
Compiler Optimization-Space Exploration Spyridon Triantafyllis
Manish Vachharajani
Neil Vachharajani
David I. August
Departments of Computer Science and Electrical Engineering Princeton University Princeton, NJ 08544 {strianta, manishv, nvachhar, august}@cs.princeton.edu
Abstract To meet the demands of modern architectures, optimizing compilers must incorporate an ever larger number of increasingly complex transformation algorithms. Since code transformations may often degrade performance or interfere with subsequent transformations, compilers employ predictive heuristics to guide optimizations by predicting their effects a priori. Unfortunately, the unpredictability of optimization interaction and the irregularity of today’s wide-issue machines severely limit the accuracy of these heuristics. As a result, compiler writers may temper high variance optimizations with overly conservative heuristics or may exclude these optimizations entirely. While this process results in a compiler capable of generating good average code quality across the target benchmark set, it is at the cost of missed optimization opportunities in individual code segments. To replace predictive heuristics, researchers have proposed compilers which explore many optimization options, selecting the best one a posteriori. Unfortunately, these existing iterative compilation techniques are not practical for reasons of compile time and applicability. In this paper, we present the Optimization-Space Exploration (OSE) compiler organization, the first practical iterative compilation strategy applicable to optimizations in general-purpose compilers. Instead of replacing predictive heuristics, OSE uses the compiler writer’s knowledge encoded in the heuristics to select a small number of promising optimization alternatives for a given code segment. Compile time is limited by evaluating only these alternatives for hot code segments using a general compiletime performance estimator. An OSE-enhanced version of Intel’s highly-tuned, aggressively optimizing production compiler for IA-64 yields a significant performance improvement, more than 20% in some cases, on Itanium for SPEC codes.
1.
Introduction
As processors become more complex and incorporate additional computational resources, aggressively optimizing compilers become critical. This dependence on compiler support is especially pronounced in non-uniform-resource, explicitlyparallel platforms like the Intel Itanium, Philips TriMedia, and Equator MAP/CA [1, 2, 3]. In these and other complex ar-
chitectures, the compiler can no longer rely on simple metrics, such as instruction count, to guide optimization. Instead, the compiler must carefully balance execution resource utilization, register usage, and dependence height while attempting to minimize any unnecessary stalls due to dynamic effects such as cache misses and branch mispredictions. With aggressive, wide-issue machines, optimizations are almost never universally beneficial. For example, optimizations intended to enhance instruction-level parallelism (ILP) typically reduce dependence height in exchange for increased register pressure and instruction count. In order to determine how aggressively to apply these optimizations, the compiler cannot simply consider how they affect the current code. Instead, the compiler must anticipate changes in dependence height, register pressure, and resource utilization caused by future optimizations and weigh these factors against available resources on the target machine. Often the interaction between the optimization under consideration and subsequent optimizations in the context of the target microarchitecture is the primary consideration in deciding if and how aggressively to apply the optimization. In an effort to achieve maximum performance, most modern compilers employ predictive heuristics to decide where and to what extent each code transformation should be applied [4, 5]. A predictive heuristic tries to determine a priori whether or not applying a particular optimization will be beneficial. To obtain full benefit from an optimization, the ideal predictive heuristic would predict the exact effect of applying the optimization on emitted code quality. Unfortunately, the enormous complexity of this task limits the precision of predictive heuristics in practice. In an effort to make the best of the situation, compiler writers carefully tune predictive heuristics to achieve the highest average performance over a representative application set for the target microarchitecture. Unfortunately, for modern architectures the resulting optimization decisions remain suboptimal for many individual code segments, leaving significant potential performance gains unrealized. To address the limitations of predictive heuristics, researchers have proposed compiling a program multiple times with different optimization configurations. By emitting the
best code produced as evaluated after applying several optimization configurations the predictive heuristics are eliminated. Results from prior work illustrate the shortcomings of predictive heuristics and suggest that an iterative compilation approach holds much promise [6, ?, 7]. However, since prior techniques are designed for simple architectures, small loop kernels, or application specific processors, the results are not directly applicable to modern general-purpose architectures and applications. More importantly, these techniques are not practical in many environments since they typically incur prohibitively large compile times by exhaustively searching the optimization space or by evaluating each configuration via full execution. In this paper, we present the first general, practical version of iterative compilation for use in optimizing compilers for modern microarchitectures. To this end, we present a technique called Optimization-Space Exploration (OSE). Like other iterative compilation schemes, a compiler using OSE explores the space of optimization configurations through multiple compilations. However, OSE does the following to address the compile time and generality limitations of existing approaches: • Rather than eliminate the predictive heuristics, OSE uses the experience of the compiler writer as encoded in the heuristics to restrict the number of configurations explored. • OSE uses a realistic performance estimator during compilation that considers resource utilization, dynamic cache effects, instruction fetch, and branch prediction to estimate code performance, eliminating the need for evaluation by code execution. • Recognizing that each code segment in a program will respond differently to transformations, OSE selects a custom configuration for each code segment. • During exploration of the optimization space, OSE selects the next optimization configuration to consider by observing the characteristics of previous configurations. To evaluate the concept, we create an OSE-enabled version of the Intel C++ Compiler for the Intel Itanium Processor version 6.0, also known as Electron, Intel Corporation’s highlytuned, aggressively optimizing compiler for IA-64. We evaluate this compiler, called OSE-Electron, with respect to compile time and performance gained. As part of this work, we also demonstrate that predictive heuristics sacrifice performance on general-purpose EPIC architectures even in high quality compilers. The rest of this paper is organized as follows. Section 2 surveys prior work and illustrates the difficulty of designing good predictive heuristics by characterizing iterative compilation’s potential on an EPIC architecture. Section 3 presents the
Optimization-Space Exploration technique and illustrates how it can be used to limit compile time and address other shortcomings of existing approaches. Section 4 describes and evaluates the OSE-Electron compiler. The paper concludes with a summary of contributions in Section 5.
2.
The Predictive Heuristic Problem
Since optimizations are not universally beneficial, traditional compilers control optimizations by predictive heuristics. However, for highly parallel architectures, especially those that rely heavily on compiler support for performance, it is very difficult to devise a predictive heuristic that does well in all cases.
2.1.
A Recognized Problem
The failure of heuristics to allow optimizations to live up to their maximum potential is a well known problem. This problem is caused both by the complexity of the target microarchitecture and by the difficulty of characterizing the interactions that occur between different optimizations. Previous work has provided an experimental framework for constructing different optimizers with varying parameters and phase orders [?]. This same work also provides a theoretical characterization of how optimizations enable and disable future optimization opportunities along with a study of how frequently this enabling and disabling occurs. However, this characterization does not directly lead to a mechanism to discover when an optimization will be beneficial, especially for complex microarchitectures. Additional work has been done to address particularly nasty optimization interactions and to develop better heuristics to circumvent performance pitfalls. Heuristics that try to avoid register spilling due to overly aggressive software pipelining have been proposed [8, 9]. Despite their efforts, the authors describe a range of cases where their heuristics fail to make the best decision. Other work addresses the potentially harmful interference between scheduling and register allocation with novel heuristic techniques [10, 11, ?, ?]. Continuing efforts in this area indicate that the problem is far from solved. Hyperblock formation and corresponding heuristics have been proposed to determine when and how to predicate code [12]. However, even with these techniques, the resulting predicated code is not always better and techniques to reinsert branch control flow that mitigate, but do not totally eliminate, the negative effects of over-predication have been proposed [13]. These works are just a sample of the research done to address problems of predictive heuristics. The continuing effort to design better predictive heuristics and to improve compiler tuning techniques indicates that the problem of determining if, when, and how to apply optimizations is unsolved.
2.2.
The Promise of Iterative Compilation
Recognizing that predictive heuristics often sacrifice performance, others have proposed iterative compilation techniques.
1.4
Suite-Level Exhaustive Exploration, Runtime Eval 1.35
Benchmark-Level Exhaustive Exploration, Runtime Eval Function-Level Exhaustive Exploration, Runtime Eval
1.3 1.25
Performance Speedup
Instead of using predictive heuristics, existing compilers using iterative compilation optimize a program in many ways, measure the quality of all the generated code versions, and then choose the best one. Thus, iterative compilation allows for decisions to be made based on actual generated code rather than predictions of final code characteristics. Consequently, iterative compilation techniques generally produce code that performs better. Iterative compilation may be performed for a portion of the optimization sequence, such as in [?], or for all optimizations as in [7]. Cooper et al. [7] propose a compilation framework called adaptive compilation which explores different optimization phase orders at compile time. The results of each phase order are evaluated a posteriori using a rudimentary objective function that counts the static number of instructions. Adaptive compilation does not explore compilation parameters other than phase ordering. The basic shortcoming of this technique is that no method to prune the search space has yet been proposed. As a result, adaptive compilation’s proof-of-concept experiment, which involved a small kernel of code, took about a year to complete. Although impractical in terms of compile time, this experiment resulted in impressive performance benefits, thus establishing that this technique is promising. The OCEANS compiler project group [?] has also explored iterative compilation schemes. Kisuki et al. implement a compiler that traverses the optimization space for loop unrolling and tiling and runs all the produced code to choose the best version of a loop kernel [6]. Bodin et al. propose an iterative compilation technique that balances code size and performance [14]. These approaches have large compile times because they search a prohibitively large optimization space and they involve running each version of the program in order to gauge its performance. Since the OCEANS work targets small kernels in the embedded application arena, the authors do nothing to address the large compile times. Wolf et al. [?] present an algorithm for combining five different high level loop transformations, namely fusion, fission, unrolling, interchanging, and tiling. For each set of nested loops the algorithm considers various promising combinations of these transformations. The algorithm stops short of generating code for each combination of transformations; instead, it uses a performance estimator which accepts the sequence of loop transformations as an argument. The performance estimator can generate an estimate for the performance realized by applying the given sequence of loop transformations without actually transforming the code. While not strictly iterative compilation, this work realizes many of the benefits. When evaluated on scientific code, the proposed algorithm is efficient in terms of both compile time and final code quality. However, the algorithm cannot be generalized to incorporate optimizations other than the original five, since the performance estimation is based on thorough understanding of the interactions between these particular, well-behaved, and predictable opti-
1.2 1.15 1.1 1.05 1 0.95 0.9 ss
im
ks
88 m 4. 12
e pr
m
co
9. 12
eg
ijp
2. 13
x rte
vo
7.
14
ip
gz
4. 16
cf .m
1 18
r
e rs pa 7.
19
ap
g 4.
25
p2
i bz
6. 25
30
ol
tw
0.
n
f eo
ea
M
G
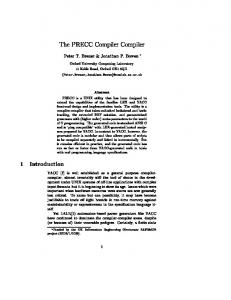
Figure 1: Performance of code on suite, benchmark, and function code segment sizes. Speedup relative to the best standard optimization heuristic configuration in Electron. mizations. While the results from these works are promising, none of these techniques are useful for general-purpose compilation. Existing iterative compilation works are limited to specific architectures, limited to specific optimizations, or suffer from unacceptably large compile times.
2.3.
Predictive Heuristics on EPIC Architectures
To characterize the performance opportunities sacrificed by the use of predictive heuristics, we explore the effect of a variety of optimization options applied at different code granularities. Electron, Intel’s high quality optimizing compiler for Itanium, provides a number of optimization control parameters accessible either to the user on the command line or to the compiler writer internally. From these, a reduced set of parameters, shown in Table 1, was selected based upon how difficult it is to make the corresponding optimizations deliver consistent speedup on Itanium codes. Various settings of these parameters were tried to find the configuration delivering the best average code performance at the suite-, benchmark-, and function-level for a set of SPEC benchmarks. The details of the benchmark selection and experimental testbed are described in Section 4. Figure 1 shows the results of this experiment. All speedups are shown versus a baseline compilation using Electron with the -O2 option and with profile guided optimizations turned on. (The -O2 option was selected as a baseline since it generates the best performing code on average, as reported by Intel.) The first column in the graph shows the performance of the benchmark using the configuration that gave the best average performance across all benchmarks. The second column shows the performance of each benchmark using the configuration that gave the best performance for each benchmark. The third column shows the performance of each benchmark built
3.
Optimization-Space Exploration
In this section, we present the Optimization-Space Exploration (OSE) technique. A compiler that implements OSE optimizes each code segment with a variety of optimization configurations and examines the code after optimization to choose the best version produced. Figure 2 contrasts OSE with traditional compilation methods employing only predictive heuristics. The traditional compilation approach is shown in Figure 2a. A sequence of optimizing transformations, controlled by a set of fixed heuristics, is applied to each code segment. Only one version of the code exists at any given time and this version is passed from transformation to transformation. In contrast, an OSE compiler (Figure 2b) simultaneously applies multiple transformation sequences on each code segment, thus maintaining multiple versions of the code. Each version is optimized using a different optimization configuration. The compiler emits the fittest version as determined by the performance evaluator. Ideally, the compiler would perform an exhaustive optimization-space exploration by dividing the program up into all possible sets of code segments, compiling each code segment with every possible optimization configuration, testing each program assembled from all combinations of optimized segments on the target architecture, and selecting the best program for emission. However, such an approach is
Hn = Heuristic n Tn = Transformation n
Front End
Front End H1 T1 H2 T2 Hn Tn
OSE Driver
Fixed Config
by compiling each function with the configuration that gives the best performance for that function. Figure 1 illustrates that the default compilation path in Electron did not yield the best average performance for these benchmarks. However, this is probably due to the fact that Intel has tuned Electron for a much larger set of benchmarks than we considered. Notice that function-level exploration generated code that consistently outperformed the baseline configuration, suite-level exploration, and benchmark-level exploration. In two cases, the code produced by function-level exploration performed 28% better than the baseline. Thus, this experiment demonstrates that predictive heuristics do sacrifice performance, even in a high-quality aggressively-tuned commercial compiler. It is worth noting that predictive heuristics are not ideal in other compilers as well. For example, in one small experiment, we varied the loop unrolling factor used by the IMPACT compiler [15] incrementally from 2 to 64. The benchmark 132.ijpeg performs best for a loop unrolling factor of 2, which is the baseline configuration. However, a performance increase of 8.81% can be achieved by allowing each function in 132.ijpeg to be compiled with a different loop unrolling factor. In a bigger experiment involving 72 different configurations, the individually best configurations for 130.li and 008.espresso achieved 5.31% and 11.74% improvement over the globally best configuration respectively.
H1 T1
H1 T1
H1 T1
H2 T2
H2 T2
H2 T2
Hn Tn
Hn Tn
Hn Tn
Performance Evaluator
(a)
(b)
Figure 2: Compilers with (a) a single fixed configuration, (b) Optimization-Space Exploration over many configurations. clearly intractable. In order for OSE to be practical, the compiler must limit the number of optimization configurations explored for each code segment, rapidly select the best of the different compiled versions of each code segment, and only apply OSE to the important code segments of a program. The remainder of this section is arranged as follows. First, Section 3.1 describes how to limit the number of optimization configurations explored at compile-time. Second, Section 3.2 describes how to rapidly select the best version of each code segment. Third, Section 3.3 describes selection of code segments for which OSE will be applied.
3.1.
Limiting the Search Space
The full optimization space for a compiler is derived from a set of optimization parameters which control the application of optimizations. Some optimization parameters control the application of a code transformation directly by enabling or disabling it. Other parameters control the aggressiveness of predictive heuristics, which in turn decide where to apply a code transformation. As an example, an optimization parameter can determine whether if-conversion should be applied, whereas another parameter can specify the maximum number of times a loop can be unrolled, or whether loops with early exits should be candidates for software pipelining. For each parameter there is a set of legal values. A set of parameter-value pairs forms an optimization configuration. The set of optimization configurations forms the optimization space. In general, if a configuration does not specify a value for a parameter, a default value is used. Unfortunately, the full set of configurations for a compiler is too large to explore na¨ıvely at compile-time. To limit the number of configurations explored for any given code segment, we first remove any configuration that is not likely to contribute to performance improvements. Configurations were typically excluded because the optimizations they controlled were well tuned, because they performed consistently worse than the default configuration, or because they were too similar to other
Parameter Optimization level (-On)
Values 2
3
High-level optimization (HLO) level Microarchitecture type - Merced vs. McKinley Coalesce adjacent loads and stores HLO phase order
2,3 0 or 1 TRUE or FALSE TRUE
FALSE Loop unroll limit Update dependencies after unrolling
0,2,4,8 TRUE or FALSE
Perform software pipelining Heuristic to disable software pipelining
TRUE or FALSE TRUE or FALSE
Allow control speculation during software pipelining Software pipeline outer loops
TRUE or FALSE
Enable if-conversion heuristic for software pipelining
TRUE or FALSE
Software pipeline loops with early exits
TRUE or FALSE
Enable if-conversion Enable non-standard predication
TRUE or FALSE TRUE or FALSE
Enable pre-scheduling
TRUE or FALSE
Scheduler ready criterion
TRUE or FALSE
10%,15%,30%,50%
Meaning This is the default optimization level. The standard optimizations are register allocation, scheduling, register variable detection, common subexpression elimination, dead code elimination, variable renaming, copy propagation, strength reduction-induction variable optimizations, tail recursion elimination, and software pipelining [16]. Perform all -O2 optimizations plus more aggressive optimizations that may even degrade performance. These optimizations include aggressive loop transformations, data prefetching, and scalar replacement [16]. This optimization level also affects the loop classification heuristics used to apply other optimizations so that they do not interfere with loop optimizations designed to improve cache performance. Like O2 and O3, but only for the high level optimizer. A general parameter that affects the aggressiveness of many optimizations. Enable coalescing multiple adjacent loads or stores into a single instruction. Perform High Level Optimization before normalizing loops. The important effect here is that this setting also turns off the block unroll and jam optimization. Perform High Level Optimization after normalizing loops. This is the default value for Electron. Maximum number of times to unroll a loop. By not updating data dependences after unrolling, the aggressiveness of optimizations performed on unrolled loops is limited. Enable/disable software pipelining Normally Electron will forgo software pipelining if the maximum predicted initiation interval is smaller than the minimum possible initiation interval. If false, this parameter will force Electron to perform software pipelining. Enable/disable control speculation during software pipelining. Software pipeline an outer loop of a loop nest after software pipelining the inner loop. This flag determines if a heuristic is used to determine whether to if-convert a hammock in a loop that is being software pipelined, or to just if-convert every hammock in the loop regardless of branch bias and resource utilization. Controls whether software pipelining will operate on loops with early exits. Controls whether predication techniques should be applied. Enables/Disables predication for if blocks without else clauses. Enables/Disables a scheduling phase performed before register allocation. Percentage of execution ready execution paths a ready instruction must be on to be considered for scheduling.
Table 1: Parameters and values defining the search space used in evaluation.
configurations. To further limit the number of configurations tried on any given code segment, OSE exploits a key insight into the nature of how the success of different optimizations is correlated. The performance of any given code segment is largely determined by a few critical optimizations, but these optimizations may differ between code segments. These critical optimizations not only have a large performance impact on the code segment, but their success is highly correlated with the success rate of other optimizations. For example, if loop unrolling is a critical optimization for a certain code segment, and small amounts of unrolling are best, then software pipelining may also be a good optimization to try on this code segment. This key insight allows the optimization space to be organized at compiler construction time in a way that allows a compiletime search of the optimization space to be limited to a few correlated optimization configurations. This can yield significant performance improvements with very little compile time overhead. Intuitively, the compile-time search approach is that the compiler, at compile time, “learns” about the code by trying some optimization configurations. Then the compiler tries other optimization configurations it suspects will be successful based on the success of the configurations it has already tried. After applying these optimizations, more information is learned and thus the compiler can choose still more configurations to try. 3.1.1.
Compiler Construction-time Pruning
The first step in constructing an OSE enabled compiler is to limit at compiler-construction time the total number of configurations that will be considered at compile time. The goal of the pruning process described below is to construct a set Ω with at most N configurations, which will then be used during compile-time exploration. Optimization configurations for Ω are chosen by determining their impact on the performance of a representative set of code segments C. We begin by constructing the set Ω1 which consists of the default configuration and all configurations that assign a nondefault value to a single parameter. Each code segment in the representative set C is then compiled according to each configuration in Ω1 . The performance of each version of each code segment is measured by running it on real hardware, and the mean speedup that would result from exploring all parameters in Ω1 is determined. Next, the “value” of each configuration in Ω1 is measured. One can determine how “valuable” each configuration is by removing it from the exploration and computing the reduction in the mean speedup. The least “valuable” configuration is then permanently dropped from Ω1 , and the same process is repeated until at most N configurations are left. In the next step, the set Ω2 is constructed by forming all
the meaningful combinations (set unions) of the configurations remaining in Ω1 , that is all combinations except the ones assigning more than one value to the same parameter. The set Ω2 is then refined to at most N configurations by repeating the process described in the above paragraph. Then the set Ω3 is formed by combining the configurations remaining in Ω2 , and so on. The process stops when no new configurations can be generated, or when the increases in the mean speedup become negligible. The final set, Ωm , is then regarded as the “optimal” set of configurations Ω. 3.1.2.
Characterizing Configuration Correlations
Identifying the correlations between optimization configurations in Ω is the next phase of the compiler construction-time tuning process. These correlations will be used at compile time to prune the search space on a code segment by code segment basis as outlined earlier. We represent the set of configurations for the compile-time exploration engine as a tree, called the optimization configuration tree. All the siblings in a given level of the tree correspond to critical configurations which identify which other optimizations may be critical for a code segment. The children of any node in the tree correspond to configurations which may be critical if the current node corresponds to a critical configuration. The algorithm to build this tree, shown in Figure 3, is fairly straightforward. First, from the N configurations in Ω, choose the m optimization configurations that yield the most speedup across the set of all representative code segments, C, call these configurations oi , i = 1..m.1 Make these the children of the root node of the tree. Let pj,i be the performance for code segment cj generated by optimization configuration oi . The algorithm partitions the set of representative code segments, C, into m disjoint sets, Ci , such that cj ∈ Ci if arg max(pj,k ) = k=1..m
i. To generate the rest of the tree, the algorithm repeats the above process for each oi to determine its successors using Ci instead of C. Of course, this process could continue for quite some time, so the algorithm needs to limit the size of the tree generated. We observe that the likelihood that a given configuration will be better than any of its predecessors decreases as the algorithm proceeds deeper into the tree. Thus, the algorithm can simply limit the depth of the tree, and terminate construction of a subtree when it reaches this cut-off depth. 3.1.3.
Compile-time Search
An OSE compiler searches the optimization tree using the algorithm shown in Figure 4. First, it compiles each code segment with a small set of optimization configurations, the chil1 Recall that we have compiled and measured the run-time of the training code segments with all possible configurations that will be used during compilation.
Construct O = set of m most important configurations in Ω for all code segments in C. 2 Choose all oi ∈ O as the successor of the root node. 3 For each configuration oi ∈ O: 4 Construct Ci = {cj : arg max(pj,k ) = i}. 1
k=1..m
Recursively repeat steps 3 and 4 to find oi ’s successors, limiting the code segments used to Ci , and the configurations used to Ω \ O.
5
Figure 3: Pseudo-code for building the OSE search tree 1 2 3 4 5 6 7 8 9
For each code segment: Let o be the root of the optimization tree. Do: For each child oi of o: Compile the code segment with configuration oi . Estimate the performance of the generated code. Let o be the oi that corresponds to the best code. While o is not a leaf. Emit the code corresponding to the configuration that resulted in the best estimated performance. Figure 4: Pseudo-code for the OSE technique
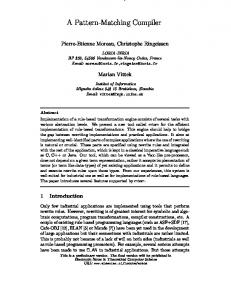
dren of the root of the tree. It then chooses the optimization configuration from this set that maximizes the estimated performance for the code segment under consideration (performance estimation is discussed in Section 3.2); this is a critical configuration for the current code segment. Next, the compiler will examine the children of the node corresponding to this critical configuration to find other critical configurations. This process is repeated until a path from the root to a leaf of the optimization tree is found. The configuration along this path that yields the best estimated performance is chosen as the final configuration used by the compiler. The final configuration is used to generate the final code for the code segment under consideration. The net effect of the algorithm, presented in Figure 4, is to perform a breadth first search of a pruned tree of optimization configurations, as shown in Figure 5.
3.2.
Efficient Code Quality Evaluation
At some point in the process, OSE must evaluate two pieces of machine code and determine which one is better by some metric. In prior discussion, this evaluation was considered possible, but not discussed in detail. Ideally, the OSE compiler would compile the whole program in all possible ways and then run each version of the final program. The runs would be timed, and the fastest program would be selected. This would allow the OSE compiler to consider all code segments and even inter-code-segment interactions such as certain cache and branch effects. To keep compile time reasonable, however, the OSE compiler will need to find the best code on a code segment by code segment basis, neglecting most inter-codesegment interactions.
The OSE compiler performs this selection using static performance estimation. In this approach, the compiler estimates code segment performance using a machine model and profile data. Previous work shows that good results are obtainable with this type of performance estimation [17]. Of course, each target architecture will require a performance estimator suitable for the execution model of the machine, be it EPIC, VLIW, or superscalar. Since the particulars of the estimator are dependent on the implementation of OSE, we defer discussion of the estimator to Section 4.
3.3.
Limiting the Application of OSE
As a final technique to limit compilation time, an OSE compiler limits application of multiple optimization configurations to hot code segments. It is a common observation that most of the execution time is spent in a small fraction of the code. The OSE compiler can limit its search efforts to that important fraction of the code saving valuable compilation time. These hot code segments can be identified by profiling using instrumentation or, preferably, hardware performance counters during a run of the program.
4.
Evaluating OSE
In order to evaluate the effectiveness of the OSE approach, we retrofitted Electron, the Intel C++ Compiler for the Intel Itanium processor, to implement OSE. The Itanium processor makes a good target architecture since explicitly parallel machines depend heavily on good compiler optimization [15]. Electron is among the best compilers for the Itanium platform, thus providing a credible experimental baseline.
4.1.
OSE-Electron Implementation
This section describes implementation details of OSE in Intel’s Electron compiler for Itanium. This implementation was used to produce the experimental results in Section 4.2. 4.1.1.
Exploration Driver
The base Electron compiler compiles code in the following steps: 1 Profile the code. 2 For each function: 3 Compile to the high-level IR. 4 Optimize using high-level optimizations (HLO). 5 For each function: 6 Perform inlining followed by a second HLO pass. 7 Perform code generation (CG), including software pipelining and scheduling. In retrofitting Electron to build OSE-Electron, we inserted an OSE driver that controls the exploration process and decides which functions will have OSE applied after the first pass of optimization over all the routines. The OSE driver searches an
Optimization Configuration
Compile−time sequence in which optimizations were tried
Loop unroll limit = 4 Optimization level = 2 Coalesce adjacent loads and stores
1
Critical Configurations
7
4
5
8
9
6
2 3 �������������������������������� �� � � � � � � � � � � � � � � � � � � � � � � � � � � � � � � � � � � � � � � � � � � �� �� �� �� �� �� �� �� �� �� ��� �������������������������������� �� � � � � � � � � � � � � � � � � � � � � � � � � � � � � � � � � � � � � � � � � � � �� �� �� �� �� �� �� �� �� �� �������������������������������� �� � � � � � � � � � � � � � � � � � � � � � � � � � � � � � � � � � � � � � � � � � � � � � � � � � � � � � � � � � � � � � � �������������������������������� �� � � � � � � � � � � � � � � � � � � � � � � � � � � � � � � � � � � � � � � � � � � � � � � � � � � � � � � � � � � � � � � �� �������������������������������� �� �� �� �� �� �� �� �� �� �� �� �� �� �� �� �� �� �� �� �� �� �� �� �� �� �� �� �� �� �� �� �� �������������������������������� �� � � � � � � � � � � � � � � � � � � � � � � � � � � � � � � � � � � � � � � � � � � � � � � � � � � � � � � � � � � � � � � �� �������������������������������� �� � � � � � � � � � � � � � � � � � � � � � � � � � � � � � � � � � � � � � � � � � � � � � � � � � � � � � � � � � � � � � � �������������������������������� �� � � � � � � � � � � � � � � � � � � � � � � � � � � � � � � � � � � � � � � � � � � � � � � � � � � � � � � � � � � � � � � ��� � ��������������������������������� � � � � � � � � � � � � � � � � � � � � � � � � � � � � � � � � � � � � � � � � � � � � � � � � � � � � � � � � � � � � � � �������������������������������� �� � � � � � � � � � � � � � � � � � � � � � � � � � � � � � � � � � � � � � � � � � � � � � � � � � � � � � � � � � � � � � � �������������������������������� �� � � � � � � � � � � � � � � � � � � � � � � � � � � � � � � � � � � � � � � � � � � � � � � � � � � � � � � � � � � � � � � �� �������������������������������� �� �� �� �� �� �� �� �� �� �� �� �� �� �� �� �� �� �� �� �� �� �� �� �� �� �� �� �� �� �� �� �� �������������������������������� �� � � � � � � � � � � � � � � � � � � � � � � � � � � � � � � � � � � � � � � � � � � � � � � � � � � � � � � � � � � � � � � �� �������������������������������� �� � � � � � � � � � � � � � � � � � � � � � � � � � � � � � � � � � � � � � � � � � � � � � � � � � � � � � � � � � � � � � � � ��������������������������������� � � � � � � � � � � � � � � � � � � � � � � � � � � � � � � � � � � � � � � � � � � � � � � � � � � � � � � � � � � � � � � ��� �������������������������������� �� � � � � � � � � � � � � � � � � � � � � � � � � � � � � � � � � � � � � � � � � � � � � � � � � � � � � � � � � � � � � � � �������������������������������� �� � � � � � � � � � � � � � � � � � � � � � � � � � � � � � � � � � � � � � � � � � � � � � � � � � � � � � � � � � � � � � � �������������������������������� �� � � � � � � � � � � � � � � � � � � � � � � � � � � � � � � � � � � � � � � � � � � � � � � � � � � � � � � � � � � � � � � �� �������������������������������� �� �� �� �� �� �� �� �� �� �� �� �� �� �� �� �� �� �� �� �� �� �� �� �� �� �� �� �� �� �� �� �� �������������������������������� �� � � � � � � � � � � � � � � � � � � � � � � � � � � � � � � � � � � � � � � � � � � � � � � � � � � � � � � � � � � � � � � ��� � ��������������������������������� � � � � � � � � � � � � � � � � � � � � � � � � � � � � � � � � � � � � � � � � � � � � � � � � � � � � � � � � � � � � � � �������������������������������� �� �� �� �� �� �� �� �� �� �� �� �� �� �� �� �� �� �� �� �� �� �� �� �� �� �� �� �� �� �� �� �� �������������������������������� �� � � � � � � � � � � � � � � � � � � � � � � � � � � � � � � � � � � � � � � � � � � � � � � � � � � � � � � � � � � � � � � �������������������������������� ��� �� �������������������������������� � ���� ���� ���� ���� ���� ���� ���� ���� ���� ���� ���� ���� ���� ���� ���� ���� ���� ���� ���� ���� ���� ���� ���� ���� ���� ���� ���� ���� ���� ���� �����
Best Overal Configuration
Configurations Pruned at Compile Time
Figure 5: Automatically generated search tree annotated based on a hypothetical run of OSE
Since OSE-Electron is a retrofit of an existing compiler, certain sub-optimal decisions had to be made during its construction. For example, due to certain technical difficulties in the way inlining is implemented, OSE is performed starting right after the inlining phase, which means that the first round of high-level optimization, as well as the inlining routine itself, does not participate in OSE. Also, Electron collects only basic block and edge profiling data. This limits the precision of our performance estimator, as described in Section 4.1.3.
phase after the second step, since the third step produced insignificant benefits. These 12 configurations were organized into a three-way, two-level configuration tree, which is presented in Figure 6. At compile time, OSE-Electron first applies the configurations appearing on the first level of the tree to each function. The resulting three different versions of the functions are evaluated using the performance estimator described in Section 4.1.3. After the configuration that results in the best predicted performance is chosen, its successors in the second level of the tree are tried. The resulting versions of the code are again evaluated, and the best version seen is emitted. During the experiments described in Section 4.2 we observed that on average 86% of the performance gains come from exploring the three configurations on the first level of the tree in Figure 6. Continuing the exploration to the three children of the chosen first-level configuration accounts for the remaining 14% of the performance benefits on average. In some cases, the second level of the configuration tree can account for as much as 69% of the performance benefit. According to our experiments, adding a third level to the configuration tree would result in negligible performance gains.
4.1.2.
4.1.3.
optimization space following the approach described in Section 3. The algorithm used in the retrofitted OSE-Electron is as follows: 1 Profile the code. 2 For each function: 3 Compile to the high-level IR. 4 Optimize using HLO. 5 For each function: 6 If the function is hot: 7 Perform OSE on second HLO pass and CG. 8 Emit the function using the best configuration. 9 If the function is not hot, use standard configuration.
Defining the Exploration Space
OSE-Electron explores the optimization space defined by the compilation parameters presented in Table 1. The values of these parameters can be combined to form a total of 219 optimization configurations. We used a tuning phase at compilerconstruction time to narrow down the space, as described in Section 3.1.1. Out of the 3189 functions in the benchmark suite used in Section 2.3, the compiler-construction pruning phase used 28 functions as its training code segments. We ran two steps of the compiler-construction pruning method, building Ω1 and Ω2 = Ω for a total of 12 configurations. We stopped the compiler-construction time pruning
Compile-time Performance Estimation
Two factors drove the design of the static performance estimation routine in OSE-Electron. The first is compile time. Since the estimation routine must be run on every version of every function compiled, keeping it simple is critical for achieving reasonable compile times. For this reason, the estimator chosen performs a single pass through the code, foregoing more sophisticated analysis techniques. The second limitation results from limited information. The final code produced by the Electron compiler is annotated with basic block and edge execution counts which are calculated in an initial profiling run and then propagated through all optimization phases. Unfortu-
BB=T SWP=F
BB=T uArch=1
ECI=T SWPE=T
uArch=1 GPP=30%
Pred=F SWP=F
uArch=1
PS=F Pred=F
ECI=T PS=F
SWPO=T Pred=F
PS=F Pred=F
uArch: Microarchitecture type − Merced(0) vs. McKinley(1) BB: HLO phase order SWP: Perform software pipelining SWPE: Software pipeline loops with early exits SWPO: Software pipeline outer loops Pred: Enable if−conversion ECI: Enable non−standard predication PS: Enable pre−scheduling GPP: Scheduler ready criterion
uArch=1 SWP=F
BB=T SWPE=T
T: True F: False
Figure 6: Tree of potential critical configurations nately, without path profiling information many code transformations make the block and edge profiles inaccurate. Further, more sophisticated profile information, such as branch misprediction or cache miss ratios, could be useful to the estimator, but is unavailable. Each code segment is evaluated at compile time by taking into account a number of performance parameters. Each parameter contributes an evaluation term. The final performance estimate is a weighted sum of all such terms. These terms correspond to the performance aspects described here.
Ideal cycle count The ideal cycle count T is a code segment’s execution time assuming perfect branch prediction and cache behavior. It is computed by multiplying each basic block’s schedule height with its profile weight and summing over all basic blocks.
into Itanium’s L1 cache. This is achieved by the formula: % $ % $ X size(S) size(L) × wt(L) + × wt(S) I= size(L1 Icache) size(L1 Icache) L∈ loops of S
where S is the code segment under consideration and wt(X) is the profile weight of X. Floor is used to model the bimodal behavior of loops that just fit in the cache against those that are just a bit too large. Branch misprediction The Electron compiler does not provide us with detailed branch behavior profile information. Therefore, OSE-Electron has to approximate branch misprediction ratios by using edge profiles. For each code segment S, the estimator assesses a branch misprediction penalty term according to the formula: X B= min(ptaken , 1 − ptaken ) × wt(b) b ∈ branches of S
Data cache performance To account for varying latencies among load instructions, a function of data cache performance, each load instruction is assumed to have an average latency of λ. Whenever the value fetched by a load instruction is accessed within the same basic block, the block’s schedule height (used in the computation of T above) is computed using a distance of at least λ cycles between a load and its use. Another term is introduced to favor code segments executing fewer dynamic load instructions. The number of load instructions executed according to the profile, L, provides another bias toward better data cache performance.
where ptaken is the probability that the branch b is taken, as determined by the edge profiles, and wt(b) is the profile weight of b. Putting it all together Given a source-code function F , let Sc be the version of F ’s code generated by a compiler configuration C, and let S0 be the version of F ’s code generated by Electron’s default configuration. Then, the evaluator estimate for the code segment Sc is computed according to the formula: Ec = α ×
Instruction cache performance The estimation routine is biased against code segments and loop bodies that do not fit
Tc Ic Lc Bc +β× +γ× +δ× T0 I0 L0 B0
where terms subscripted with C refer to the code segment Sc , and terms subscripted with 0 refer to the code segment S0 .
5.5
1.4
OSE-Electron, Exhaustive Compilation, 1-processor OSE-Electron, 1-processor OSE-Electron, Exhaustive Compilation, 2-processor OSE-Electron, 2-processor
Function-Level Exhaustive Exploration, Runtime Eval 5
OSE-Electron, Exhaustive Search
1.35
4.5
1.25
4
Compile Time Dilation
Performance Speedup
OSE-Electron 1.3
1.2 1.15 1.1
3.5 3 2.5
1.05
2
1
1.5 1
0.95 s
im
ks 88
m 4. 12
1
. 29
m co
es pr
pe
13
ij 2.
g
x te
1
47
or .v
ip gz
. 64
1
cf
m
. 81
1
1
. 97
r
se
r pa
p
ga
2
. 54
f ol
2
ip
25
bz 6.
30
tw 0.
eo
G
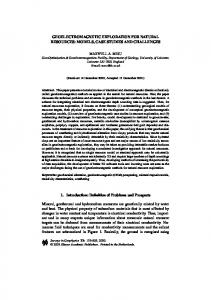
Figure 7: Performance of OSE-Electron Itanium generated code, compared with the results of the experiment in Figure 1. Speedup relative to the best standard optimization heuristic configuration in Electron. A brute-force grid searching method was used to assign values in the interval [0, 1) to the weights α, β, γ, and δ. The same search determined the load latency parameter λ. More specifically, the grid search used the same sample that was used to define the optimization space. The grid search determined the values of α, β, γ, δ, and λ that guide the performance estimator to the best possible choices on the sample. The resulting values are: α = 0.3, β = 0.3, γ = 0.1, δ = 10−5 , λ = 10.1. The relatively large value of λ is justified by the fact that the chosen benchmark suite is dominated by programs like 132.ijpeg, 256.bzip2, and 124.m88ksim which scan large data structures in memory, and hence are likely to cause frequent cache misses. 4.1.4.
Hot Code Selection
To limit compile time, OSE-Electron only performs OSE for hot functions. Functions in the smallest set of functions comprising at least 90% of the execution time of a benchmark are considered hot. The execution time of a function is determined by monitoring performance counters during a run of the program. We experimentally verified that this fraction yields a good tradeoff between compile-time and performance by trying a number of other thresholds.
4.2.
:
n ea
m si
M
Experimental Results
The compile-time and performance of the code generated by the OSE-Electron compiler described in Section 4.1 are presented here. Figures 7 and 8 show these results. For this experiment and the experiment described in Section 2.3, we chose to present a mix of SPECint95 and SPECint2000 benchmarks in our results instead of simply running the entire SPECint2000 suite because the compiler failed to finish compiling the missing benchmarks for some configu-
k 88
4 12
12
s:
es
pr
m co 9.
.m
g: pe
.ij
2 13
1
x:
rte
vo
. 47
:
: ip
gz
4.
16
cf m
1.
18
1
er
rs
pa
. 97
:
p:
ga
4. 25
:
2 ip
bz
6. 25
:
f:
ol
.tw
0 30
e ag
er
Av
Figure 8: Compile time dilation for OSE-Electron over standard Electron. rations that involved internal variations to the optimizer. The only exception to this is 252.eon which presented some technical difficulties with our evaluation software since it was a C++ program. In both the experiments, the SPECint95 and SPECint2000 binaries were compiled and run on an unloaded HP i2000 Itanium workstation with 1GB of RAM running Red Hat Linux 7.1 with kernel version 2.4.17. Cycle counts were obtained with Itanium’s hardware performance counters using the pfmon tool [18]. Reported numbers are the computed average of 4 runs. For all benchmarks, the variation observed between runs was less than 1%. Profile data for all compilations was generated using the SPEC training inputs. As we can see, the performance gains achieved with OSEElectron are on average less than the full potential benefit identified in the experiment in Section 2. This is to be expected, since OSE-Electron uses performance estimation instead of performance measurement, and since it searches an optimization space which has been pruned by both compilerconstruction-time and compile-time configuration selection. However, OSE-Electron still achieves significant benefits. In fact, most of the performance loss is due to the estimator, not the pruning of the tree, as can be seen by the small difference between the exhaustive and tree based numbers in Figure 7. Interestingly, in some cases the estimator makes better choices than the performance measurements in Section 2. This is a result of inter-function interactions not measured in either experiment, but contributing to the results. While this adds a level of uncertainty, note that the average performance improvement due to OSE is well above this factor. These inter-function dependences also explain why the non-exhaustive OSE-Electron can outperform an exhaustive search, since different configurations are used to compile some functions. Also note that OSE is estimator-independent and that future improvements in performance estimation will immediately increase the power of OSE.
Figure 8 shows the compile time dilation of OSE-Electron using Electron as the baseline. For reference, the average benchmark compile time for the single processor baseline configuration was 261 seconds. First, notice that OSE-Electron achieves significant compile-time reduction versus an exhaustive search of the tree. Second, notice that OSE-Electron on dual processor machines achieves a reduction in compile time versus uniprocessor machines. This is because each compilation for each level of the tree can execute in parallel, while the traditional compiler is limited to single sequential compilation. The traditional compiler can run on multiple files simultaneously, as can an OSE compiler, but additional computational power can allow the OSE compiler to explore more configurations in the same amount of time, improving final code quality. This benefit is not available to traditional compilers.
4.3.
Postmortem Code Analysis
In order to ensure that the performance benefits of the OSE technique arise from the sources we expect, and to verify that the performance estimator is working as designed, we examine why some of the benefits in the experiments arise, and examine why the estimator was able to select the correct code. Consider the functions jpeg fdct islow and jpeg idct islow in the 132.ijpeg SPEC95 benchmark. These functions compute forward and inverse discrete-cosine transforms on image blocks. When compiled using Electron’s default configuration for Itanium, these two functions account for about 36% of 132.ijpeg’s execution time. Each of these two functions contains two fixed-count loops iterating 64 times. Electron’s high-level optimizer, which is run before the more machine-specific low-level optimizer in its back end, contains a loop unrolling transformation for fixed count loops, controlled by a heuristic. Since the code of the four loops described above contains many data dependencies, which would prevent efficient scheduling, the loop unrolling heuristic decides to unroll each of these loops 8 times. Subsequently, a second loop unrolling transformation in the back-end optimizer unrolls each loop another 8 times. While full unrolling seems sensible in this case, if the highlevel unrolling is turned off, 132.ijpeg sees a 23% improvement in performance due almost exclusively to improvements in these two functions. This is because complete unrolling makes each function’s code bigger than the 16-kilobyte L1 instruction cache. The result is that the completely unrolled version of the code spends 19% of its execution time stalled in the instruction fetch stage, whereas the partially unrolled code spends only 5%. This instruction cache performance loss overwhelms any gains due to better scheduling. One is tempted to think that better high-level loop unrolling heuristics could avoid this problem. However, this is unlikely, since such heuristics would have to anticipate the usually significant code size effect of all future optimization passes. On the other hand, the OSE compiler uses an estimator that exam-
ines the code after unrolling and all subsequent optimizations. The estimator can easily detect that the unrolled loops exceed the instruction cache size, and thus avoid selecting that version of the code. Another case where OSE is able to achieve a large performance benefit is the function fullGtU in the 256.bzip2 SPEC2000 benchmark. When compiled with Electron’s default configuration, this function accounts for 48% of total running time. Our experiments show that a performance improvement of 76% is achieved in this function when software pipelining is disabled. Software pipelining is applied in order to overlap iterations in a loop while yielding fewer instructions and higher resource utilization than unrolling. During software pipelining, the loop’s 8 side exits are converted to predicated code. The conditions for these side exits and, consequently, the conditions on the new predicate define operations in the pipelined loop depend on values loaded from memory within the same iteration of the loop. Since the remainder of the code in the loop is now flow dependent upon these new predicates, the predicate defines are now on the critical path. To reduce schedule height, these predicate defining instructions are scheduled closer to the loads upon which they depend. During execution, cache misses stall the loop immediately at these predicate define uses causing performance degradation. The performance of this code depends heavily on the ability of the compiler to separate these ill-behaved loads from their uses. However, the constraints governing this separation are difficult to anticipate until after optimization. In this case, the predication causing the problem only occurs after the software pipelining decision has been made. Anticipating and avoiding this problem with a predictive heuristic would be extremely difficult. Fortunately, the OSE compile-time performance estimator can easily identify the problem, since it can examine the load-use distance after optimization.
5.
Conclusion
In this paper, we experimentally demonstrate that predictive heuristics in traditional, single-path compilation approaches sacrifice significant optimization opportunities, motivating iterative compilation. We then propose a novel iterative compilation approach, called Optimization-Space Exploration (OSE), which is both general and practical enough for modern aggressively optimizing compilers targeting generalpurpose architectures. Unlike previous iterative compilation approaches, the applicability of OSE is not limited to specific optimizations, architectures, or application domains. This is because OSE does not make any assumptions about the optimization routines it drives. Furthermore, OSE does not incur the prohibitive compile-time costs of other iterative compilation approaches. Compile time is limited in three ways. First, the search space to be explored at compile-time is limited by leveraging
existing compiler predictive heuristics, by aggressively limiting the optimization space at compiler-construction time, and by characterizing the behavior of the remaining search space for further refinement at compile time. Second, instead of executing the code to determine code quality, a simple and fast performance estimator is employed. Third, OSE is only applied to the frequently executed code in a program. The potential of the OSE technique has been proved by implementing an OSE-enabled version of an existing aggressively optimizing compiler for a modern EPIC architecture. Experimental results confirm that OSE is capable of delivering significant performance benefits, while keeping compile times reasonable.
Acknowledgments We thank Carole Dulong, Daniel Lavery, and the rest of the Electron Compiler Team at Intel Corporation for their help during the development of OSE and this paper. We also thank Mary Lou Soffa, John W. Sias, and the anonymous reviewers for their insightful comments. This work was supported by National Science Foundation grants CCR-0082630 and CCR0133712, a grant from the DARPA/MARCO Gigascale Silicon Research Center, and donations from Intel.
References [1] Intel Corporation, IA-64 Application Developer’s Architecture Guide, May 1999. [2] Phillips Corporation, “Phillips Trimedia Processor Homepage,” 2002. http://www.semiconductors.philips.com/trimedia/. [3] Equator Corporation, “Equator map architecture,” http://www.equator.com/products/MAPCAProductBrief.html.
2002.
[4] D. F. Bacon, S. L. Graham, and O. J. Sharp, “Compiler transformations for high-performance computing,” ACM Computing Surveys, vol. 26, no. 4, pp. 345–420, 1994. [5] E. Granston and A. Holler, “Automatic recommendation of compiler options,” in Proceedings 4th Feedback Directed Optimization Workshop, December 2001. [6] T. Kisuki, P. M. W. Knijnenburg, M. F. P. O’Boyle, F. Bodin, and H. A. G. Wijshoff, “A feasibility study in iterative compilation,” in International Symposium on High Performance Computing, pp. 121–132, 1999. [7] K. D. Cooper, D. Subramanian, and L. Torczon, “Adaptive optimizing compilers for the 21st century,” in Proceedings of the 2001 Symposium of the Los Alamos Computer Science Institute, October 2001. [8] J. Llosa, M. Valero, E. Ayguade, and A. Gonzalez, “Modulo scheduling with reduced register pressure,” IEEE Transactions on Computers, vol. 47, no. 6, pp. 625–638, 1998. [9] R. Govindarajan, E. R. Altman, and G. R. Gao, “Minimizing register requirements under resource-constrained rate-optimal software pipelining,” in In Proceedings of the 27th Annual International Symposium on Microarchitecture, December 1994. [10] R. Leupers, “Instruction scheduling for clustered vliw dsps,” in Proceedings of the International Conference on Parallel Architecture and Compilation Techniques, October 2000. [11] J. R. Goodman and W. C. Hsu, “Code scheduling and register allocation in large basic blocks,” in Proceedings of the 1988 International Conference on Supercomputing, pp. 442–452, July 1988.
[12] S. A. Mahlke, D. C. Lin, W. Y. Chen, R. E. Hank, R. A. Bringmann, and W. W. Hwu, “Effective compiler support for predicated execution using the hyperblock,” in Proceedings of the 25th International Symposium on Microarchitecture, pp. 45–54, December 1992. [13] D. I. August, W. W. Hwu, and S. A. Mahlke, “A framework for balancing control flow and predication,” in International Symposium on Microarchitecture, pp. 92–103, 1997. [14] F. Bodin, D. Windheiser, W. Jalby, D. Atapattu, M. Lee, and D. Gannon, “Performance evaluation and prediction for parallel algorithms on the BBN GP1000,” in Proceedings of the 4th International Conference on Architectural Support for Programming Languages and Operating Systems, pp. 401–413, April 1990. [15] D. I. August, D. A. Connors, S. A. Mahlke, J. W. Sias, K. M. Crozier, B. Cheng, P. R. Eaton, Q. B. Olaniran, and W. W. Hwu, “Integrated predication and speculative execution in the IMPACT EPIC architecture,” in Proceedings of the 25th International Symposium on Computer Architecture, pp. 227–237, June 1998. [16] Intel Corporation, Electron C Compiler User’s Guide for Linux, 2001. [17] Y.-T. S. Li, S. Malik, and A. Wolfe, “Performance Estimation of Embedded Software with Instruction Cache Modeling,” Design Automation of Electronic Systems, vol. 4, no. 3, pp. 257–279, 1999. [18] S. Eranian, “pfmon Performance ftp://ftp.hpl.hp.com/pub/linux-ia64.
Monitoring
Tool.”