as affected by demand, sales effectiveness and production capacity. Sales Force: This ..... per period, such change can occur by recruiting new sales units or by.
Complete Model Documentation This Document Contains the complete model described in Amr Farouk and Saleh Paper An Explanatory Framework for the Growth of Small and Medium Enterprises, This Appendix describe the stock and flow diagrams, and with full variables description and mathematical formulation. The model was written and analyzed using Stella software available from isee systems on http://www.iseesystems.com/ The following figure provides an overview of the submodel Diagram
1. Submodel:
The submodel described as follow:
Advertising Spending: This Sub-module represent the dynamics of optimizing advertising spending. And the effect of Uncertainty, internal information delay and limited know how on the ROI in Advertising
Customers: This Submodule Represent Customers acquiring and loosing dynamics, including the effect of Advertising, Sales Force and Differentiation on Adoption rate.
Differentiation: This Sub-module represent the dynamics of optimizing Investment in different differentiation activities including increasing product quality, variety, adding new features or acquiring new technology. The dynamics of differentiation include its effect on adoption and consumption and the effect of Uncertainty, internal information delay and limited know how on in level of investment in Differentiation
1
Production Capacity: This Submodule represent the dynamics of managing utilization and acquisition of production capacity
Product Development: This Submodule represent dynamics of overcoming market saturation by new product development.
Sales: This Submodule represent the firm's dynamics of obtaining and fulfilling sales, as affected by demand, sales effectiveness and production capacity.
Sales Force: This Submodule represent the dynamics of managing sales force capacity utilization and acquisition
Underutilized Market: This Submodule represents the current level of market saturation, in the stock and flow diagram the components of this module were redistributed on differentiation and product development Submodule.
2
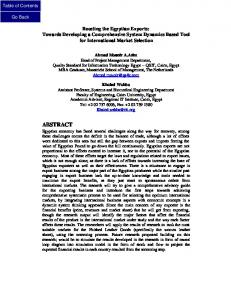
2. Customer Submodule: This Sub module Represent Customers acquiring and loosing dynamics, including the effect of Advertising, Sales Force and Differentiation on Adoption rate.
Adaptors(t) = Adaptors(t - dt) + (Adoption_Rate - Loosing_Adaptors_Rate) * dt INIT Adaptors = 4000 UNITS: customers (customer) DOCUMENT: This Stock Represent Customers who already tried the firm's prodcuts and are found the product quality to be satisfactory, so they become adaptors for the products, or in other words loyal customers. Units = Customers Initial Value = 4000 INFLOWS: Adoption_Rate = Evaluating_Customers* Diffrentiation.Diffrentiation_Effect _on_Adoption UNITS: customer/mo DOCUMENT: The rate at which new customers are converting to be adaptors when trying firm's products, this rate is mainly affected by the level of differentiation in firm's product. 3
Units = Customer/Month OUTFLOWS: Loosing_Adaptors_Rate = (Adaptors*Loosing__Adoptors__Fraction) UNITS: customer/mo DOCUMENT: The Rate at which firm loose adaptors as a result of competition and substitute products. Units Customers/ Month Evaluating_Customers(t) = Evaluating_Customers(t - dt) + (Covering_Rate - Adoption_Rate - Dislike__Product_Rate) * dt INIT Evaluating_Customers = 1200 UNITS: customers (customer) DOCUMENT: This Stock Represent Interested Customers who were successfully approached by Firm Sales Force, and in product trying and evaluation phase. Units = Customers Intial Value = 1200 INFLOWS: Covering_Rate = (Covering__Fraction*Interested__Customers)/ Time_to_Obtain_Evaluation UNITS: customer/mo DOCUMENT: The Rate at which new customers try firm's product, as a result of being approached by sales force. Units = Customers/ Month OUTFLOWS: Adoption_Rate = Evaluating_Customers* Diffrentiation.Diffrentiation_Effect _on_Adoption UNITS: customer/mo DOCUMENT: The rate at which new customers are converting to be adaptors when trying firm's products, this rate is mainly affected by the level of differentiation in firm's product. Units = Customer/Month
4
Dislike__Product_Rate = Evaluating_Customers*(1Diffrentiation.Diffrentiation_Effect_on _Adoption) UNITS: customer/mo DOCUMENT: The rate at which new customers dismiss the product due to unsatisfactory from current level of differentiation in firm's product. Units = Customer/Month Interested__Customers(t) = Interested__Customers(t - dt) + (Gaining_Interest_Rate - Loose__Intrest - Covering_Rate) * dt INIT Interested__Customers = 2800 UNITS: customers (customer) DOCUMENT: This Stock Represent the Customers who already developed interest in product as a result of Advertising, but have not yet tried the product. Units = Customers Intial Value = 2800 Customers INFLOWS: Gaining_Interest_Rate = Adaption_from_WOM+ Advertising__Spending.Rate_of_Interested_customers_from_ advertising UNITS: customer/mo DOCUMENT: The rate at which new customers develop interest in firm's products a month, as affected by advertising. Units = Customers/Month OUTFLOWS: Loose__Intrest = (Interested__Customers*Out_of__Coverage_Rate)/ Time_for_consumers_to_loose_interest UNITS: customer/mo DOCUMENT: The rate at which newly interested customers loose interest as a result of lake of product availability. Units = Customers/Month Covering_Rate = (Covering__Fraction*Interested__Customers)/ Time_to_Obtain_Evaluation UNITS: customer/mo DOCUMENT: The Rate at which new customers try firm's product, as a result of being approached by sales force. Uints = Customers/ Month Potential__Adaptors(t) = Potential__Adaptors(t - dt) + (Loosing_Adaptors_Rate + Loosing_Customers_Rate Gaining_Interest_Rate) * dt 5
INIT Potential__Adaptors = Total__PopulationInterested__Customers- Evaluating_Customers UNITS: customers (customer) DOCUMENT: This Stock Represent the potential customers who were not yet approached by the firm, Units = Customers Initial = Total Population - approached customers INFLOWS:
6
Loosing_Adaptors_Rate = (Adaptors*Loosing__Adoptors__Fraction) UNITS: customer/mo DOCUMENT: The Rate at which firm loose adaptors as a result of competition and substitute products. Units Customers/ Month Loosing_Customers_Rate = Dislike__Product_Rate+Loose__Intrest UNITS: customer/mo DOCUMENT: This is the rate at which firm loose potential customers as a result of losing interest or disliking the product Units= customer/month OUTFLOWS: Gaining_Interest_Rate = Adaption_from_WOM+ Advertising__Spending.Rate_of_Interested_customers_from_ advertising UNITS: customer/mo DOCUMENT: The rate at which new customers develop interest in firm's products a month, as affected by advertising. Units = Customers/Month Loosing__Adoptors__Fraction = .01 UNITS: 1/months (1/mo) DOCUMENT: This variable represent percentage of adaptors firm loose in average a month as a result of competition and substitute products. Units = 1/month Variable is standardized at a level of 1% of current adaptors a month loosing interest Target_Coverage = Evaluating_Customers + Adaptors + Interested__Customers UNITS: customers (customer) DOCUMENT: This Variable represent the number of customers targeted to be covered by sales force, including customers who are already adaptors and other in evaluation stage and new customers who gained recent interest from advertisign Units = Customers Time_for_consumers_to_loose_interest = 6 UNITS: months (mo) DOCUMENT: This Variable represent the average time consumer stay before loosing interest in product due to non-availability of the product. Units = Month Varialble Standarized at 6 Months Time_to_Obtain_Evaluation = 3 UNITS: months (mo) 7
DOCUMENT: This Variable represent the average time Sales force need to convience new customer to try the product. Units = Month Variable = 3 Months Customers.Consumer effect
of current customers
Coverage: DOCUMENT: This Sub module Represent the sales force capabilities in approaching new
8
Avilable__capacity = Sales_Force.Covering__Capacity-Adaptors UNITS: customers (customer) DOCUMENT: This Variable Represent the remaining sales capacity that can be dedicated to acquiring new customers after decreasing the current customers served Unit = Customers Covering__Fraction = If Switch_Sales_Capacity_Effect = 1 Then effect_of_Avilable_capacity__utilization_on_covering_r ate* Refrence__Covering_Fraction Else Refrence__Covering_Fraction UNITS: Unitless DOCUMENT: The Variable represent the fraction of interested customers that current sales force can convert to evaluation customers. The variable is controld by a switch to isolate the effect of current capacity when needed. Unit = Unitless Out_of__Coverage_Rate = 1-Covering__Fraction UNITS: Unitless DOCUMENT: This Variable represent the rate of customers tha will be lost due to lake of coverage Unit = Unitless Refrence__Covering_Fracti on = .7 UNITS: Unitless DOCUMENT: This Variable represent the standard fraction of interested customers that current sales force can convert to evaluation customers. Unit = Unitless Variable Standarized at 70% Switch_Sales_Capacity_Eff ect = 1 UNITS: Unitless DOCUMENT: The variable i s a switch to control the effect of current capacity on covering fraction when needed. Unit = Unitless The variable can be switch by simulation user between 0 and 1 effect_of_Avilable_capacity__utilization_on_covering _rate = GRAPH(Avilable__capacity/Interested__Customers) (0.00, 0.00), (0.2, 0.2), (0.4, 0.38), (0.6, 0.55), (0.8, 0.7), (1.00, 0.8), (1.20, 9
0.85), (1.40, 0.9), (1.60, 0.95), (1.80, 1.00), (2.00, 1.00) UNITS: Unitless DOCUMENT: This variable represent graphically the relation between Current Sales Capacity and covering capacity, the purpose of using this variable is to prevent unrealistic sharp discontinuity in acquiring customers, this method have been suggested by Sterman (2000 page 530) F(0) = 0 F(∞) = 1
10
Customers.WOM:DOCUMENT: This Submodule represent the effect Mouth on the arousing interestin in ew customers Adaption_from_WOM = Interest__Fraction*Contact_Rate*Potential__Adaptors* Adaptors/Total__Population UNITS: customer/mo DOCUMENT: Rate of Customers Gaining Interest as a result of word of mouth Units = Customers/month Contac t_Rate = 10 UNITS: 1/month (1/mo) DOCUMENT: The Rate at which customers contact Units per month Variable is standardized at 10 a month Interest__Fraction = .0015 UNITS: Unitless DOCUMENT: This represent the fraction of population who will gain interest in firm's product when if recpmmended by other customers Units = Unitless Variable is standarized at .15% Total__Population = 250000 UNITS: customers (customer) DOCUMENT: This is the total number of customers in the market including current adopters, potential adaptors and other customers in different adoption stages. Units = Customers Initial Value = 250,000 Customers
11
of Word
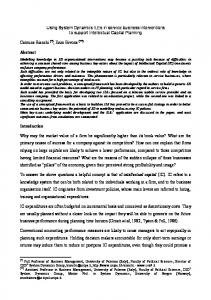
3. Sales Submodule This Submodule represents the firm's dynamics of obtaining and fulfilling sales, as affected by demand, sales effectiveness and production capacity.
Backlog(t) = Backlog(t - dt) + (Orders Sales__Fulfillment_Rate) * 12
Acquiring_Rate -
dt INIT Backlog = 25000 UNITS: units (unit) DOCUMENT: This stock represent not yet been fulfilled.
the current sales orders that have
Units = Unit/month Initial Value = 25000 Units per month
INFLOWS: Orders__Acquiring_Rate = Accessible__Demand*Sales_Effictivness UNITS: unit/mo DOCUMENT: This variable represents that rate at which the firm obtain orders a month Units = Units/ month^2 OUTFLOWS: Sales__Fulfillment_Rate = If Switch_Infinite_Capcity=0 Then Min(Backlog/Target__Delay,Production_Capacity.Productio n_Capacity) Else Backlog/Target__Delay UNITS: unit/mo DOCUMENT: This variable represent the rate at which firm fulfill its sales, as affected by both current production capacity and target delay. Units = Units/month^2 Accessible__Demand = Customers.Adaptors* Diffrentiation.consumption_per _customer UNITS: unit/mo DOCUMENT: Accessible demand represent the maximum demand that firm can achieve considering the current range of products firm offers and current customers firm Cover. Units = Units / month
13
Refrence_Sales_Effictivness = .4 UNITS: Unitless DOCUMENT: This variable represent the standard sales effectiveness without other factors like change in advertising or pricing. Units = unitless This variable is standardized at level of 40% Sales_Effictivness = Advertising__Spending.Sales_Uplift_fraction+ Refrence_Sales_Effictivness UNITS: Unitless DOCUMENT: This variable represents the firm's sales effectiveness in obtaining orders. Units = Unitless Switch_Infinite_Capcity = 0 UNITS: Unitless DOCUMENT: The variable is a switch to control the effect of current production capacity on sales fulfillment rate when needed. Unit = Unitless The variable can be switch by simulation user between 0 and 1 Target __Dela y=1 UNITS: months (mo) DOCUMENT: This variable represent the time delay that firm target not to exceed before fulfilling the order, this delay represent the perceived acceptable delay by the customer. Units = Months This variable is standardized at a level of 1 month
14
15
4. Financial Submodule This Submodule represents the financial results of current firm operation, including costs, depreciation, revenue profit and return on investment.
Profit = Revenue_2-Total_Cost UNITS: US dollars per month (USD/mo) DOCUMENT: This Variable Represent the firm Profit Units = USD/month ROI = Profit/Total _Cost UNITS: Unitless DOCUMENT: This Variable represent the Firms general Return on Investment Units = USD/ Month Total_Cost = Operation__Cost+Depreciation_Rate+Direct_Cost UNITS: US dollars per month (USD/mo) 16
DOCUMENT: This variable represent the firm's total cost, which include Total Direct cost, Operation Cost and Depreciation Units = USD/ Month Financial Perfo rmance.Assets: Assets_2(t) = Assets_2(t - dt) + (Acquire_Assets Assets__Reduction__Rate) * dt INIT Assets_2 = 500000 UNITS: US Dollars (USD) DOCUMENT: This Variable represent the value of the accumulated assets Units = USD Initial Value = 500,000 USD INFLOW S: Acquire_Assets = Average_Assets__Per_New_Product* Product__Development.NPD UNITS: US dollars per month (USD/mo) DOCUMENT: This variable represent the rate at which firm accumlate new assets Units = USD/month O U T F L O W S : Assets__Reduction__Rate = Depreciation_Rate+ Reduced_Assets_of__Terminated _Productds UNITS: US dollars per month (USD/mo) DOCUMENT: This variable represent the rate at which firm Depreciate current assets Units = USD/month Average_Assets__Per_New_Product = 1000000 17
UNITS: US Dollars/products (USD/products) DOCUMENT: This Variable Represent the Average Assets acquired per new product. Units = USD/ Product This Variable is standardized at 1,000,000 USD per new product Average_Assets__Per_Product = Assets_2/Product__Development.Products UNITS: US Dollars/products (USD/products) DOCUMENT: This variable represent the average value of assets per products. Units = USD/ Product
18
Depreciation_Fraction = .08 UNITS: 1/month (1/mo) DOCUMENT: This variable represent the average fraction at which the assets is depreciated Units = 1/ month This variable is standardized at 8% which represent average Depreciation of 12.5 year per asset. Depreciation_Rate = Assets_2*Depreciation_Fraction UNITS: US dollars per month (USD/mo) DOCUMENT: This variable represent the total amount of depreciation. Units = USD/ Month Reduced_Assets_of__Terminated_Productds = Average_Assets__Per_Product* Product__Development.Product_Outdate UNITS: US dollars per month (USD/mo) DOCUMENT: This Variable represent reduction of assets as a result of current level of prodcuts termination Units = USD/ Month Financial Performance.Operational Cost: Operation Cost(t) = Operation Cost(t - dt) + (Increase_Opretation_Cost - Decrease_Operation_Cost) * dt INIT Operation Cost = 50000 UNITS: US dollars per month (USD/mo) DOCUMENT: This variable represent the time the total indirect operation cost the firm pay monthly, include service departments like accounting and HR and which cannot be allocated directly on certain product. Units USD/month Intial Value 50,000 USD/Month INFLOWS: Increase_Opretation_Cost = Product__Development.NPD* Marginal_Operation_Cost__Per_Product UNITS: usd/mo^2 DOCUMENT: This Variable represent the rate which the firm increase new operation cost a month, for example by renting new building or employing for new job. Units = USD/ Month^2 (USD per month each month) OUTFLOWS: Decrease_Operation_Cost = Marginal_Operation_Cost__Per_Product* Product__Development.Product_Outdate UNITS: usd/mo^2 DOCUMENT: This Variable represent the rate which the firm decrease current operation cost a month, for example 19
by termination rent building contract or canceling current job. Units = USD/ Month^2 (USD per month each month)
20
Marginal_Operation_Cost__Per_Product = 20000 UNITS: US Dollars/products-months (USD/products-mo) DOCUMENT: This variable represent the marginal operation of adding or removing a product. Units = USD/Month-product This Variable is standardized at 20,000 USD/ month per product Financial
Performance.Revenue:
Recent
Revenue(t) = Recent Recent_Revenue) *
Revenue(t - dt) + (Change_in
dt INIT Recent__Revenue = 170000 UNITS: US dollars per month (USD/mo) DOCUMENT: This Variable represent the firm's recent revenue, this is the revenue achieved in the last period of budgeting. Units = USD/ Month Initial Value = 170,000 USD/ Month INFLOWS: Change_in__Recent_Revenue = (Revenue_2Recent__Revenue)/ Revenue__Reporting_Delay UNITS: usd/mo^2 DOCUMENT: This variable represent the rate of change in recent revenue as a a result of new level of revenue and reporting delay. Uni ts = US D/ mo n^2 Price = 10 UNITS: US Dollars/units (USD/unit) DOCUMENT: This Variable Represent the Average Price per Unit Units = USD/ Unit This Variable is standardized at a level of 10 USD/ Unit Revenue_2 = Sales.Sales__Fulfillment_Rate*Price UNITS: US dollars per month (USD/mo) DOCUMENT: This Variable represents the achieved sales revenue Units = USD/ Month Revenue Reporting_Delay = 3 UNITS: months (mo) DOCUMENT: A one quarter-year delay is assumed in the budgeting process. Units = Months This variable is standardized on 3 months 21
Financial
Performance.Variable
Cost:
Direct_Cost = Direct_Cost__Per_Unit*Sales.Sales__Fulfillment_Rate UNITS: US dollars per month (USD/mo) DOCUMENT: This Variable represent the Direct cost total direct cost for all the sales fulfilled in the last month Units = USD/ Month
22
Direct_Cost Per _Unit = 5 UNITS: US Dollars/units (USD/unit) DOCUMENT: This Variable represent the The Direct cost per unit Units = USD/ Unit This variable is standardized at 5 USD/units
23
5. Sales Force Sub-Module This Sub-module represents the dynamics of managing sales force capacity utilization and acquisition
Covering
Capacity(t) = Covering Capacity(t - dt) + (rate_of_Covering__new_customers) * dt INIT Covering Capacity = 8000 UNITS: customers (customer) DOCUMENT: This Variable represent total number of customers that can be reached by the current sales force. Unit = Customers Intial Value = 8000 Customers INFLOWS: rate_of_Covering__new_customers = Rate_of_change_in__Sale_Units* Average_Customers__per_new_sales* Effect_of_Market_Saturation_on_Sales_Productivity UNITS: customer/mo DOCUMENT: This variable represent the rate of change in covering new customers. Units = Customers / month 24
Recent_Sales_Force_Increase(t) = Recent_Sales_Force_Increase(t - dt) + (Change_in__Recent_Sales_Force) * dt INIT Recent_Sales_Force_Increase = 2 UNITS: employees (employee) DOCUMENT: This Variable Represent the recent Sales Force Increase Units = employees Initial value 2 Sales Units INFLOWS: Change_in__Recent_Sales_Force = (Sales_ForceRecent_Sales_Force_Increase)/Reie wing_interval UNITS: employee/mo DOCUMENT: This variable represent the change in recenet Sales Force Units = employees/ month Sales_Force(t) = Sales_Force(t - dt) + (Rate_of_change_in__Sale_Units) * dt INIT Sales_Force = 2 UNITS: employees (employee) DOCUMENT: this stock represent number of sales units, each sales unit represent sales man with his Van car. Units: employees Initial: 2 Sales Units INFLOWS:
25
Rate_of_change_in__Sale_Units = Sales_Force_Gap/ Time_to_chagne_sales_units UNI TS: empl oyee /mo DOCUMENT: This rate represent the average change in sales units per period, such change can occur by recruiting new sales units or by dismissing current sales unit unit = employees per month Target__Sales_Force(t) = Target__Sales_Force(t - dt) + (Change_in_TSF) * dt INIT Target__Sales_Force = 4 UNITS: employees (employee) DOCUMENT: This Variable represent the targeted Sales force as planned by entrepreneur Units = employees Intiail value = 4 employees (sales units) INFLOWS: Change_in_TSF = Round((Customers.Target_Coverage/ Average_Customers_per_sales_Unit)*Change_in_ROI^Sensitivit y_to_ROI)/ Planning_time UNITS: employee/mo DOCUMENT: This variable represent the change rate in targeted sales force Units = Employees per Month Average_Customers_per_sales_Unit = Covering__Capacity/Sales_Force UNITS: customers/employees (customer/employee) DOCUMENT: This variable represent the average customers covered per sales units. Units = Customers per employee Average_Customers__per_new_sales = 4000 UNITS: customers/employees (customer/employee) DOCUMENT: This Variable represent average customers covered by new hire of sales units. Units = customers/ employee
26
This Variable is standardized at a level of 4000 Customers per Employee, as according to the case single sales man in average cover 200 retailers where in average every retailer cover 20 customers.
Change_in_ROI = ROI_in__Sales_Force/Refrence_ROI UNITS: Unitless DOCUMENT: This Variable represent the recent change in ROI as a result of changing sales force Units = Unitless
27
Planning_time = 1 UNITS: months (mo)
DOCUMENT: This variable represent time needed to decide on target change Units = Month This Variable is standardized on 1 month Refrence_Market_Share = init(Product__Development.Market_Share) UNITS: Unitless DOCUMENT: This Variable represent standard market share as a refrence point Units = Unitless Intial Value = 15% market share Refrence_ROI = init(ROI_in__Sales_Force) UNITS: employee-mo/usd (employee-mo/usd) DOCUMENT: This variable represent the standard return on investment in sales force Units = Employee-month/usd (usd per month return from each new employee)
Reiewing _interval =6 UNITS: months (mo) DOCUMENT: This variable represent the average time interval between planning review to the sales force Units = months this variable is standardized at 6 months ROI_in__Sales_Force = Recent_Sales_Force_Increase/ Financial__Performance.Recent__Reven ue UNITS: employee-mo/usd (employee-mo/usd) DOCUMENT: This variable represent the return on investment in sales force Units = Employee-month/usd (usd per month return from each new employee) Sales_Force_Gap = Target__Sales_Force-Sales_Force UNITS: employees (employee) DOCUMENT: This Variable represent the gap between target sales force and current sales force
28
Units = employees Sensitivity_to_ROI = .05 UNITS: Unitless DOCUMENT: This variable represent the entrepreneur sensitivity to change in ROI units = unitless This variable is standardized on .05
29
DOCUMENT: This variable represent the time needed to recruit and train new sales in case of increasing sales units, and the time needed to dismiss sales units include notice period. Units = Months This variable is standardized on the level of 3 months Effect_of_Market_Saturation_on_Sales_Productivity = GRAPH(Product__Development.Market_Share/Refrence_Market_Share) (0.00, 0.99), (0.2, 0.836), (0.4, 0.759), (0.6, 0.648), (0.8, 0.511), (1.00, 0.43), (1.20, 0.374), (1.40, 0.374), (1.60, 0.347), (1.80, 0.33), (2.00, 0.33) UNITS: Unitless DOCUMENT: This variable represent graphically the effect of Market Saturation on the ability of new sales unit added to cover customers, the purpose of using this variable is to prevent unrealistic sharp discontinuity in covering customers, this method have been suggested by Sterman (2000 page 530) Units = Unitless F(0) = 1 F(∞) = 0
30
6. Production Capacity Submodule This Sub-module represents the dynamics of managing utilization and acquisition of production capacity.
Production_Capacity(t) = Production_Capacity(t - dt) + (Rate_of_Change__in_Capacity) * dt INIT Production_Capacity = 10000 UNITS: unit/mo DOCUMENT: This variable represent the firm's production capacity per month Units = Units/ month Intial value = 10000 units a month
31
INFLOWS: Rate_of_Change__in_Capacity = Delay(Capacity_Gap,6)/ Time_to_Acquire_New_Capacity UNITS: unit/mo^2 DOCUMENT: This Variable represents the rate of change in production capacity Units = Units/month^2 (units per month change per month) Capacity_Gap = If (Recent__Order_Rate > Production_Capacity) THEN Recent__Order_RateProduction_Capacity ELSE 0 UNITS: unit/mo DOCUMENT: This variable represent the gap between curent orders rate, and firm's production capacity to fulfill this orders Units = Units/month
Production_Capacity__Utilization_Rate = Sales.Sales__Fulfillment_Rate/ Production_Capacity UNITS: Unitless DOCUMENT: This variable represent production utilization rate Units = unitless Time_to_Acquire_New_Capacity = 3 UNITS: months (mo) DOCUMENT: This variable represent the time needed to acquire production capacity (buy new mac hine s) Unit s= Mon th This variable is standarized at 3 months
Production
Capacity.Recent
Order
32
Rate:
Recent
Order_Rate(t) = Recent Order_Rate(t - dt) + (Change_AOR) * dt INIT Recent Order_Rate = 7000 UNITS: unit/mo DOCUMENT: This variable represent recently reported sales orders rate Units = units/month Initial value is 7000 units a month INFLOWS: Change_AOR = (Sales.Orders__Acquiring_RateRecent__Order_Rate)/ Time_to_Gain_confidence_in_Orders UNITS: unit/mo^2 DOCUMENT: This variable represent the rate of change in recenet order value. Units = Unit/mo^2 (Units/month change each month) Time_to_Gain_confidence_in_Orders = 6 UNITS: months (mo) DOCUMENT: This variable represent the average period the entrepreneur consider to calculate sustainable order rate Units = Months This variable is standardized at 6 months
33
7. Advertising Submodule This Sub-module represent the dynamics of optimizing advertising spending, and the effect of Uncertainty, internal information delay and limited know how on the ROI in Advertising
Advertising_Spending(t) = Advertising_Spending(t - dt) + (Change_in dt INIT Advertising_Spending = 10000 UNITS: US dollars per month (USD/mo) DOCUMENT: This Variable represent the level of advertising spending the firm budget Units = USD/ Month Intial Value = 10,000 INFLOWS: Change_in__Ad_Spending = (Indicated_BudgetAdvertising_Spending)/ Time__Needed_to_Perform_Advertising_Correctly UNITS: usd/mo^2 DOCUMENT: This Variable Represent the rate of change in Advertising Spending Budget, which is changing as result of the 34
Ad_Spendin
recent level of advertising effectiveness, and the time needed to perform advertising correctly. Units = USD/ Month Effect_of_ROI_on__Ad_Spending = Recent_ROI__on_AD_Spending^Sensitivity_to_ROI UNITS: Unitless DOCUMENT: This Variable represent the effect of change of ROI as a result of Advertising spending on the Indicated Budget Units = Unitless Indicated_Budget = Advertising_Spending*Effect_of_ROI_on__Ad_Spending UNITS: US dollars per month (USD/mo) DOCUMENT: This Variable represent the new level of advertising spending, which is perceived by the entrepreneur as more rewarding level as a result of recent change in ROI spending. Units = USD/ Month Recent_ROI__on_AD_Spending = Return__on_Advertising/Advertising_Spending UNITS: Unitless DOCUMENT: This Variable represent the ROI as a result of Advertising spending Units = Unitless Return__on_Advertising = Return_from_Awarness+Return_from_Sales_Uplift UNITS: US dollars per month (USD/mo) DOCUMENT: This represent the return on Advertising achieved from both the effect of advertising increasing awareness, and sales uplift Units = USD/Month Sensitivity_to_ROI = .5 UNITS: Unitless DOCUMENT: This variable represent the entrepreneur sensitivity to change in ROI, to response accordingly by changing spending level, the more the entrepreneur is sensitive to change to ROI, the faster he will response and the more steep the spending curve will be. This variable is a control variable that User of simulation can change to test the effect of several levels of Sensitivity on Investment level. Units = Unitless Initial value = .5
35
Time__Needed_to_Perform_Advertising_Correctly = 1 UNITS: months (mo) DOCUMENT: This Variable represent the effect of Firm's "know-how" in advertisign, as it measure how many months is needed to deploy advertising budget correctly. This variable is a control variable that User of simulation can change to test the effect of several levels of know-how Units = Months Initial value =1 month Advertising Spending.Awarness:DOCUMENT: This is a Decision Submodule represent the relation between Advertising Spending and Customers Awarness Fraction__Awarness = Refrence_effect_of_Ad_spending_on_Awarness* Effect_of__Ad_Spending_on_Awarness UNITS: Unitless DOCUMENT: This variable represent the fraction of potntial adaptors who gain interest in firm's product as a result of being exposed to the advertising. Units = Unitless Rate_of_Interested_customers_from_advertising = Recent_interested_from_Ad/ time_achieve_awarness UNITS: customer/mo DOCUMENT: This Variable Represnent the rate at which Customers gain awarness as a result of recent advertising. Units = Cusomters/month Recent_Adaptors__from_Ad = (Customers.Adaptors/ Customers.Potential__Adaptors)*Recent_interested_from_Ad UNITS: customers (customer) DOCUMENT: This variable represent the recent changes in adaptors as a result of change in advertising. Unts = Customers Recent_interested_from_Ad = Customers.Potential__Adaptors* Fraction__Awarness UNITS: customers (customer) DOCUMENT: This Variable represent the recent change in customers gaining interest every month as a result of change in advertising spending Units = Customers/month Refrence_effect_of_Ad_spending_on_Awarness = .02 UNITS: Unitless 36
DOCUMENT: This Variable represent a refrence value for effect of Spending on awarness fraction Units = Unitless This variable were standarized at .02 Return_from_Awarness = Recent_Adaptors__from_Ad*Revenue_per_Adoptor UNITS: US dollars per month (USD/mo) DOCUMENT: This Variable represent the Recent return gained as a result of recent change in Advertising Units = USD/ month
37
Revenue_per_Adoptor = Financial__Performance.Recent__Revenue/ Customers.Adaptors UNITS: US Dollars/customer-mo (USD/customer-mo) DOCUMENT: This Variable represent average revenue achieced per customer. Units = Usd/Customer-month time_achieve_awarness = 1 UNITS: months (mo) DOCUMENT: This variable represent time needed to acquire Interested Customers as a result of advertising spending Units = Months This Variable is standarized on the rate of 1 Month Effect_of__Ad_Spending_on_Awarness = GRAPH(Advertising_Spending/ Refrence_Advertising_Spending) (0.00, 0.5), (0.2, 0.5), (0.4, 0.525), (0.6, 0.72), (0.8, 0.81), (1.00, 0.885), (1.20, 0.975), (1.40, 1.08), (1.60, 1.33), (1.80, 1.46), (2.00, 1.50) UNITS: Unitless DOCUMENT: This variable represent graphicalyt the Effect of Advertising Spending change on Awarness. this variable constrain the effectiveness of advertising to a realstic levels by smoothing the maximum and minimum effect of the advertising on sales uplift.This variable represen Units = Unitless F(-∞)= .5. F(1)=1, F(∞) = 1.5 Advertising Spending.Sales Uplift:DOCUMENT: This is a Decision Submodule represent the relation between Advertising Spending and the Sales Marginal_Sales_Uplift = Sales.Accessible__Demand*Sales_Uplift_fraction UNITS: unit/mo DOCUMENT: This Variable Represent change in sales units sold as a result of recent change in sales uplift. Units = Units/ Month Refrence_Advertising_Spending = init(Advertising_Spending) UNITS: US dollars per month (USD/mo) DOCUMENT: This variable represent a refrence level of advertising spending Units = USD/Month Refrence_Effect_of__Budget_on_Sales_Uplift = .05 UNITS: Unitless 38
DOCUMENT: This Variable represent a refrece value for the sales uplift. Units = Unitless This variable were standarized at .05 Return_from_Sales_Uplift = Financial__Performance.Price*Marginal_Sales_Uplift UNITS: US dollars per month (USD/mo) DOCUMENT: This Variable represent the chang in Sales Value gained as a result of recnt change in Advertising. Unts = USD/Month
39
Sales_Uplift_fraction = Refrence_Effect_of__Budget_on_Sales_Uplift* Effect_of__Budget_on_Sales_Uplift UNITS: Unitless DOCUMENT: This Variable represent the advertising effect on sales order rate, which the percentage of acceessible demand that can be gained as a resule of increasing advertising spending Units = Unitless Effect_of__Budget_on_Sales_Uplift = GRAPH(Advertising_Spending/ Refrence_Advertising_Spending) (0.00, 0.5), (0.2, 0.5), (0.4, 0.525), (0.6, 0.72), (0.8, 0.81), (1.00, 0.885), (1.20, 0.975), (1.40, 1.08), (1.60, 1.33), (1.80, 1.46), (2.00, 1.50) UNITS: Unitless DOCUMENT: This variable represent graphicalyt the Effect of Advertising Spending change on Sales Uplift. this variable represent constraing the effectiveness of advertising to a realstic levels by smoothing the maximum and minimum effect of the advertising on sales uplift.This variable represen Units = Unitless F(-∞)= .5. F(1)=1, F(∞) = 1.5
40
8. Differentiation Submodule This Sub-module represent the dynamics of optimizing Investment in different differentiation activities including increasing product quality, variety, adding new features or acquiring new technology. The dynamics of differentiation include its effect on adoption and consumption and the effect of Uncertainty, internal information delay and limited know how on in level of investment in Differentiation.
41
consumption_per_customer(t) = consumption_per_customer(t - dt) + (Change consumption) * dt INIT consumption_per_customer = 2.5 UNITS: units/customers-months (unit/customer-mo) DOCUMENT: This Variable represents the average consumption per customer. Units = Units/ Customer-month Intial Value: 2.5 Units per month for a customer INFLOWS: Change consumption = (Indicated Consumotionconsumption_per_customer)/Time_to__cha nge_demand UNITS: unit/customer-mo^2 DOCUMENT: This Variable represent the rate at which consumption per customer change, as affected by change in differentiation and market maturity. Units = Units/ Customer-month^2 Level_of_Investment_in_Product_Diffrentiati on(t) = Level_of_Investment_in_Product_Diffrentiati on(t - dt) + (Increase_Investment_in_Product_Diffrentia tion) * dt INIT Level_of_Investment_in_Product_Diffrentiation = 5000 UNITS: US dollars per month (USD/mo) DOCUMENT: This Variable represent the current level of investment in Product Differentiation activities, including investing in quality, features, variety and technology. This level of investment differ according to the perceived return on investment. Units = USD/month Initial Value = 5000 USD/month INFLOWS: Increase_Investment_in_Product_Diffrentiation = (Incidcated_InvestmentLevel_of_Investment_in_Product_Diffrentiation)/ Time__Needed_to_Perform_Differentiation_Correctly UNITS: usd/mo^2 DOCUMENT: This Variable represent the rate at which the entrepreneur change the current level of investmenet in Product Diffrentiation activities Units = USD/month^2 change_in_investment = Delay(Level_of_Investment_in_Product_Diffrentiation, Investment__Review_Interval) UNITS: US dollars per month (USD/mo) 42
DOCUMENT: This Variable represent the recent change in investment in diffrentiation, this reporting value is affected by the Investment Review time Interval Units = USD/month Effect_of_Balance_on_Product_Difrentiation = Recent_ROI__on_Differentiation^ Sensitivity_to__ROI_on_Diffrentiation UNITS: Unitless DOCUMENT: This Variable represent the effect of change of DiffrentiationROI Indicated Budget Units = Unitless
43
on
Incidcated_Investment = Level_of_Investment_in_Product_Diffrentiation* Effect_of_Balance_on_Product_Difrentiation UNITS: US dollars per month (USD/mo) DOCUMENT: This Variable represent the new level of Investment in Differentiation, which is perceived by the entrepreneur as more rewarding level as a result of recent change in ROI spending. Units = USD/ Month Indicated__Consumption = If Switch Adoptio n_Effect= 0 Then Refrence_Consumption_per_customer* Effect_of_Investment_in__Diffrentiation_on_Cons umption* Effect_of_Adoption__Stage_on_Consumption Else Refrence_Consumption_per_customer* Effect_of_Investment_in__Diffrentiation_on_ Consumption UNITS: units/customersmonths (unit/customer-mo) DOCUMENT: This Variable represent the Indicated level of consumption as affected by change in differentiation and market maturity. Units = Units/ Customer-month Investment__Review_Interval = 1 UNITS: months (mo) DOCUMENT: This variable represent the Investment review period (the period entrepreneur consider to measure change in investment) Units = Month This Variable is standardized at 1 month Recent_Change__in_Consumption = consumption_per_customer/ (Delay(consumption_per_customer,3)) UNITS: units/customers-months (unit/customer-mo) DOCUMENT: This Variable represent the recent change in Average customer consumption Units = USD/customer-month Recent_ROI__on_Differentiation = ROI_due_to_change__in_consumption UNITS: Unitless DOCUMENT: This Variable represent the ROI as a result of recent Investment in Differentiation Units = Unitless Refrence_Consumption_per_customer = 4.8 UNITS: units/customers-months (unit/customer-mo) 44
DOCUMENT: This Variable represent a reference value for customer consumption, assuming isolating the effect of Differentiation and market Evolution Units = Unit/Customer-month This variable is standardized at 4.8 units per customer/month
45
Sensitivity_to__ROI_on_Diffrentiation = .5 UNITS: Unitless DOCUMENT: This variable represent the entrepreneur sensitivity to change in ROI of Diffrnetiation, to response accordingly by changing spending level, the more the entrepreneur is sensitive to change to ROI, the faster he will response and the more steep the differentiation investment curve will be. This variable is a control variable that User of simulation can change to test the effect of several levels of Sensitivity on Investment Level Units = Unitless Initial value = .5 Switch__Adoption_Effect = 1 UNITS: Unitless DOCUMENT: The variable is a switch to control the effect of Market Evolution on average consumption when needed. Unit = Unitless The variable can be switch by simulation user between 0 and 1 Time_to__change_demand = 6 UNITS: months (mo) DOCUMENT: This Variable represent the time needed to realize the effect of differentiation investment on consumption Units = Months This Variable is standardized at 6 Months Time__Needed_to_Perform_Differentiation_Correctly = 1 UNITS: months (mo) DOCUMENT: This Variable represent the effect of Firm's "know-how" on Diffrentiation, as it measure how many months is needed to deploy diffrentiation budget correctly. This variable is a control variable that User of simulation can change to test the effect of several levels of know-how Units = Months Intial value =12 month Diffrentiation.Change
in Consumption:DOCUMENT: This is a Decision Submodule represent the relation between Level of investment in Differentiation and the Change in Consumption Effect_of_Consumption_On_Revenue = Financial__Performance.Recent__Revenue/ consumption_per_customer UNITS: customers-US Dollars/units (customer-USD/unit) DOCUMENT: This variable represent the effect of increase in consumption on the firm's revenue. Units = Customer/USD-Unit Effect_of_Investment_in__Diffrentiation_on_Consumption = (Level_of_Investment_in_Product_Diffrentiation/Refrence__Investmen t_Trend)^ sensitivity_to_Investment 46
UNITS: Unitless
47
Marginal_Return__from_Consumption = Effect_of_Consumption_On_Revenue* Delay(Recent_Change__in_Consumption,1) UNITS: US dollars per month (USD/mo) DOCUMENT: This Variable represent the marginal return achieved due to recent increase in consumption Units = USD/ Month Refrence__Investment_Trend = init(Level_of_Investment_in_Product_D iffrentiation) UNITS: US dollars per month (USD/mo) ROI_due_to_change__in_consumption = Marginal_Return__from_Consumption/ Change_in_Investment UNITS: Unitless DOCUMENT: This Variable represent the recent return of investment in differentiation Units = Unitless sensitivity_to_Investment = .5 UNITS: Unitless Diffrentiation.Change Submodule
in Adoption Rate:DOCUMENT: This is a Decision represent the relation between Investment in Differentiation and customer's adaption rate.
Recent_Adaptors(t) = Recent_Adaptors(t - dt) + (Change_in__Recent_Adaptors) * dt INIT Recent_Adaptors = 200 UNITS: customers (customer) DOCUMENT: This variable represent the recent obtained in adaptors Units = Customers Initial Value = 200 Customers INFLOWS: Change_in__Recent_Adaptors = (Customers.AdaptorsRecent_Adaptors)/ Time_to_change_RA UNITS: customer/mo DOCUMENT: This Variable represent the change in irecent obtained adaptors Units = Customer/ month Diffrentiation_Effect_on_Adoption = Refrence_Diffrentiation_Effect_on_Adoption* Effect_of_Investment_in__Diffrentiation_on_Adoption UNITS: 1/month (1/mo) DOCUMENT: This Variable represent the effect of Investment in Differentiation on Adoption Rate 48
Units = 1/month
49
Refrence_Diffrentiation_Effect_on_Adoption = .3 UNITS: 1/month (1/mo) DOCUMENT: This Variable represent a refrece value for the effect of Investment in Differentiation on Adoption Rate Units = 1/month This variable were standardized at .3 Return_from__New_Customers = Revenue__per_Adapror*Recent_Adaptors UNITS: US dollars per month (USD/mo) DOCUMENT: This Variable represent the marginal revenue generated as a result of changing investment in differentiation Units = USD / Month Revenue__per_Adapror = Financial__Performance.Recent__Revenue/ Customers.Adaptors UNITS: US Dollars/customer-mo (USD/customer-mo) DOCUMENT: This Variable represents the average revenue achieved per customer. Units = USD/ Customer-month ROI_from_Adoption = Return_from__New_Customers/change_in_investment UNITS: Unitless DOCUMENT: This Variable Represent the Marginal r e t u r n on in vestment in D i f f r e n t i a t i o n . U n i t s = 50
U n i t l e s s Time_to_change_RA = 1 UNITS: months (mo) DOCUMENT: This Variable represents the review time interval Units= Month This Variable is standarized on the level of 1 Month. Effect_of_Investment_in__Diffrentiation_on _Adoption = GRAPH(Level_of_Investment_in_Product_ Diffrentiation/ Refrence__Investment_Trend) (0.00, 0.5), (0.2, 0.5), (0.4, 0.58), (0.6, 0.665), (0.8, 0.72), (1.00, 1.00), (1.20, 1.06), (1.40, 1.08), (1.60, 1.13), (1.80, 1.50), (2.00, 1.50) UNITS: Unitless DOCUMENT: This variable represents graphically the Effect of Investing In Diffrentiation on Customers Adoption Rate. This variable constrains the effect of Differentiation to realistic levels by smoothing the maximum and minimum effect of the Differentiation on adoption rate. Units = Unitless F(-∞)= .5. F(1)=1, F(∞) = 1.5
Diffrentiation.Product Diffusion Effect:DOCUMENT: This the effect of market saturation on Average level of consumption
51
Variable
represent
Markert_Evolution = Customers.Adaptors/Customers.Total__Population UNITS: Unitless DOCUMENT: This Variable represent the current level of market evolution be indication the percentage of current adaptors to the total population. Units = Unitless Effect_of_Adoption__Stage_on_Consumption = GRAPH(Markert_Evolution) (0.00, 0.987), (0.03, 0.707), (0.06, 0.591), (0.09, 0.48), (0.12, 0.395), (0.15, 0.324), (0.18, 0.271), (0.21, 0.218), (0.24, 0.164), (0.27, 0.111), (0.3, 0.111) UNITS: Unitless DOCUMENT: This variable represent graphically the relation between Current Stage in product diffusion and average customers consumption , the purpose of using this variable is to represent the inverse relation between market evolution and customer consumption Units = Unitless F(0) = 1 F(∞) = 0
52
9. Product Development Submodule This Submodule represents dynamics of overcoming market saturation by new product development.
Market_Size(t) = Market_Size(t - dt) + (Serve New_Segment Leave_Segment) * dt INIT Market_Size = 67000 UNITS: unit/mo DOCUMENT: This Variable represents the current markt size of currently covered segments Units = Units/ Month 53
Intial Value = 67000 Units per Month INFLOWS: Serve__New_Segment = NPD*New_Product__Demand UNITS: unit/mo^2 DOCUMENT: This variable represent the rate at which firm serve new segments as a result of developing new products Units = Units/month^2 OUTFLOWS: Leave_Segment = Product_Outdate*Average_Demand_per_Product UNITS: unit/mo^2 DOCUMENT: This variable represent the rate at which firm loose served segments as a result of current product termination. Units = Units/month^2 Products(t) = Products(t - dt) + (NPD - Product_Outdate) * dt INIT Products = 1 UNITS: products DOCUMENT: This Variable represent the number of current products U n i t s = P r o d u c t s I n i t i a l = 1 p r o 54
d u c t I N F L O W S : NPD = CONTENTS OF OVEN AFTER COOK TIME, ZERO OTHERWISE !COOK TIME = Time_for_RnD UNITS: Products/months (Products/mo) DOCUMENT: This Variable represent the rate at which Research and Development deliver new products Units = Products/ Month OUTFLOWS: Product_Outdate = Delay(NPD,Time_to_outdate) UNITS: Products/months (Products/mo) DOCUMENT: This Variable represents the rate at which Product terminated as a result of outdating Units = Products/ Month
55
RnD(t) = RnD(t - dt) + (Intiate_RnD_Job - NPD) * dt INIT RnD = 1 !COOK TIME = varies !CAPACITY = 1 ! F I L L T I M E = D T U N I T S : p r o d u c t s DOCUMENT: This Variable represents the current products in research and development phase. This Variable Assume Maximum Capacity of 1 product at a time. Units = Products Initial 1 INFLOWS: Intiate_RnD_Job = Products_Gap/Time_to_identify_Unmet_Need UNITS: Products/months (Products/mo) DOCUMENT: This Variable represent the rate at which entrepreneur intiate new New Product Research and Development Units = Products/ Month OUTFLOWS: 56
NPD = CONTENTS OF OVEN AFTER COOK TIME, ZERO OTHERWISE !COOK TIME = Time_for_RnD UNITS: Products/months (Products/mo) DOCUMENT: This Variable represent the rate at which Research and Development deliver new products Units = Products/ Month Average_Demand_per_Product = Market_Size/Products UNITS: units/products-months (unit/products-mo) DOCUMENT: This variable represent the average demand per new product Units = Units/product-month Demand_by_Customer = Market_Size/Customers.Total__Population UNITS: units/customers-months (unit/customer-mo) DOCUMENT: This Variable represent the average demand per customer from all products Units = Units/Customer-Month Market_Share = Sales.Sales__Fulfillment_Rate/Market_Size UNITS: Unitless DOCUMENT: This Variable represent the current market share of the firm Units = Unitless New_Product__Demand = Refreence_New__Product_Demand* effect_of_number_of_product_on_new_product_ demand UNITS: units/products-months (unit/products-mo) DOCUMENT: This Variable represent the Marginal Demand achieved from developing new product. Units = Units/Product-Month
57
Products_Gap = Target_Products-Products UNITS: products DOCUMENT: This variable represent the gap between target number of products and current products Unts = products Refreence_New__Product_Demand = 67000 UNITS: units/products-months (unit/products-mo) DOCUMENT: This Variable represent a reference value for the Marginal Demand achieved from developing new product. Units = Units/Products-Month Refrence_Market_Share = init(Market_Share) UNITS: Unitless DOCUMENT: This Variable represent a reference value for market share of the firm Units = Unitless Refrence_Time_to_Identify_Unment_Need = 12 UNITS: months (mo) DOCUMENT: This variable represent a reference value for the time entrepreneur spend to identify new market opportunity. Units = Months This variable is standardized at the level of 12 months Refrence__Products = init(Products) UNITS: products DOCUMENT: This Variable represent a reference number of products Units = Products Intial = 1 product Target_ Products = 5 UNITS: products DOCUMENT: This variable represents the number of targeted products. Units = Product This variable is standardized at 5 products, assuming entrepreneur believe 5 products is thee optimum level in the market Time_f or_Rn D = 12 UNITS: months (mo) DOCUMENT: This variable represent the current time needed from Research and Development team to develop new product Units = month 58
This variable is standardized at the level of 12 Months Time_to_identify_Unmet_Need = Refrence_Time_to_Identify_Unment_Need* Effect_of_Market_Saturation_on_Identifying__Unmet_Need UNITS: months (mo) DOCUMENT: This variable represent the time entrepreneur spend to identify new market opportunity, for example identifying unmet need in certain segment. Units = Months
59
Time_to_outd ate = 60 UNITS: months (mo) DOCUMENT: This product represent the lifespan of the products before it outdate Units = Months This variable is standardized at 60 months Effect_of_Market_Saturation_on_Identifying__Unmet_Need = GRAPH(Market_Share/ Refrence_Market_Share) (0.00, 1.50), (0.125, 1.50), (0.25, 1.36), (0.375, 1.27), (0.5, 1.16), (0.625, 1.11), (0.75, 1.04), (0.875, 1.01), (1.00, 1.00), (1.12, 0.8), (1.25, 0.665), (1.38, 0.59), (1.50, 0.535), (1.62, 0.52), (1.75, 0.52), (1.88, 0.5), (2.00, 0.5) UNITS: Unitless DOCUMENT: This variable represent graphically the effect of market saturation on entrepreneur ability to identify unmet need Units = Unitless F(-∞)= 1.5. F(1)=1, F(∞) = .5 effect_of_number_of_product_on_new_product_demand = GRAPH(Products/ Refrence__Products) (1.00, 1.50), (1.40, 1.50), (1.80, 1.27), (2.20, 1.19), (2.60, 1.10), (3.00, 1.00), (3.40, 0.73), (3.80, 0.64), (4.20, 0.535), (4.60, 0.5), (5.00, 0.5) UNITS: Unitless DOCUMENT: This variable represent graphically the inverse relation between number of products already launched and the opportunity to achieve demand from launching new product. This variable constrain the effect of launching new product to a realistic levels by smoothing the maximum and minimum effect of new product developing on achieving demand. Units = Unitless F(-∞)= 1.5. F(1)=1, F(∞) = .5
60