Int. J. Data Mining, Modelling and Management, Vol. 1, No. 1, 2008
Completing missing views for multiple sources of web media Shankara Subramanya, Zheshen Wang, Baoxin Li* and Huan Liu Department of Computer Science and Engineering, Arizona State University, Tempe, AZ-85287, USA Fax: 480-965-2751 E-mail:
[email protected] E-mail:
[email protected] E-mail:
[email protected] E-mail:
[email protected] *Corresponding author Abstract: Combining multiple data sources, each with its own features, to achieve optimal inference has received a lot of attention in recent years. In inference from multiple data sources, each source can be thought of as providing one view of the underlying object. In general, different views may provide complementary information for the inference task. However, often not all the views are available all the time for the available instances in an application. In this paper, we propose a view completion approach based on canonical correlation analysis that heuristically predicts the missing views and further ranks all within-view features, through learning the intrinsic correlation among the views from training set. We evaluate our approach and compare it with existing approaches in the literature, using web page classification and photo tag recommendation as case studies. Experiments demonstrate the improved performance of the proposed approach. The results suggest that the work has great potential for inference problems with multiple information sources. Keywords: canonical correlation analysis; CCA; view completion; feature selection. Reference to this paper should be made as follows: Subramanya, S., Wang, Z., Li, B. and Liu, H. (2008) ‘Completing missing views for multiple sources of web media’, Int. J. Data Mining, Modelling and Management, Vol. 1, No. 1, pp.23–44. Biographical notes: Shankara B. Subramanya obtained his MSc in Computer Science and Engineering at Arizona State University. He currently works at Amazon.com. His research interests include data mining, machine learning, information retrieval and social computing. Zheshen Wang received her BS and MS in Computer Science from Xiamen University, China, in 2003 and 2006 respectively. She is currently a PhD student in Computer Science Department at Arizona State University. Her research interests include image/video processing, pattern recognition and computer vision.
Copyright © 2008 Inderscience Enterprises Ltd.
23
24
S. Subramanya et al. Baoxin Li received his PhD in Electrical Engineering from University of Maryland, College Park. He is currently an Assistant Professor of Computer Science and Engineering in the Arizona State University. He was previously a Senior Researcher with SHARP Laboratories of America, where he was the Technical Lead in developing SHARP’s Hi-Impact SportsTM technologies. He was an Adjunct Faculty Member with the Portland State University from 2003 to 2004. His research interests include pattern recognition, computer vision, multimedia processing and statistical methods in visual computing. Huan Liu is an Associate Professor of Computer Science and Engineering at Arizona State University. He obtained his PhD from University of Southern California. He worked and taught at Telecom Australia Research Labs and National University of Singapore before joining ASU. His research interests include data mining, machine learning, feature selection, web analytics, social computing and solving challenging real-world problems. His research is supported by NSF, NASA, AFOSR, ONR among others. He can be reached at http://www.public.asu.edu/~huanliu.
1
Introduction
Many applications acquire and process information/data from multiple sources. Research has shown that using multiple information sources is significantly better than using a single information source. In the application of battlefield surveillance, for example, information from infrared sensors, video feeds and laser range finder jointly describes the status of the target. Making use of data from multiple information sources is beneficial as it enables at least the following two inference tasks: 1
making decisions based on fusing complementary information sources
2
predicting missing or contaminated information sources from the available ones.
For example, for web page classification, anchor text, images and body text of a web page can be utilised together in the analysis. Although features from each source can vary, they represent the same underlying web page and hence will in general be semantically related. Consequently, using all these features will result in improved performance in classification. In another example, automatic image annotation (e.g., tag recommendation for online photos), visual contents of an image can be used to generate a set of semantically meaningful annotation terms or tags, based on some learned semantic correlations between image features and text descriptions. In the above examples, the object being observed is characterised by multiple sets of features. Each of the feature sets can be considered as a ‘view’ and each object is characterised by multiple views. In the case where the object is only incompletely characterised by a subset of the views, we call it a missing view problem. This is a common problem in applications with multiple sets of features such as those with multiple information sources. For example, in web page classification, some web pages may not have any body text (e.g., web pages containing images only) and thus missing the ‘body text view’; in the photo tag recommendation example, the text view is deemed as missing for an incoming image without annotations. The problem of missing views is
Completing missing views for multiple sources of web media
25
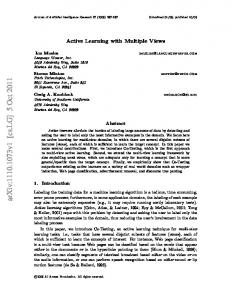
represented schematically in Figure 1, where the term ‘label’ is used to represent any high-level concepts or semantics that bind the multiple information sources. Figure 1
Schematic description – the missing view problem
In this paper, we propose a novel approach to the problem of missing view completion, in which essential semantic correlations among different views are captured through learning from a training set. The learning phase also ranks the features within the same view based on their relative importance or relevance to the high-level semantics. The work is built upon and extends beyond our prior work (Subramanya et al., 2008). In our current design, the learning is based on canonical correlation analysis (CCA), which discovers the latent space that maximises the correlation between any two views of the underlying object. In the test phase, the learnt latent space is used for predicting the missing views. Two specific applications, web page classification and online photo tag recommendation, are used to evaluate the proposed approach. Experimental results demonstrate the effectiveness of the proposed approach in both examples: improved classification accuracy in web page classification and improved tag prediction performance in automatic photo tag recommendation, compared with other state-of-the-art methods. The remaining of the paper is organised as follows. We first review some related work in the literature in Section 2. A short introduction to CCA is given in Section 3. The proposed view completion approach is presented in Section 4, followed by the specific view description schemes used in our experiments (Section 5). Experiments with results and analysis are presented in Section 6. We conclude with a short discussion on future work in Section 7.
26
2
S. Subramanya et al.
Related work
Researchers have devised various ways of combining multiple views to achieve higher accuracy. In Rafkind et al. (2006), text and image views were combined using a fusion SVM classifier. In Agarwal et al. (2006), multiple views of a web page were combined using a density-based method. The method of Zhao and Grosky (2002) combines multiple text and image views of a web page using LSI. All these methods use the fusion of multiple views to achieve higher accuracy. Multiple views have also been used to improve classification performance using co-training (Blum and Mitchell, 1998). Co-training improves classification learning by enforcing internal consistency among predicted classes of unlabeled objects based on different views. The idea behind these methods of combining multiple views is that the views though semantically related and possibly overlapping, provide useful complementary information. The analysis of data with missing values also has for long been a well-studied problem in statistics (Little and Rubin, 1986). Imputation methods like maximum likelihood imputation and median imputation have been recommended to deal with the missing value problem. Mileva-Boshkoska and Stankovski (2007) used SVM and neural networks for predicting missing data. Schafer and Graham (2002) provide a good survey of the methods for dealing with the missing value problem. The authors in Acuna and Rodriguez (2004) evaluate and compare the effect of different imputation methods, which deal with missing values on classification accuracy. All these methods for handling missing values however work with the lower level features. The problem of missing views in a data integration scenario is different from the missing value problem. In the latter, a complete feature set from a particular source would be unavailable. Hence, it would be not only possible but also desirable to deal with higher-level ‘features’ in terms of views. We compare the view completion method with the missing value methods later in Section 6.1. The problem of missing views has been considered previously by Krishnapuram et al. (2005) in an active learning setting. They discussed the problem of deciding which additional features to acquire for an incompletely characterised object in order to improve the performance of the classifier. This approach of active learning is applicable only in the cases where active acquisition of features is possible. However, in many real world scenarios it would be impossible to acquire additional features for some incompletely characterised objects. For example, in an application using sensors, a missing view due to a failed or obstructed sensor would be impossible to acquire at a later stage as all the incoming data would be real time data. If a web page does not have body text, anchor text, or images, then active learning would be of little use since there is no data in the source itself to acquire. So in data fusion, such missed views are usually ignored though the missing views affect the final classification accuracy. View completion can be used as an effective pre-processing step so that further processing such as classification can still benefit from all the views even if some of the views are initially missing. Further, view completion may be used to solve some pattern recognition problems directly. For example, image annotation (Mori et al., 1999; Kolenda et al., 2002; Barnard et al., 2003; Li and Wang, 2006) or photo tag recommendation (Sigurbjornsson and Zwol, 2008) can be modelled as predicting text views based on image views; and inversely, the content-based image retrieval task (Mittal, 2006; Datta et al., 2008) can also be formulated as a view completion problem: using available text
Completing missing views for multiple sources of web media
27
views to predict missing image views. We review some related work in these applications below. Photo tag recommendation is related to automatic image annotation, which has received significant attention in recent years. A large amount of existing literature tried to solve this problem via different methods. Duygulu et al. (2002) modelled annotation as machine translation and Mori et al. (1999) made image annotation by using co-occurrence models. In both work, images are divided into sub-regions and a mapping between keywords and sub-regions are learnt. They are effective for images characterised by some key sub-regions. However, labels which describe an image as a whole, are hard to be predicted by using those methods. A statistical model for image annotation was proposed in Li and Wang (2006), which achieved reasonable accuracy with real-time processing. Like most other image annotation technologies, labels generated by Li and Wang (2006) are mostly based on visual image contents and thus they may not adequately serve as photo tags, which often go beyond simply visual contents. For example, given a Great Wall image, ‘China’ and ‘world heritage’ may be considered as good tags, but they are unlikely to be predicted directly from purely visual features. Sigurbjornsson and Zwol (2008) proposed a tag co-occurrence algorithm for online photo tag recommendation, where they explored the underlying semantic relationships among tags and used it for predicting more tags for a given image with some known tags. One disadvantage is that, the correlation analysis was purely based on text without considering visual features from the images and thus at least one tag has to be present for the method to work.
3
Canonical correlation analysis
CCA attempts to find basis vectors for the two sets of variables such that the correlation between the projections of the variables onto these basis vectors is mutually maximised (Hotelling, 1936). The correlation between the two sets of variables may not be visible in their original coordinate system. CCA finds a linear transformation for two sets variables such that in the transformed space they are maximally correlated. The canonical correlation between any two datasets is defined as
ρ = maxWx ,Wy corr ( Fx ⋅ Wx , Fy ⋅ Wy )
(1)
where Fx and Fy are the two sets of variables and Wx and Wy are the basis vectors onto which Fx and Fy are projected, respectively. The equation for ρ can be rewritten as
ρ = maxWx ,Wy
( Fx ⋅ Wx , Fy ⋅ Wy ) ( Fx ⋅ Wx ⋅ Fy ⋅ W y )
(2)
The problem of finding ρ is therefore an optimisation problem with respect to Wx and Wy. This optimisation problem can be formulated as a standard Eigen problem (Hardoon et al., 2004) which can be easily solved. Since Wx and Wy are always calculated to maximise the correlation of the projections, CCA is independent of the original coordinate system unlike other correlation analysis techniques. There may be more than one canonical correlation, each representing orthogonally separate pattern of relationship between the two sets of variables. The correlation for the successively extracted canonical variates is
28
S. Subramanya et al.
smaller and smaller. When extracting the canonical correlation, the eigenvalues are calculated. The square root of the eigenvalues can be interpreted as the canonical coefficients. Corresponding to each canonical correlation, the canonical weights for each of the variable in the dataset are calculated. The canonical weights represent the unique positive or negative contribution of each variable to the total correlation. CCA has been used previously by researchers to find the semantic relationship between two multimodal inputs. In Hardoon et al. (2004), kernel CCA was used to find correlation between image and text features obtained from a web page and used it for content-based image retrieval. In Vinokourov et al. (2002), CCA is used to find the language independent semantic representation of a text by using the English text and its French translation as two views. When two multidimensional variables represent the two views of the same object, the projections found by CCA can be thought of as capturing the underlying semantics of the object. In other words, we can say that in the semantic feature space, the different views of the object are highly correlated. So, to acquire a missing view of an object, we can select the closest match from the observed views of other objects, such that it has the maximum correlation with the available views of the current object, in the semantic feature space. In the next section, we present the procedure for view completion using CCA.
4
View completion: the proposed approach
In this section, we first define formally the problem of view completion and then propose an algorithm to select the closest matching value for the missing view using the views which are not missing and observed. Furthermore, several within-view ranking methods are discussed in the end.
4.1 Problem formulation We define the multi-source model as follows. Each object is represented by two or more views. For any given object, zero or more views may be missing. But for every object at least one view will be present. We also assume that typically, there is a set of objects that have the class labels and there is a larger set of unlabeled data. Each view is represented by a set of feature vectors. This model is similar to the co-training model; the difference is that in our model some views of the objects are missing. An object with n views can be represented as an (n + 1)-tuple. If f1, f2,…, fn represent the n views and c the corresponding class label, then the instance i is represented as i = ( f1 , f 2 ,..., f n , c)
(3)
Specifically, an object instance with two views can be represented as a 3-tuple. If X and Y represent feature sets corresponding to two different views of an object, an instance i is defined as follows. i = ( x, y, c), where x ∈ X , y ∈ Y
(4)
Here, x ∈ X is a vector corresponding to features from the first source, y ∈ Y is a vector corresponding to features from the second source and c is the class label. Either one of x or y can be ∅ .
Completing missing views for multiple sources of web media
29
Let Xp and Yp represent the feature sets corresponding to those instances, which have features from both the views present. Let Xym ∈ X be the set of features corresponding to instances which have the other view missing, i.e., the corresponding Yym = Ø. Let Iym be the set of all such instances. Our goal is now to find for each of such instances, the view yym ∈ Yym using the available view xym ∈ Xym and the paired views from other instances Xp and Yp. Similarly, let Ixm represent the instances with the first view missing. Let Xxm = Ø and Yxm ∈ Y represent the two views of these instances. We can then find xxm ∈ Xxm using yxm ∈ Yxm, Xp and Yp. To accomplish this, we develop a method of view completion, which heuristically predicts the missing view(s) of the objects. Since this method uses only the available views and not the class label, it can be used on both the labeled and unlabeled data. To predict the missing view from the view, which is available, we first need to find the semantic relationship between the views. To find this semantic relationship, we use the statistical technique of CCA.
4.2 Missing view completion Let CCA(p, q) denote the CCA of vectors p and q, which gives the basis vectors and the projections of p and q on the basis vectors. The basis vectors can be considered as representing the lower dimensional semantic feature space, which captures the underlying semantics of the object. Therefore, to find yym we can select yp ∈ Yp, which has the highest correlation with xym in the lower dimensional semantic feature space. Using these notations, the procedure for the view completion is as follows. 1
Perform the CCA between Xp and Yp and find the basis vectors. [ A, B, U , V ] = CCA( X p , Y p )
(5)
U and V are the matrices where the columns represent the basis vectors corresponding to Xp and Yp, respectively; A and B are the projection of Xp and Yp onto U and V, respectively. 2
For each instance i ∈ Iym, i = (xym, yym, c), where xym ∈ Xym and yym ∈ Yym. Project each yp ∈ Yp onto V and the feature set xym onto U p = y p × Vk
(6)
q = x ym × U k
(7)
where Uk and Vk are obtained by selecting top k basis vectors from U and V respectively. 3
The Pearson correlation cor between p and q is then calculated as cor = correlation( p, q )
4
Select yp with the maximum value for cor as ymax. Set yym = ymax and update the instance i = (xym, ymax, c).
5
Repeat the procedure to find missing feature values for xxm for instances i ∈ Ixm, i = (xym, yym, c).
(8)
30
S. Subramanya et al.
Though the above mentioned procedure is for object instances, which have two views, it can be easily extended to instances with n views, n > 2 by performing a pairwise view completion. For example, in an instance of n views in = (f1, f2,…, fn, c), if, say, f1 is missing in the least number of object instances, then all the other views f2,…, fn could be completed using the above method by performing pairwise comparison with f1.
4.3 Within-view field ranking In the above, we described the problem formulation and the proposed algorithm for view completion. As shown in Section 4.2, view completion is achieved by finding in the training set the instance ‘closest’ to the missing view and using this view for the given instance. However, the obtained correlation is on the instance level and thus is not sufficient for some applications such as in photo tag recommendation, which can be modelled as completing the text view based on the image. With instance level correlation, we can only adopt an exactly same set of tags from the most similar image in the training set. Obviously, this is not desirable. Customised tags can be generated if the ranking of all the fields in the view is available (‘field’ is defined as one dimension in a view.) We call this step ‘within-view field ranking’. To this end, we propose to combine the instance level correlation obtained above and input-independent field ranking (to be discussed below) to form the final, input-dependent field ranking for each field, as follows:
R f j = corrI f × s f j
(9)
j
where f1 is a specific field; I f j denotes the instance that fj belongs to and corrI f is the j
correlation between this instance and the input instance; s f j is the input independent ranking score of field fj and R f j is its final ranking score. The ranking is then utilised in tag prediction. Several specific ranking schemes are proposed below and applied in our experiments of image tag recommendation. Details of the experiments and results will be presented in Section 6.2.
4.3.1 Raw ranking A naive way for ranking the fields in a view is using their original order. For example, in the image tag recommendation problem, for a given image, we list all tags of top-k closest images, one tag set after another by following the descend order of image correlations. Within a tag set, the order used in the original image is kept, assuming that the original user who tagged the image intuitively ordered them based on their importance or relevance. Then, top-n tags can be output as the recommended tags. In this way, there is no separate input independent ranking score for each field. The final ranking score is based on image ranking and their natural inner order. In this case, tag recommendation performance would depend on the accuracy of instance level similarities and the tagging quality of the top instances.
4.3.2 Field-score ranking In building up a view, a field selection procedure may be used in order to limit the dimensionality. For example, for bag-of-word based text view, not all words but only a
Completing missing views for multiple sources of web media
31
limited number of keywords are kept for creating a view for a document. In this paper, we use the TFICF algorithm for selecting keywords (see Section 5.1). The TFICF score for each term essentially indicates the importance of that term in the training set for representing a category. In the test stage, it is reasonable to give priorities to those terms with high TFICF scores: s f j = scoreTFICF fj
(10)
The field score can be different if an alternative keyword selection algorithm is used or a totally different field selection scheme is employed.
4.3.3 Vector-distance ranking In Step 2 of Section 4.2, we project the raw view vectors of the complete training instance onto one CCA basis Vk and project the view vector of the given instance onto another CCA basis Uk. In equation (6), yp is an n1 × n2 matrix, in which n1 is the number of instances and n2 is the number of fields. After the projection onto Vk, we get p, which is n1 × n3 in size. We model the contributions of each column in yp to p as the minimum distance of that column vector to one column vector in p: arg min dist (v j , vr′ )
(11)
r =1...n3
where the distance between the two vectors is defined by the angle between them: dist (v1 , v2 ) = arccos(
v1 ⋅ v2 ) | v1 | ⋅ | v2 |
(12)
We may interpret this formulation as follows (see also Figure 2 for illustration): the smaller the distance of a field (a column in yp) to p, the more contribution it makes to the projected matrix p and the higher rank it should receive than other fields. The ranking score based on this method can be written as s f j = π − arg min(arccos( r =1...n3
v j ⋅ v 'r | v j | ⋅ | v 'r |
(13)
))
All values are normalised to [0, 1] before further processing. Figure 2
An illustration of basis projection (see online version for colours)
yp
p
×
... v1 v2
...
n1 × n2
vn2
Vk n2 × n3
=
... v’1 ... v’n3
n1 × n3
32
5
S. Subramanya et al.
View description
In different domains, the definition for ‘feature’ varies. For example, for image retrieval, image title is one of the most popular features; for object detection, colour and texture are common features; in video-based object tracking, motion speed and directions are useful features. Here, we consider a set of multiple features as a ‘view’, which can be interpreted as a higher-level ‘feature’. Definitions of views are also application dependent. For example, for web page classification, we may have ‘anchor text view’, ‘body text view’, ‘image view’, ‘URL view’, etc., for a web page; for image tag recommendation problem, there can be ‘text view’, ‘image view’ and ‘meta-data view’. Each dimension of a view is called a ‘field’. We describe two common views: text view and image view in the following subsections. These two views are used for our experiments in Section 6.
5.1 Text view In natural language processing (NLP) and text-based information retrieval, bag-of-word is one of the most powerful models for describing text (Lewis, 1998). In a bag-of-word model, text is represented as an unordered collection of words disregarding interpunctions and grammar and typically simplified as a document-term (DT) matrix, in which each entry of the matrix records the appearance frequency of a specific term in a particular document. To avoid dimension explosion and eliminate noises, terms are carefully selected from a dictionary or from the vocabulary of all available documents using feature selection algorithms. In this paper, we use the bag-of-word model for all text-based views in our experiments. Since both of our experiments are category related, we select key words by adopting TFICF algorithm (Agarwal et al., 2006). Stemming (Lovins, 1968) and removing stop words (Microsoft, 2008) steps are taken before TFICF. TFICF (Tk , Ci ) = TF (Tk , Ci ) × ICF (Tk )
(14)
ICF (Tk ) = log(| C | / CF (Tk ))
(15)
where TF(Tk, Ci) refers to term frequency of term Tk in category Ci ; C is the number of categories in the collection and CF(Tk) is the category frequency of term Tk. TFICF essentially ranks each term by achieving high inner-category frequency and low inter-category existence. Top-k terms are used as key words for each category.
5.2 Image view There are various image features available, serving different purposes in pattern recognition and computer vision problems. For image tag recommendation problem, image features are required to be able to describe both global and local visual information. HSV histograms and image gradient from Gabor filtering are commonly used local colour and texture features of an image. In the meantime, spatial pyramid technique (Lazebnik et al., 2006) captures the spatial layout information of the image. In this work, we use spatial-pyramid-based HSV histograms and Gabor gradients as the features. Specifically, given an image, we first divide it into blocks. As shown in
Completing missing views for multiple sources of web media
33
Figure 3, we use three layers with 1, 4 and 16 blocks for each layer respectively. Then, three normalised 8-bin histograms for the HSV channels are computed for each block as the colour feature and 12 gradient energy values from 12 Gabor filters (three orientations with four frequencies) are computed as the texture feature. Gradient energy is calculated by using following equation (Kolenda et al., 2002):
| P |−1
∑
( n , m )∈P
| I f (n, m) |2
(16)
in which If is the convolution of image block I and a Gabor filter G (θ , f ) with specific orientation and frequency. In summary, we have a 756-dimensional feature vector for the image view, including 504-d ((1 + 4 + 16) × 3 × 8) for colour and 252-d ((1 + 4 + 16) × 12) for texture. Both colour features and textures are normalised to [0, 1] respectively before further calculations. Figure 3
An example of image spatial pyramid (see online version for colours)
Layer_0
6
Layer_1
Layer_2
Experiments and results
In order to verify our proposed approach for view completion, we applied them on two different applications: web page classification and photo tag recommendation. In the former application, missing view problem occurs in multiple information sources. SVM-based classification is performed based on view-completed features. In the latter, we model the image tag recommendation as a view completion problem: using the available image view to complete the missing text view. An additional step (field ranking) follows for final tag ranking and recommendation. Details of experiment settings, procedures, results and analysis are presented in the following subsections.
6.1 Experiments of web page classification Procedures in Section 4.2 for view completion were run on the adult website classification dataset used by [3]. The dataset used contains seven different sources of data for classifying a web page. The seven sources obtained based on the HTML tags of the web pages are BODY, Anchor Text and HREF (A), Image and ALT (Img), TITLE, METADATA, TABLE, Webpage URL (URL).
6.1.1 Experiment with different numbers of features We evaluated the classification accuracy on the original dataset with and without view completion. The experiments were performed on the following four cases.
34
S. Subramanya et al.
1
Body text view alone: In this setting only body text view was used for classification. For the completion of body text view, the anchor text view was used.
2
Anchor text view alone: In this setting only anchor text view was used for classification. For the completion of anchor text view, the body text view was used.
3
Anchor text and body text features: In this setting, both body and anchor text views were used for classification. And each of those views was used for the completion of the other.
4
All seven views: In this setting, all the seven views were used for classification. The anchor view was used for the completion of all the other views except URL.
URL was present for all the web pages and hence did not need to be completed. The completion for anchor view was done using body view. Body and anchor views were selected among the seven views for the first three experiments, since these two are the most commonly used among the seven views for web page classification and the most intuitive. The anchor view was used for view completion of all the other views since anchor view was missing among least number of object instances except for URL and it is more semantically related to all the other views compared to the URL view. The integration of the multiple views was done using the density-based method proposed by Agarwal et al. (2006). The classifications were done using the SVM classifier with a linear kernel. Table 1 gives the results of the experiment. This experiment is used to show the possibilities of view completion: using only a single view for classification (as given in first two columns) does not give good classification results, but completing them can reduce error rates significantly. Also, there may be scenarios where the multiple views are present only for a small amount of data used for training, but only one single view is present for the rest of the unlabeled data. Table 1
Classification error rate on web dataset
Data sources used
Body
Anchor
Body + anchor
All seven sources
Without view completion
0.38 ± 0.02
0.135 ± 0.017
0.085 ± 0.013
0.065 ± 0.017
With view completion
0.29 ± 0.027
0.135 ± 0.017
0.07 ± 0.016
0.055 ± 0.016
In the first column, we see that after view completion, the error rate for classification using body view has reduced by 9% with view completion. When anchor view was used, there was no change in the error rates. This was not surprising as the number of instances with anchor view missing was less in the beginning itself. So there was no additional gain with view completion. When both body and anchor views were used for classification, a gain of 1.5% in accuracy was observed. Finally, when all the seven sources were used for classification, we observed that the error rate reduced by 1% and the accuracy increased from 93% to 94%. In all the above cases, the number of basis vectors was fixed to get the least error rates as described below.
6.1.2 Effect of numbers of basis vectors In this experiment, the number of basis vectors was varied as mentioned in Step 2 of Section 4. The effect of numbers of basis vectors on view completion was tested with
Completing missing views for multiple sources of web media
35
different numbers of basis vectors. The experiment was carried out using the body view + anchor view setting. The results are presented in the Table 2 and Figure 4. We see that the least error rate was obtained with k = 50. Figure 4
Table 2
Effect of number of basis vectors (see online version for colours)
Effect of number of basis vectors
Number of basis vector
Error rates
10
0.07 ± 0.0186
20
0.075 ± 0.0112
30
0.05 ± 0.0129
40
0.055 ± 0.0138
50
0.045 ± 0.0117
60
0.055 ± 0.0138
70
0.05 ± 0.0129
83
0.06 ± 0.0145
6.1.3 Effect of missing views In the third part of the experiment, the number of instances with missing views in anchor text view was incrementally increased and the classification accuracy was evaluated. Since the anchor text and body text features are represented by term counts, if any of the views were missing, the term counts for that particular instance would be zero. So to get an additional mi instance with missing anchor text view, we randomly select mi instances which have anchor text view and then set the vector corresponding to anchor text view to zero. Table 3 and Figure 5 give the results of the experiment. From the results, we can see that over the whole range of instances with missing views applying view completion gives a consistently better classification accuracy compared to having no view completion at all. The figure also shows the results of KNN imputation, Mean imputation and EM imputation. These imputation methods consider each missing value individually and substitute a value for it. From the figure, it is clear that view completion, which
36
S. Subramanya et al.
addresses the problem at a higher level in terms of views rather than at a lower level in terms of values, performs much better than the other methods. Figure 5
Effect of missing views (see online version for colours)
Table 3 Number of instances missing anchor view
Web page classification error rate – varying number of instances with missing views Error rate No view completion
With view completion
KNN imputation
Mean imputation
EM imputation
13
0.085 ± 0.013
0.045 ± 0.012
0.08 ± 0.015
0.175 ± 0.028
0.49 ± 0.013
20
0.105 ± 0.019
0.07 ± 0.0152
0.085 ± 0.015
0.26 ± 0.058
0.49 ± 0.013
30
0.12 ± 0.019
0.075 ± 0.017
0.455 ± 0.051
0.235 ± 0.056
0.49 ± 0.013
40
0.16 ± 0.014
0.145 ± 0.028
0.465 ± 0.044
0.22 ± 0.027
0.49 ± 0.013
50
0.185 ± 0.026
0.125 ± 0.029
0.46 ± 0.052
0.225 ± 0.054
0.5 ± 0.033
60
0.21 ± 0.026
0.185 ± 0.018
0.415 ± 0.05
0.24 ± 0.031
0.5 ± 0.033
70
0.405 ± 0.033
0.265 ± 0.039
0.465 ± 0.044
0.25 ± 0.035
0.5 ± 0.033
80
0.31 ± 0.047
0.235 ± 0.029
0.465 ± 0.044
0.325 ± 0.039
0.5 ± 0.033
90
0.37 ± 0.03
0.275 ± 0.038
0.405 ± 0.051
0.315 ± 0.04
0.5 ± 0.033
105
0.37 ± 0.05
0.29 ± 0.026
0.375 ± 0.052
0.305 ± 0.037
0.5 ± 0.033
150
0.385 ± 0.049
0.31 ± 0.029
0.36 ± 0.043
0.32 ± 0.034
0.5 ± 0.033
6.2 Experiments of tag recommendation for Flickr photo Online services for personal digital photo archiving and sharing such as Yahoo Flickr (www.flickr.com) and Google Picasa (picasa.google.com) have become more and more
Completing missing views for multiple sources of web media
37
popular in recent years. Users may annotate their photos by tags, which are typically keywords or phrases describing the content, context or other related information (Sigurbjornsson and Zwol, 2008) and further use them for photo management (e.g., create subject specific sets or collections in Flickr), photo retrieval and sharing with family, friends and various online communities. Tag recommendation systems target at assisting users to come up with good tags (descriptive for the contents and effective for managements). It is related to the image annotation problem (Li and Wang, 2006) but slightly different in terms of the semantic relationship of visual contents and the expected text descriptions. Thus, existing content-based image analysis literature (e.g., Kolenda et al., 2002; Barnard et al., 2003; Li and Wang, 2006) are not adequate for generating such tags. In this study, we model this problem as a view completion problem. For each image, there are two views: text view and image view, but the text view is considered as missing. The essential idea is to explore the underlying semantic correlation among both text features (e.g., keywords) and image features (e.g., colour features and texture features) through CCA and make tag recommendations based on both sources of information.
6.2.1 Data collection and preparation According to statistical data from a Yahoo research (Sigurbjornsson and Zwol, 2008), the most frequent classes of tags for Yahoo Flickr photos are ‘locations’, ‘artifacts/objects’, ‘people/groups’ and ‘actions/events’. We selected two popular topics for each class except ‘people/groups’ (which will be included in future study due to its complexity). Specifically, we picked ‘office’ and ‘stadium’ as ‘location’, ‘pyramid’ and ‘Great Wall’ for ‘artifacts/objects’ and ‘skiing’ and ‘sunset’ ‘for actions/events’. For each topic, we collected 300 images from Flickr using the FlickrAPI tool. In order to mitigate user bias (images from the same user are visually very similar in many cases), we collected no more than 15 images from the same Flickr ID. For each topic, 200 images were used for training and 100 images for testing. The training and testing sets were defined by random selections. Some sample images with user provided tags are shown in the Appendix. It is worth pointing out that we used real online data rather than expert annotated data from some existing image database since real data from actual users serve our application better than those image databases which were created for image classification or annotation purposes rather than for photo tag recommendation. Obviously, real online data is more challenging than research databases (e.g., the databases used in Li and Wang, 2006) due to the varying sources of images and the uncontrollable usage of vocabulary in the tags provided by the users.
6.2.2 Tag recommendation by view completion For the training images, after some data cleaning steps, including stemming, removing stop words and unique user filtering (in counting term frequencies, if one term appears in more than one document from the same user, it can only be counted once ), the TFICF algorithm is applied for selecting keywords and further for creating a DT matrix as their text views. As discussed in Section 5.2, a 756-d feature vector including colour features and texture feature is also extracted for image views. Then, we follow the procedures in Section 4.2 for CCA training. In the test phase, for a given image, the image view is first extracted in the same way as that for the training images. Similar to what done in the web page classification
38
S. Subramanya et al.
application, we find out top-k images in the training set that are closest to the given image. In our experiment, we keep tags from top ten images and further rank them by using the methods proposed in Section 4.3. For each test image, we keep the top 15 tags as the recommended tags.
6.2.3 Evaluation metrics Both objective and subjective evaluations have been performed for evaluating our methods. The protocols of the experiments are defined below.
•
Objective evaluation: We compare the recommended tags generated by our approach to the tags provided by the original owner of the photos. If one of the user tags is among the recommended tag list, we call it a ‘hit’. And we use ≥k-HitRate for showing the performance. ≥k-HitRate: the percentage of images out of all test images which achieve ≥k hit.
•
Subjective evaluation: Six evaluators were given both the test images and the corresponding recommended tags. They were asked to check the images and mark on those tags which they deem as semantically relevant. In addition to ≥k-HitRate, we also adopted the following statistical metrics from Sigurbjornsson and Zwol (2008) for evaluating the performance:
•
Mean reciprocal rank (MRR): MRR measures where in the ranking the first relevant tag occurs. This measure provides insight in the ability of the system to return a relevant tag at the top of the ranking.
•
Success at rank k (S@k): S@k is defined as the probability of finding a relevant tag among the top k recommended tags.
•
Precision at rank k (P@k): P@k is defined as the proportion of retrieved tags that is relevant, averaged over all photos.
6.2.4 Results and analysis In order to avoid data selection bias, we run ten trials with random selections for the training and test set. All experiments are based on these ten trials from the dataset. Figure 6 and Table 4 show the result of objective evaluation of tag recommendation on the test set by using three different ranking schemes (discussed in Section 4.3). For k = 1 and 2 cases, all of them achieve a hit rate around 80% and 60% respectively. These results show that our CCA-based view completion indeed captures the underlying semantic correlations between the available image view and the missing text view to some extent. Comparing three within-field ranking methods, we can see that on average, performance of vector-distance ranking is better than raw ranking and field-score ranking achieves the best among all three on average and for all k = 1 and 2 cases and some cases of k = 3.
Completing missing views for multiple sources of web media Figure 6
39
Comparisons of ≥k-HitRate between different field ranking methods based on objective evaluations (see online version for colours)
k=1 k=2
k=3
Notes: red star: field-score ranking green circle: raw ranking blue triangles: vector-distance ranking Table 4
Objective comparison among different field ranking methods on a fixed random set
≥k-HitRate (%)
k=1
k=2
k=3
Raw ranking
78.9
59.1
33.9
Vector-distance ranking
80.3
58.6
31.6
Field-score ranking
84.5
63.1
34.4
Average over ten fixed random rounds
Note that, there is no objective evaluation reported in Sigurbjornsson and Zwol 2008). Compared to the results reported in Li and Wang (2006), our hit rates are lower. The major reason is that our data are much more challenging than those used in Li and Wang (2006) in terms of the high sparsity of tag occurrence. For each selected topic, only a few words appear more than five times in the user-provided tags for all the training images. This also explains the reason that the rate becomes much lower when k is increased to 2 and 3. However, such objective evaluation is not able to sufficiently evaluate the real performance, since many recommended tags are actually good choices for tagging the image although the original user did not use them. If users are offered those recommended tags, it is possible that much more listed tags would be selected. This is exactly what our tag recommendation system targets at. Therefore, a subjective evaluation is performed as well. Six evaluators participated in this evaluation and were asked to tick all relevant tags in the recommended tag list for a given image. In order to avoid evaluator bias, each evaluator evaluates only 2 topics (200 test images) from the same random set, thus we can have two user sets for this random test set. Except the ≥k-HitRate metric, we also employ MRR, S@1-5, P@5, P@10 and P@15 metrics as well. We can see that subjective evaluation results are statistically much better than those of the objective evaluation, which supports our previous argument that, although many generated tags are not listed by the original user, they are good
40
S. Subramanya et al.
recommendations for the given image. Average results under different metrics are listed in Tables 5–8. Table 5
Tag hit rate of subjective evaluation on test set
≥k HitRate (%)
k=1
k=2
k=3
k=4
k=5
Userset1
95.5
84.3
61.2
31.5
16.8
Userset2
96.0
84.3
67.8
52.3
36.3
On one of the ten random sets
Table 6
MRR of subjective evaluation on test set
MRR (we remove the cases in which number of hit tags is 0)
Averaged rank over all test images
Userset1
1.97
Userset2
1.84
Table 7
S@k of subjective evaluation on test set.
S@k (%)
k=1
k=2
k=3
k=4
k=5
Userset1
67.8
82.7
89.5
92.5
94.7
Userset2
69.7
84.2
90.7
93.3
94.7
On one of the ten random sets
Table 8
P@k of subjective evaluation on test set
P@k (%)
k=5
k = 10
k = 15
Userset1
57.9
30.0
20.0
Userset2
67.4
38.5
25.7
On one of the ten random sets
Compared to state-of-art performance in Sigurbjornsson and Zwol (2008), our performance is slightly better than the best cases reported. Further, since in Sigurbjornsson and Zwol (2008), tag recommendation is purely text-based and at least one correct tag from the user is available; while in our experiment, tags are recommended based on pure image without any existing text information, our approach has the unique feature that that no user-provided tag is required for the recommendation. While the purpose of this experiment is to demonstrate our CCA-based view completion algorithm can work on the application of tag recommendation, there are many other aspects can be taken into consideration for further improving the performance. For example, other available information of photos, such as title, description, comments, meta-data, etc., can be added as separated views for making tag recommendations and the top ranking can be obtained by combining the pair-wise top K rankings obtained using these views. In addition, combining tag cooccurrence strategies proposed in Sigurbjornsson and Zwol (2008) is also a promising direction. We will pursue those aspects in our future work.
Completing missing views for multiple sources of web media
7
41
Conclusions
In this paper, we identify the need for studying the problem of missing views in the domain of using multi-source data for integration and prediction. We formally defined the problem of missing views. By dealing with the missing view problem at a higher level in terms of views instead of a lower level representation of features we are able to achieve better results. By using the underlying existing semantic relationship between multiple views, we propose a heuristic algorithm for view completion using CCA, together with approaches for within-view field ranking. Within-view field ranking methods expand the instance level correlation to field level and make our proposed algorithm suitable for applications where field ranks are required. Experiments on the web page classification photo tag recommendation verify the feasibility and effectiveness of the proposed methods. The view completion method can be applied whenever the multiple views representing an instance are correlated. However, in some application domains where the views are completely complementary and orthogonal, or when the views are completely uncorrelated, view completion would not be of much help. Our future work includes extending the algorithm using kernel methods to handle non-linear correlation and developing algorithms to handle non-numeric attributes.
Acknowledgements This work is supported in part by an AFOSR grant (No. FA9550-08-1-0132).
References Acuna, E. and Rodriguez, C. (2004) ‘The treatment of missing values and its effect in the classifier accuracy’, Classification, Clustering and Data Mining Applications, pp.639–648. Agarwal, N., Liu, H. et al. (2006) ‘Blocking objectionable web content by leveraging multiple information sources’, SIGKDD Explor. Newsl, Vol. 8, No. 1, pp.17–26. Barnard, K., Duygulu, P. et al. (2003) ‘Matching words and pictures’, Journal of Machine Learning Research, Vol. 3, pp.1107–1135. Blum, A. and Mitchell, T. (1998) ‘Combining labeled and unlabeled data with co-training’, Workshop on Computational Learning Theory, Morgan Kaufmann Publishers. Datta, R., Joshi, D. et al. (2008) ‘Image retrieval: ideas, influences, and trends of the new age’, ACM Computing Surveys, Article 5, Vol. 40, No. 2. Duygulu, P., Barnard, K. et al. (2002) ‘Object recognition as machine translation: learning a lexicon for a fixed image vocabulary’, European Conference on Computer Vision (ECCV). Hardoon, D.R., Szedmak, S.R. et al. (2004) ‘Canonical correlation analysis: an overview with application to learning methods’, Neural Computation, Vol. 16, No. 12, pp.2639–2664. Hotelling, H. (1936) ‘Relations between two sets of variates’, Biometrika, Vol. 28, pp.312–377. Kolenda, T., Hansen, L.K. et al. (2002) ‘Independent component analysis for understanding multimedia content’, IEEE Workshop on Neural Networks for Signal Processing, XII. Krishnapuram, B., Williams, D. et al. (2005) ‘Active learning of features and labels’, Workshop on learning with multiple views at the 22nd International Conference on Machine Learning (ICML-05).
42
S. Subramanya et al.
Lazebnik, S., Schmid, C. et al. (2006) ‘Beyond bags of features: spatial pyramid matching for recognizing natural scene categories’, IEEE CVPR. Lewis, D. (1998) ‘Naive (Bayes) at forty: the independence assumption in information retrieval’, Proceedings of ECML-98, 10th European Conference on Machine Learning, Chemnitz, DE, Springer Verlag, Heidelberg, DE. Li, J. and Wang, J.Z. (2006) ‘Real-time computerized annotation of pictures’, ACM MM, Santa Barbara, USA. Little, R.J.A. and Rubin, D.B. (1986) Statistical Analysis with Missing Data, John Wiley & Sons, Inc, New York. Lovins, J.B. (1968) ‘Development of a stemming algorithm’, Mechanical Translation and Computational Linguistics, Vol. 11, pp.22–31. Microsoft (2008) ‘Stopwords and stoplists’, SQL Server 2008 Books Online, available at http://technet.microsoft.com/en-us/library/ms142551.aspx. Mileva-Boshkoska, B. and Stankovski, M. (2007) ‘Prediction of missing data for ozone concentrations using support vector machines and radial basis neural networks’, Informatica, Vol. 31, pp.425–430. Mittal, A. (2006) ‘An overview of multimedia content-based retrieval strategies’, Informatica, Vol. 30, pp.347–356. Mori, Y., Takahashi, H. et al. (1999) ‘Image-to-word transformation based on dividing and vector quantizing images with words’, International Workshop on Multimedia Intelligent Storage and Retrieval Management. Rafkind, B., Lee, M. et al. (2006). ‘Exploring text and image features to classify images in bioscience literature’, HLT-NAACL BioNLP Workshop on Linking Natural Language and Biology, New York. Schafer, J.L. and Graham, J.W. (2002) ‘Missing data: our view of the state of the art’, Psychological Methods, Vol. 7, pp.147–177. Sigurbjornsson, B. and Zwol, R.v. (2008) ‘Flickr tag recommendation based on collective knowledge’, ACM WWW2008, Beijing, China. Subramanya, S., Li, B. et al. (2008). ‘Robust Integration of multiple information sources by view completion’, IEEE IRI, Las Vegas, USA. Vinokourov, A., Shawe-Taylor, J. et al. (2002) ‘Inferring a semantic representation of text via cross-language correlation analysis’, NIPS. Zhao, R. and Grosky, W. (2002) ‘Narrowing the semantic gap – improved text-based web document retrieval using visual features’, IEEE Transactions on Multimedia, Vol. 4, No, 2, pp.189–200.
Completing missing views for multiple sources of web media
43
Appendix
Sample images with user-provided tags from Flickr for selected topics (see online version for colours)
Mac MacPro Apple inema30 ergotron office multiplemonitors multimonitor
office furniture
London Emirates Stadium arsenal molenet
ppsnx Germany Deutschland Dortmund bvb borussiadortmund football stadium
Giza Pyramid Cairo Egypt notourists
office UWO lab heal
Yankee stadium
Youmeo new office electric wharf Coventry moving
cska football acab luchenegrgiya match game Moscow Olympic Stadium fans
office interior design
Purdue Oregon football Ross Ade Stadium big ten pac 10
hdr pyramid Egypt clouds
sky pyramid world heritage Cairo Egypt
Caire Cairo Egypt egypte chichenitza tourists Mayan 1755mmf28g nikon d80 China pyramid pyramide Steps Pyramid Mexico travel mutianyu nikond80 merveilledumonde patrimoine Yucatan Kukulcan El Castillo cultures Great Wall
44
S. Subramanya et al.
Sample images with user-provided tags from Flickr for selected topics (continued) (see online version for colours)
China Great Wall China Great Wall
skiing Mt Hutt
sun sunset lamps
wildman921 China greatwall olympics nikond80 sigma1020
skiing sports snow Mt Buller
tipaza gouraya sunset alg ie light painting light
Beijing China Las Lenas ski skiing snow greatwall nikon d80 South America Argentina nikon18200vr
skiing
sunset dark lite dream
Sussex nikond40 sky UK Southeast Seaford Orange sunset coastal
Austria nassfeld cube skiing
sunset beach reflection nflare d80 18135 mm