Apr 16, 2012 - arXiv:1106.2134v3 [physics.soc-ph] 16 Apr 2012. Components in time-varying graphs. Vincenzo Nicosia. Computer Laboratory, University of ...
Components in time-varying graphs Vincenzo Nicosia Computer Laboratory, University of Cambridge, 15 JJ Thomson Av., Cambridge CB3 0FD, UK and Laboratorio sui Sistemi Complessi, Scuola Superiore di Catania, Via Valdisavoia 9, 95123 Catania, Italy
John Tang
arXiv:1106.2134v3 [physics.soc-ph] 16 Apr 2012
Computer Laboratory, University of Cambridge, 15 JJ Thomson Av., Cambridge CB3 0FD, UK
Mirco Musolesi School of Computer Science, University of Birmingham, Edgbaston, Birmingham B15 2TT, UK
Giovanni Russo Dipartimento di Matematica ed Informatica, Universit` a di Catania, Via S. Sofia, 64, 95123 Catania, Italy
Cecilia Mascolo Computer Laboratory, University of Cambridge, 15 JJ Thomson Av., Cambridge CB3 0FD, UK
Vito Latora School of Mathematical Sciences, Queen Mary, University of London, E1 4NS, London, UK Dipartimento di Fisica e Astronomia, Universit` a di Catania and INFN, Via S. Sofia, 64, 95123 Catania, Italy and Laboratorio sui Sistemi Complessi, Scuola Superiore di Catania,Via Valdisavoia 9, 95123 Catania, Italy (Dated: April 17, 2012) Real complex systems are inherently time-varying. Thanks to new communication systems and novel technologies, it is today possible to produce and analyze social and biological networks with detailed information on the time of occurrence and duration of each link. However, standard graph metrics introduced so far in complex network theory are mainly suited for static graphs, i.e., graphs in which the links do not change over time, or graphs built from time-varying systems by aggregating all the links as if they were concurrent in time. In this paper, we extend the notion of connectedness, and the definitions of node and graph components, to the case of time-varying graphs, which are represented as time-ordered sequences of graphs defined over a fixed set of nodes. We show that the problem of finding strongly connected components in a time-varying graph can be mapped into the problem of discovering the maximal-cliques in an opportunely constructed static graph, which we name the affine graph. It is therefore an NP-complete problem. As a practical example, we have performed a temporal component analysis of time-varying graphs constructed from three data sets of human interactions. The results show that taking time into account in the definition of graph components allows to capture important features of real systems. In particular, we observe a large variability in the size of node temporal in- and out-components. This is due to intrinsic fluctuations in the activity patterns of individuals, which cannot be detected by static graph analysis. PACS numbers: 89.75.Hc,89.75.-k,89.75.Fb
Time-varying graphs are a natural model for networked systems in which the relationships among nodes are intrinsically dynamic and fluctuate over time, where links appear and disappear at specific points in time and are often recurrent. Here we extend the concept of connectedness and the definitions of node and graph components to the case of time-varying graphs, we prove that finding strongly connected components in timevarying graphs is an NP-complete problem and we also report the results of component analysis performed on three real time-varying systems. This analysis confirms that the classical aggregate representations of networks evolving over time wash out most of the richness of the original systems. In particular, static graph erroneously flatten down fluctiations in the size of in- and out-
componens of nodes, and tend to substantially overestimate the actual size of the connected components of the graph.
I.
INTRODUCTION
Complex network theory has proved to be a versatile framework to represent and analyze biological, social and man-made complex systems [1, 2]. Typically, a complex system is inherently dynamic. Social interactions and human activities are intermittent [3–6], the neighborhood of individuals moving over a geographic space evolves over time [7–9], links appear and disappear in the World Wide Web [10], in patterns of interactions among genes from microarray experiments [11, 12] and in functional brain networks [13, 14]. In all these networks, time plays
2 a central role: links exist only for certain time periods, and are often recurrent. Despite this fact, most of the classic studies in complex networks theory are based on the analysis of the topological properties of static graphs. These are graphs in which the links do not change over time, or graphs built from time-varying systems as the result of the aggregation of all interactions, as if these were all concurrent in time. The evolution of linking patterns over time, when considered, has been usually studied by creating a series of graphs, each graph containing all the links appeared in a certain time interval. Then, each standard graph metric has been evaluated for the static graph obtained at each time window, and plotted as a function of time [15, 16]. Today, thanks to recent technological developments, for the first time we have the opportunity to study large social and biological networks with precise temporal information on the appearance, duration and frequency of links among a set of nodes. Many other similar databases will be produced in the near future, at an ever increasing rate. These data sets demand for new network measures and models that can take account of the richness introduced by detailed temporal information. Some recent works have analyzed large interconnected systems with fluctuating interactions [17–19], and some graph measures have been already extended to the case of graphs in which connection patterns evolve over time [20]. More recently, some works have also studied the onset of synchronization in populations of agents interacting through time-evolving topologies [21]. In previous works [22–24] it has been shown that a static analysis of aggregated graphs is not able to capture the real dynamic behavior and time correlations of complex networks evolving over time. Since in this type of analysis the temporal ordering of links is ignored, the number of available links at each time is overestimated and, therefore, the actual lengths of walks and paths is underestimated. In particular, it has been found that edge causality plays an important role on the dynamics of many processes that occur on networks, such as disease spreading [25–27]. There have been several attempts to incorporate temporal information in the description of complex networks [25, 28, 29], and different definitions of time-varying graphs have been proposed so far [32–34]. At the same time, some basic concepts of complex network theory, such as temporal walks [30, 31], path length and distance [32–34], centrality [23] have been extended to the case of temporal networks. In this paper, we focus our attention on two important concepts in graph theory, namely those of connectedness and connected components of a graph, and we generalize them to the case of time-varying graphs. These concepts have been thoroughly used to study the reachability of pairs of nodes in static complex networks [35], and to characterize the resilience of networks to attacks [36]. Here we show that node connectedness and connected components play a central role in time-varying graphs, and can reveal interesting details on the real structure of the network, that usually remain hidden to an analysis
based on static graphs. The paper is organized as follows. In Section II, we briefly review the concepts of connectedness and components in static graphs, while in Section III we extend them to the case of time-varying graphs. In particular, we define the temporal in- and out-component of a given node, and we give the definition of weakly and strongly connected components of a graph. In Section IV we show that the problem of finding components in a timevarying graph can be mapped into the maximal-clique problem for an opportunely constructed graph, which we call affine graph. An affine graph is a static graph which incorporates all the information on the temporal reachability of pairs of nodes, and is a useful tool to analyze the components of the corresponding time-varying graph. Thanks to this mapping, we also prove that finding strongly connected components in time-varying graphs is a NP-complete problem. Finally, in Section V we present the results of temporal component analysis on time-varying graphs constructed from three different data sets of human interactions.
II.
COMPONENTS IN STATIC GRAPHS
Let us consider a graph G with N nodes and K links. From now on we will refer to it as to a static graph. We will consider the case of undirected and directed static graphs separately. An undirected static graph G can be represented by a symmetric adjacency matrix, a N × N matrix A whose each entry aij is equal to one if and only if there is a link between i and j, and is equal to zero otherwise. In order to define graph components, we need to introduce the concept of connectedness, first for pairs of nodes, and then for the whole graph. Two nodes i and j of an undirected graph G are said to be connected if there exists a path between i and j. G is said to be connected if all pairs of nodes in G are connected, otherwise it is said to be unconnected or disconnected. A connected component of G associated to node i is the maximal connected induced subgraph containing i, i.e., the subgraph induced by all nodes connected to node i. If an undirected graph is not connected, it is always possible to find a partition of the graph into a set of disjoint connected components. It is straightforward to prove that this partition is unique. A directed static graph G is described in general by a non-symmetric adjacency matrix, a N × N matrix A whose each entry aij is equal to one if and only if there is a directed link from i to j, and is equal to zero otherwise. Defining connectedness for pairs of nodes in a directed graph is more complex than in an undirected graph, because a directed path may exist through the network from vertex i to vertex j, but this does not guarantee that any path from j to i does actually exist. Consequently, we have two different definitions of connectedness between two nodes, namely weak and strong connectedness. In particular, we can define the weakly and the strongly
3 connected components of a directed graph as follows [37]. Two nodes i and j of a directed graph G are said strongly connected if there exists a path from i to j and a path from j to i. A directed graph G is said strongly connected if all pairs of nodes (i, j) are strongly connected. A strongly connected component of G associated to node i is the maximal strongly connected induced subgraph containing node i, i.e., the subgraph induced by all nodes which are strongly connected to node i. A weakly connected component of G is a component of its underlying undirected graph Gu , which is obtained by removing all directions in the edges of G. Two nodes i and j of G are weakly connected if they are connected in Gu , and a directed graph G is said to be weakly connected if the underlying undirected graph Gu is connected. Hence, the components of a directed graph can be of two different types, namely weakly and strongly connected. It is also useful to review the definitions of components associated to a node of a directed graph. We have four different definitions: 1. The out-component of node i, denoted as OUT(i), is the set of vertices j such that there exists a directed path from i to j, ∀j. 2. The in-component of a node i, denoted as IN(i), is the set of vertices j such that there exists a directed path from j to i, ∀j. 3. The weakly connected component of a node i, denoted as WCC(i), is the set of vertices j such that there exists a path from i to j, ∀j in the underlying undirected graph Gu . 4. The strongly connected component of a node i, denoted as SCC(i), is the set of vertices j such that there exists a directed path from i to j and also a directed path from j to i, ∀j. We have implicitly used the last two concepts for the definitions of weakly and strongly connected components of a directed graph given above. In fact, the property of weakly and strongly connectedness between two nodes is reflexive, symmetric and transitive, i.e., in mathematical terms, it is an equivalence relation. Therefore, it is possible to define weakly and strongly connected components of a graph by means of the weakly and strongly connected components associated to its nodes: a strongly (weakly) connected component of a node is also a strongly (weakly) connected component of the whole graph. Conversely, the definitions of out-component and in-component of a node are not based on equivalence relations. In fact, the symmetry property does not yield: i ∈ OUT(j) does not imply j ∈ OUT(i). This means that out- and in-components can be associated only to nodes, and cannot be directly extended to the entire graph. In practice, we cannot partition a graph into a disjoint set of in- or out-components, while it is possible to identify a partition of a static graph into a disjoint set of weakly or strongly connected components. However, the in- and
WCC 2
Tendril
WCC 3
Te n
WCC 4
dr
il
WCC 5
Giant Weakly Connected component (GWCC)
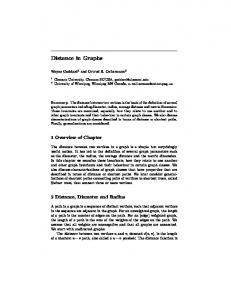
FIG. 1. A directed graph can be partitioned into a set of disjoint weakly connected components (in yellow). Furthermore, each of these components has a rich internal structure, as shown for the GWCC.
out-components of the nodes of a graph can be used to define the strongly connected components of the graph. From the above definitions, we observe that i ∈ OUT(j) if and only if j ∈ IN(i). Furthermore, we notice that i and j are strongly connected if and only if j ∈ OUT(i) and, at the same time, i ∈ OUT(j). Or equivalently, if and only if j ∈ OUT(i) and j ∈ IN(i). Therefore, the strongly connected component of node i is the intersection of IN(i) and OUT(i). We are now ready to describe the rich interplay among the various concepts of connectedness in a directed static graph in detail. In the most general case, as shown in Fig. 1, a directed graph can be decomposed into a set of disjoint weakly connected components. In a large graph, one component will be larger than all the others. This component is usually called the giant weakly connected component GWCC of the graph. If we treat each link in the GWCC as bidirectional, then every node in the GWCC is reachable from every other node in the GWCC. As shown in Fig. 1, the GWCC contains the giant strongly connected component GSCC, consisting of all nodes reachable from each other following directed links. All the nodes reachable from the GSCC are referred to as the giant OUT component, and the nodes from which the GSCC is reachable are referred to as the giant IN component. The GSCC is the intersection of the giant IN- and OUT-components. All nodes in the GWCC, but not in the IN- and OUT-components, are referred to as “tendrils”.
III.
COMPONENTS IN TIME-VARYING GRAPHS
In this paper, we consider time-varying graphs, which are graphs characterized by links that appear and disappear over time among a fixed set of nodes. A timevarying graph can be described as an ordered sequence of graphs, i.e., an ordered set {G1 , G2 , . . . , GM } of M graphs defined over N nodes, where each graph Gm in the sequence represents the state of the network, i.e., the configuration of links, at time tm , where m = 1, . . . , M .
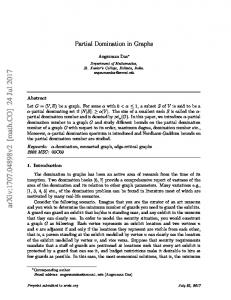
4 In this notation, the quantity tM − t1 is the temporal length of the observation period. The graphs in the sequence can be uniformly distributed over time, i.e., tm+1 = tm + ∆t, ∀m = 1, . . . , M − 1 [33], or in general they can correspond to any ordered sequence of times such that t1 < t2 < . . . < tM [30]. In a more compact notation, we denote the graph sequence as G ≡ G[t1 ,tM ] . Each graph in the sequence can be either undirected or directed. Consequently, the time-varying graph G can be described by means of a time-dependent adjacency matrix A(tm ), m = 1, . . . , M , where aij (tm ) are the entries of the adjacency matrix of the graph at time tm . This matrix is in general non-symmetric. If we discard the time-ordering of the links of a time-varying graph G and consider all links as concurrent in time, we obtain its corresponding aggregated static graph. Different ways of constructing an aggregated graph from a temporal network have been indeed proposed. It is possible to assign a weight to each edge of the aggregated graph, according to the frequency or the strength of the connection, and also to preserve the directionality of edges of the original temporal system. However, all these static representations fail to capture the temporal correlation of links and, consequently, are not able to represent causality relationships. In panel a) of Fig. 2 we report a simple time-varying graph G[t1 ,t4 ] with N = 5 nodes and M = 4 edges and, in panel b), the corresponding aggregated static graph (undirected and unweighted). It is worth noticing that the aggregated graph discards most of the richness of the original time-varying graph. For instance, three paths exist between node 1 and node 5 in the static aggregated graph, namely 1-4-5, 1-2-5 and 1-24-5, while in the time-varying graph there is no temporal path from node 1 to node 5. The problem of defining connectedness and components in time-varying graphs looks more similar to the case of directed static graphs than to the case of undirected static graphs. In fact, even if each graph Gm , m = 1, . . . , M in the sequence is undirected, the temporal ordering of the graphs naturally introduces a directionality. For instance, in the time-varying graph G[t1 ,t4 ] reported in Fig. 2, there exists a path connecting node 5 to node 1 (i.e., the link a52 at time t1 and the link a21 at time t3 ) but there is no path which connects node 1 to node 5. An immediate consequence of this fact is that node 5 can send a message to node 1 at time t1 , while node 1 cannot send a message to node 5. In order to define node connectedness for a timevarying graph, we first need to introduce a mathematical definition of reachability for an ordered pair of nodes i and j. We say that i can reach j if i can send a message to j directly or through a timeordered sequence of contacts. In mathematical terms this implies the existence of a walk connecting i to j. In a time-varying graph, a walk, also called temporal walk, from node i to node j is defined as a sequence of L edges [(nr0 , nr1 ), (nr1 , nr2 ), . . . , (nrL−1 , nrL )], with nr0 ≡ i, nrL ≡ j, and an increasing sequence of times tr1 < tr2 < . . . < trL such that anrl−1 ,nrl (rl ) 6= 0 l =
1
2
3
4
5
1
2
3
4
5
1
2
3
4
5
1
2
3
4
5
t1
t2
t3
t4
(a)
4
5
1
3 2
(b)
FIG. 2. A time-varying graph G consisting of a sequence of M = 4 graphs with N = 5 nodes (panel a) and its corresponding aggregated static graph (panel b). The static representation of graphs discards time ordering of links and time correlations of paths. In the aggregated graph node 1 and node 2 are neighbors, but in the original time-varying graph they are directly connected only in one of the four graphs of the sequence, namely in Gt3 . Moreover, in the aggregated graph a path exists from node 1 to node 5 and vice-versa, while in the time-varying graph there exists a temporal path from 5 to 1 but there are no temporal paths from 1 to 5.
1, . . . , L [30, 33]. A path (also called temporal path) of a time-varying graph is a walk for which each node is visited at most once. For instance, in the time-varying graph of Fig. 2, the sequence of edges [(5, 2), (2, 1)] together with the sequence of times t1 , t3 is a temporal path of the graph. This path starts at node 5 at time t1 and arrives at node 1 at time t3 . Given the definitions of temporal walk and path, we can introduce the concepts of temporal connectedness (in a weak and in a strong sense) for a pair of nodes. A node i of a time-varying graph G[t1 ,tM ] is temporally connected to a node j if there exists in [t1 , tM ] a temporal path going from i to j. This relation is not symmetric: if node i is temporally connected to node j, in general node j can be either temporally connected or disconnected to i. In the graph G[t1 ,t4 ] of Fig. 2, node 5 is temporally connected to 1 but node 1 is not connected to node 5. For
5 this reason, we introduce the definition of strong connectedness, which enforces symmetry: Definition 1 (Strong connectedness) Two nodes i and j of a time-varying graph are strongly connected if i is temporally connected to j and also j is temporally connected to i. Strong connectedness is a reflexive and symmetric relation, so that if i is strongly connected to j, then j is strongly connected to i. However, this definition of strong connectedness lacks transitivity, and, therefore, it is not an equivalence relation. In fact, if i and j are strongly connected and j and l are strongly connected, nothing can be said, in general, about the connectedness of i and l. In the example shown in Fig. 2, node 5 and 2 are strongly connected and also 2 and 1 are strongly connected, but nodes 5 and 1 are not strongly connected, since there exists no temporal path which connects node 1 to node 5. It is also possible to introduce the concept of weak connectedness for a pair of nodes. Similarly to the case of static directed graphs, given a time-varying graph G, we construct the underlying undirected time-varying graph G u , which is obtained from G by discarding the directionality of the links of all the graphs {Gm }, while retaining their time ordering. Definition 2 (Weak connectedness) Two nodes i and j of a time-varying graph are weakly connected if i is temporally connected to j and also j is temporally connected to i in the underlying undirected time-varying graph G u . Also weak connectedness is a reflexive and symmetric relation, but it is not transitive. This definition of weak connectedness is quite similar, but not identical, to that given for directed static graphs. In fact, two nodes in G can be weakly connected even if there is no temporal directed path which connects them, but the temporal ordering of links breaks the transitivity so that if i and j are weakly connected and j and l are weakly connected, then nothing can be said about the weak connectedness of i and l. Notice that the definitions of strong and weak connectedness given above for time-varying graph are consistent with those given for static graphs, so that if two nodes are strongly (weakly) connected in a time-varying graph, then they are also strongly (weakly) connected in the corresponding aggregated static graph. The viceversa is trivially not true. We are now ready to give the definitions of components associated to a node of a time-varying graph G: 1. The temporal out-component of node i, denoted as OUTT (i), is the set of vertices which can be reached from i in the time-varying graph G. 2. The temporal in-component of a node i, denoted as INT (i), is the set of vertices from which i can be reached in the time-varying graph G.
3. The temporal weakly connected component of a node i, denoted as WCCT (i), is the set of vertices which i can reach, and from which i can be reached, in the underlying undirected time-varying graph G u . 4. The temporal strongly connected component of a node i, denoted as SCCT (i), is the set of vertices from which vertex i can be reached, and which can be reached from i, in the time-varying graph G. Differently from the case of directed static graphs, it is not possible to define the strongly (weakly) connected components of a time-varying graph starting from the definition of connectedness for pairs of nodes. As we explained above, this is because the relation of strongly (weakly) connectedness for couples of nodes is not an equivalence relation. For this reason, we give the following definition of strongly connected component of a time-varying graph: Definition 3 (Strongly connected component) A set of nodes of a time-varying graph G is a temporal strongly connected component of G if each node of the set is strongly connected to all the other nodes in the set. Similarly, a set of nodes is a weakly connected component if each node in the set is weakly connected to all the other nodes in the set. The definitions of strongly and weakly connected components enforce transitivity, but the check of strong (weak) connectedness has to be directly performed for every couple of nodes. Let us suppose for instance that we want to verify if the five nodes in the graph G shown in Fig. 2 form a strongly connected component. In the static aggregated graph this check has O(K) computational complexity, where K is the total number of links in the graph. In fact, we have only to check that 2, 3, 4 and 5 are connected to 1, which can be done by a depth first visit of the graph started at node 1, since node connectedness is an equivalence relation for static graphs, and a component of a node is also a component for the whole graph. On the contrary, for a time-varying graph we should check the connectedness of all the possible couples of nodes, so that a procedure to verify that a set of N nodes forms a strongly connected component has computational complexity O(N 2 ) for every check, instead of O(K). Such a difference in computational complexity is relevant for graphs obtained from real world systems, which are usually sparse. Moreover, while static directed graphs admit only one partition into strongly connected components, for a time-varying graph there exists in general more than one possible partition, as we shall see in the next section.
IV.
THE AFFINE GRAPH OF A TIME-VARYING GRAPH
In this section we show that the problem of finding the strongly connected components of a time-varying
6 graph is equivalent to the well-known problem of finding the maximal-cliques of an opportunely constructed static graph [38]. We call such a static graph the affine graph corresponding to the time-varying graph. It is defined as follows:
1
2
3
4
5
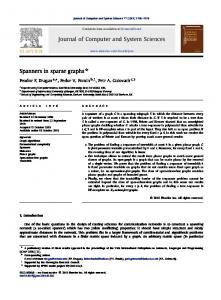
Definition 4 (Affine graph of G) Given a time-varying graph G ≡ G[t1 ,tM ] , the associated affine graph GG is an undirected static graph with the same nodes as G, and such that two nodes i and j are linked in GG if i and j are strongly connected in G. In practice, the affine graph of a time-varying graph can be obtained by computing the temporal shortest paths between any two pairs of nodes, and then adding a link between two nodes i and j of the affine graph only if the temporal distance from i to j and the temporal distance from j to i are both finite. Another method to construct the affine graph is based on the usage of the out-components of all the nodes. We start by considering the out-component of the first node (let us say i = 1) and then we check if for each node j ∈ OU TT (i), j > i then also i ∈ OU TT (j). If this is true, we add a link between i and j in the affine graph. We then repeat this procedure for the second node, i = 2, for the third node, i = 3 and so on. We obtain the affine graph by iterating over the out-components of all the nodes. It is worth noticing that the definition of affine graph is independent from the particular definitions of reachability and temporal path given here, since it is based only on the existence of mutual temporal paths between pairs of nodes. Therefore, given any of the different definitions of time-varying graph and the corresponding notions of walk and path, it is always possible to construct the affine graph associated to that particular representation of the system. We also observe that the concept of affine graph is somehow related to existing concepts of path graphs, reachability graphs and influence digraphs [25, 29]. In fact, in a path graph (or in an influence digraph) a directed link exists from node i to node j if there is a temporal path from i to j, i.e., if it is possible to reach j starting from i. Therefore, we can construct an affine graph from the path graph or from the influence digraph associated to a time-varying graph, by replacing each couple of reciprocated directed links with a single undirected edge, and removing all the remaining links. In Fig. 3 we report the affine graph corresponding to the time varying graph shown in Fig. 2. In this graph, node 1 is directly connected to nodes {2, 3, 4}, since it is temporally strongly connected to them in the timevarying graph. Similarly, node 2 is connected to nodes {1, 3, 4, 5}, node 3 is connected to {1, 2}, node 4 is connected to {1, 2, 5} and node 5 is connected to {2, 4}. Hence, the affine graph GG has only 7 of the 10 possible links, each link representing strong connectedness between two nodes. We briefly report here some definitions about graph cliques. Given an undirected static graph, a clique is a complete subgraph, i.e., a subgraph in which all the nodes
FIG. 3. The affine graph GG associated to the time-varying graph G reported in Fig. 2. The affine graph is static and undirected, and each of its maximal-cliques corresponds to a strongly connected component of the original time-varying graph G.
are directly linked to each other. A maximal-clique is a clique that is not included in any larger clique, while a maximum-clique is a maximal-clique whose size is equal to or larger than those of all the other cliques [39]. By construction, a clique of the affine graph GG , contains nodes which are strongly connected to each other, so that the maximal-cliques of the affine graph, i.e., all the cliques which are not contained in any other clique, are temporal strongly connected components (SCCT ) of G. Similarly, all the maximum-cliques of the affine graph GG , i.e., its largest maximal-cliques, are the largest temporal strongly connected components (LSCCT ) of G. Therefore, the affine graph can be used to study the connectedness of a time-varying graph, and the properties of the strongly connected components of a timevarying graphs can be obtained from known results about maximal-cliques on static graphs. For instance, the problem of finding a partition of G that contains the minimum number of disjoint strongly connected components is equivalent to the well–known problem of finding a partition of the corresponding affine graph GG in the smallest number of disjoint maximal-cliques [38]. Unfortunately, this problem is known to be NP–complete, and in practice can be exactly solved only for small graphs. In the case of the affine graph in Fig. 3, it is possible to check by hand that there are only three possible partitions of GG into maximal-cliques, namely: S 1. {1, 2, 3} {4, 5} S S 2. {1, 2, 4} {3} {5} S 3. {2, 4, 5} {1, 3} Notice that the second partition contains two isolated nodes, which are indeed degenerated maximal-cliques. Therefore, the original time-varying graph admits only two different partitions into a minimal number of nondegenerated strongly connected components, namely into two components containing at least two nodes each. One possible partition of our network G[t1 ,t4 ] is composed of the components {1, 2, 3} and {4, 5}, while the other partition consists of {2, 4, 5} and {1, 3}. If we discard the
7 temporal ordering of links, we obtain different results. In fact, the aggregated static graph shown in Fig. 2 has only one connected component, which includes all the five nodes. Other interesting results stem from the mapping into affine graphs and from the following well known results for cliques in graphs. 1. Checking if a graph contains a clique of a given size k has polynomial computational complexity, and precisely O(N k k 2 ) [40]. 2. The clique decision problem, i.e., the problem of testing whether a graph contains a clique larger than a given size k, is NP–complete [38]. Therefore, any algorithm that verifies if a time-varying graph has a strongly connected component whose size is larger than a fixed value k, has exponential computational complexity. 3. Listing all the maximal-cliques of a graph has exponential computational complexity, namely O(3N/3 ) on a graph with N nodes [41, 42]. Consequently, finding all strongly connected components of a time-varying graph with N nodes, requires an amount of time which exponentially grows with N . 4. The problem of finding a maximum-clique for an undirected graph is known to be hard–to– approximate [43–45], and an algorithm that finds maximum-cliques requires exponential time. This means that, if P 6= N P , there exists no polynomial algorithm to find approximated solutions for the maximum-clique problem. The best known algorithm works in O(∼ 1.2N ) for a graph with N nodes [46, 47]. 5. The problem of determining if a graph can be partitioned into K different cliques is NP–complete, and consequently also the problem of finding the minimum number of cliques that cover a graph, known as the minimum clique cover, is NP–complete [38]. This means that there exists no efficient algorithm to find a partition of a time-varying graph made by a set of disjoint strongly connected components. Moreover, there are in general more than one partition of a graph into maximal-cliques, so that a timevarying graph cannot be uniquely partitioned into a set of disjoint strongly connected components. The existence of a relation between the strongly connected components of a time-varying graph and the maximal-cliques of its affine graph implies that it is practically unfeasible to find all the strongly connected components of large time-varying graphs. The problem can be exactly solved only for relatively small networks, for which it is computationally feasible to enumerate all the maximal-cliques of the corresponding affine graphs. Even if, in many practical cases, it is possible to find only the maximal-cliques up to a certain size k, we can still obtain
some information about the maximum value of k to be checked. First of all, in order to have a clique of size k the graph should have at least k nodes having at least k links. Moreover, each clique of order k > 3 has exactly � k 3 sub–cliques of order 3, so that in order for a subgraph to be a clique of order k, the graph should have at least � k 3 triangles. This means that there is a relation between the number of triangles of the affine graph and the size of its maximum-cliques. In particular, the number of existing triangles in the affine graph sets an upper bound for the size of the largest admissible maximal-cliques of the graph.
V.
RESULTS
In this section we extract and analyze node and graph components of time-varying graphs constructed from three different data sets of temporal social networks. The first is the data set of human interactions produced by the Reality Mining Project [48], which was a large experiment devised and performed by researchers at the MediaLab, Massachusetts Institute of Technology, US. One of the aims of this experiment was to record the contacts among students, staff and faculty members at the Massachusetts Institute of Technology. The resulting data set contains co–location information among 100 individuals during six months, from the end of June 2004 to the end of December 2004, sampled by means of Bluetooth– enabled mobile phones at regular intervals of five minutes. The second data set contains all the contacts among 78 people attending the INFOCOM 2006 conference [49]. Similarly to the Reality Mining data set, also the INFOCOM 2006 dataset has been constructed using records of scans made by Bluetooth devices provided to conference participants, but covers a shorter period of time (only five days). The third data set contains the records of communications among ∼ 100.000 Facebook users living in Santa Barbara (CA), occurred over a period of six months, from January 2009 to June 2009 [50]. In the following we denote the Reality Mining, INFOCOM and Facebook data sets as RM, IC and FB respectively. When contacts are inferred from Bluetooth scans, we make the reasonable assumption that two individuals are co–located, i.e., they are at the same place, at a given time, if their respective devices detect each other presence. In fact, Bluetooth devices are able to detect similar devices within a very limited range, usually between 5 and 10 meters. At each time t, a co–location graph can be obtained by connecting through undirected links all the nodes which are co–located at that time. For the RM and the IC data sets we constructed several time-varying graphs, made of sequences of co–location graphs obtained at regular intervals of 5 minutes. For the dataset of FB communication, the concept of co-location is not meaningful, since the communication is usually asynchronous and mediated by the Internet. In this case, we construct
8 a contact graph for each hour, where a link between two nodes does exist if the nodes have exchanged at least one message in the corresponding interval. We have chosen these three data sets because they represent different typical aspects of temporal social networks. First of all, RM provides a good example of recurrent face-to-face interactions, like those we experience in our everyday life. At the same time, IC is a relevant instance of bursty faceto-face interactions, which are typical in gatherings and meetings. Finally, FB is the prototypal model of on-line communication, which is different from face-to-face interaction because it does not require physical co–location to be facilitated. We start analyzing the distribution of the sizes of the node temporal in- and out- components in RM, by considering time-varying graphs obtained from the first half and the second half of a week. In particular, in Fig. 4 we consider week 11, which roughly corresponds to the beginning of the Fall term. For each node, we report the size 80
Size
60 40 20 0 0 80
a) 20
40
60
80
100
Size
60 40
b)
20 0 0
20
40
60
80
100
Node
FIG. 4. Size of the temporal in-component (panel a) and out-component (panel b) for each of the N = 100 individuals during week 11 of the RM data set. Red circles and blue squares correspond, respectively, to the beginning of the week (WB) and to end of the week (WE). For comparison, the size of the largest connected component of the corresponding aggregated static graph are reported as dashed red line (WB) and solid blue line (WE), respectively.
of its temporal in- and out-component during the beginning of the week (WB), namely from Monday 12:00am to Thursday 11:59am (red circles), and during the end of the week (WE), namely from Thursday 12:00pm to Sunday 11:59pm (blue squares). As shown in the figure, during WB almost all the nodes have temporal in- and out-component of size 72. Conversely, during WE, we observe a wider distribution of the sizes of temporal inand out-components. In particular, in panel (a) we notice a group of nodes having an in-component of size 53, another group whose in-component contains around 40 nodes, and other nodes with in-component of size smaller
than 30. Similarly, in panel (b), there is a group of nodes whose out-component contains around 60 nodes, a second group of nodes with out-component sizes between 40 and 50, and many other nodes having out-component with less than 40 nodes. The observed small variability in the size of node components during WB, is due to the fact that students and faculty members have more opportunities to meet and interact at lectures during WB. Even if not all students attend the same classes, and not all professors teach to all the students, there is a high probability that two individuals would be connected by longer temporal paths. Conversely, during WE, the students usually meet other students in small groups, and they usually do not meet professors and lecturers, except for the classes held on Thursday afternoon and on Friday. As a result, the size of the in- and out-components during WE exhibits large fluctuations from node to node. Such fluctuations are lost in a static graph description, which aggregates all the links independently of their time ordering. In fact, the static aggregated graphs corresponding respectively to WB and WE, have only one giant connected component which contain the majority of the nodes, while the remaining nodes are isolated. As comparison, the size of the giant component of the aggregated static graphs for WB and WE are also reported in Fig. 4, respectively as dashed red line and solid blue line. Notice that the static aggregated graph corresponding to a co–location time-varying graph is intrinsically undirected. Therefore, the in- and out-components of a node in this graph coincide and correspond to the component to which the node belongs. Moreover, in a static aggregated graph all the links (and consequently also all the paths) are always available, so that all the nodes in the same connected component have the same component size. As a result, the variability in the node connectedness of the time-varying network, which is evident from the distribution of circles and squares in Fig. 4, is flattened down in the aggregated static graphs. In the latter case, all information about network connectedness is represented by a single value, namely the size of the largest connected component, which does not provide any information about the mutual reachability of two generic nodes of such a component. In particular, the size of the giant connected component of the static aggregated graph is equal to 74 during WB and to 66 during WE, despite the fact that in the latter interval the majority of nodes has much smaller temporal inand out-components. Similar results are obtained for the temporal in- and out-components of nodes in IC and FB. However, we do not report here the corresponding figures for brevity. We now analyze the strongly connected components of different time-varying graphs obtained from the three data sets under consideration. In particular, we focus on the Fall term of RM (namely weeks from 10 to 19 in the original data set), the last four days of IC (namely days 2 to 5), and the first twelve weeks of FB (from January to the end of March 2009). In Table I we report the rel-
RM (Mondays)
10 11 12 13 14 15 16 17 18 19
K 646 554 105 772 815 1485 1022 1284 1417 1106
T Ns 4341 22 4414 15 307 11 8322 16 6481 20 22096 23 9033 22 15572 19 18430 16 13531 13
hsi 10.3 9.1 4.1 10.6 12.7 23.7 16.5 22.3 20.7 20.9
S NS NU 27 1 27 29 1 29 13 1 13 36 1 36 27 1 27 44 1 44 29 1 29 38 1 38 44 1 44 38 2 42
NI 27 29 13 36 27 44 29 38 44 34
C 62 54 22 59 62 67 70 67 67 60
10 11 12 13 14 15 16 17 18 19
K 2200 2506 2598 2965 2590 3321 2927 2802 2298 2966
T Ns 45428 10 54500 12 57913 12 71561 9 56826 15 85348 9 69452 9 66247 10 47429 12 70963 13
hsi 44.0 46.8 43.5 62.5 39.3 54.7 53.2 57.9 40.0 53.8
S NS NU 61 1 61 64 1 64 66 1 66 69 1 69 64 1 64 74 1 74 70 1 70 69 1 69 61 2 62 69 3 71
NI 61 64 66 69 64 74 70 69 60 68
C 69 75 77 79 79 85 80 77 73 81
IC (hours)
TABLE I. Structural properties of the affine graph corresponding to the time-varying graph of the first 24 hours of the week (Monday), and to the whole weeks in the Fall term of RM. We report the number of links (K), number of triangles (T ), number of maximal cliques (Ns ), average size of maximal cliques (hsi), size of the largest maximal clique (S), number of largest maximal cliques (NS ), number of nodes in the union (NU ) and in the intersection (NI ) of all largest maximal cliques. The size of the giant component of the corresponding static aggregated graph (C) is reported in the rightmost column. 6:00 7:00 8:00 9:00 10:00 11:00 12:00 13:00 14:00 15:00 16:00 17:00 18:00 19:00 20:00
K 376 793 1922 1825 2252 2142 2346 2621 2389 2330 1991 1862 1595 1177 1110
T Ns 2061 17 7514 16 35472 13 35598 4 48459 6 45510 3 52394 1 61270 2 53297 2 51382 4 40153 5 36165 5 27979 6 18424 2 16393 8
hsi 8.1 15.8 35.8 29.5 50.8 43.0 69.0 69.0 56.5 63.5 46.6 44.2 39.3 25.5 16.0
S NS NU 19 2 20 29 1 29 56 2 57 60 1 60 64 1 64 65 1 65 69 1 69 72 1 72 69 1 69 66 1 66 58 3 60 58 1 58 51 1 51 49 1 49 46 1 46
NI 18 29 55 60 64 65 69 72 69 66 56 58 51 49 46
C 44 50 69 61 68 66 69 73 70 69 65 62 58 49 49
IC (days)
evant structural properties of different affine graphs constructed from RM. In particular, we consider the timevarying graphs constructed in the first 24 hours (Monday) of ten consecutive weeks (from week 10 to week 19), and the time-varying graphs corresponding to the whole weeks. At the scale of one day, we observe large fluctuations in the measured values. The number of links K ranges from 105 in week 12 to 1485 in week 15, while the number of triangles T is in the range [307, 22096], with a mean value around 10000 and a standard deviation equal to 6932. This variance is due to the fact that, even if the daily activity of each individual is, on average, almost periodic, in a particular day we can observe a peculiar temporal pattern of connections. For instance, some students decide to skip a class or the lessons are suspended for public holidays. This is exactly what happens on week 12. Monday of week 12 is September 11th 2004, and corresponds to the Patriot Day, a national holiday introduced in the US in October 2001, designated in memory of the 2977 killed in the September 11th , 2001 attacks. Therefore, we observe the minimum connectivity and the minimum number of triangles on week 12 of RM, because all teaching activities were suspended, and students did not participate to lessons as usual. At the scale of one week, instead, the number of links and the number of triangles T are much more stable over time: K has a mean value of 2717 and a standard deviation of 342, while T has a mean value around 62000 and a standard deviation around 12000. For the graphs of Mondays, we find that the number Ns and the average size hsi of maximal cliques of the affine graphs fluctuate over the ten weeks. In particular, we observe relative smaller values of Ns and hsi during Mondays of weeks 10 to 14 than in weeks 15 to 19, which is probably due to the relatively lower number of links and triangles. Conversely, if we consider the size S of the largest strongly connected component (i.e., the largest maximal-clique of the affine graph), we notice that it is not strongly correlated with K and T . For instance, the size of the largest strongly connected component found at Monday of week 11 (S = 29) is equal to that observed at Monday of week 16. However, in week 11 the affine graph has a much smaller number of links and triangles than in week 16. Moreover, on Monday of week 14 we have a maximal-clique of size 27, even if the number of links and triangles is higher than on Monday of week 11. At the scale of a week, we still observe relevant fluctuations of average size hsi, in the range [39.3, 62.5], but the number of strongly connected components is stable around Ns = 10, with a maximum of NS = 15 in week 14. These results confirm that the size of the largest strongly connected component of a time-varying graph is determined by the actual configuration of links and triangles of the corresponding affine graph, and not only by their relative number, and in general depends on the temporal scale at which we observe the system. Examining the results reported in Table I, we notice that the affine graphs for Mondays of all the weeks of
RM (weeks)
9
2 3 4 5
K 2920 2776 2225 1602
T Ns 72638 4 67435 3 47287 5 27617 9
hsi 55.8 50.3 44.0 31.7
S NS NU 75 1 75 74 1 74 63 1 63 53 1 53
NI 75 74 63 53
C 78 76 68 60
TABLE II. Structural properties of the affine graphs corresponding to time-varying graphs of different hours of the third day and of each of the four days of IC. The graph corresponding to each hour includes all the contacts recorded in that hour, so that, for instance, the first graph is constructed from the interactions observed from 6 : 00 to 6 : 59. Legend as in Table I.
RM admit a single LSCCT , except in week 19 where two LSCCT s of size S = 38 emerge. For this reason, we also looked at the number of nodes NU which participate to at least one LSCCT , and at the number NI of nodes which participate to all LSCCT s. These numbers correspond, respectively, to the number of nodes found in the union and in the intersection of all LSCCT s. An interesting
10
FB (weeks)
many opportunities to be co–located with a large number of other participants for a relatively long period (at least a couple of hours). Therefore, all the participants to the same session usually form a single strongly connected component. However, if we observe the system at the scale of one hour, we notice that there are relevant fluctuations in the number of links and triangles, and in the number and size of strongly connected components. In the graphs constructed from contacts recorded before 8:00 we observe a relatively smaller number of links and triangles and smaller values of S. The number of links remains almost stable until 17:00, while S steadily increases up to S = 72 at 13:00 (lunch time) when the size of the LSCCT reaches a maximum. Then, both the number of triangles and the size of the LSCCT decrease, and the graph at 20:00 has S = 46 and T = 16393. Also at the scale of one hour we observe a clear correlation between S and C, NS = 1 and the average size hsi of SCCT s is comparable with the size of the largest strongly connected component. 1 2 3 4 5 6 7 8 9 10 11 12
K 43491 48404 43400 60853 65703 70282 60666 73772 79645 66849 55040 51418
FB (adj.weeks)
result is that NI = 34 on Monday of week 19, so that 34 nodes participate to both maximal 42-node cliques. These 34 nodes play a very important role in the structure of the network. If we remove just one of them, then the resulting affine graph does not have a clique of size 42 any more, and consequently the size of the LSCCT of the remaining time-varying graph is smaller than 42. At the same time, removing all these NI nodes will cause a significant reduction in the size of LSCCT s, in the number of triangles of the affine graph and, consequently, in the number of SCCT s. The nodes that participate to at least one LSCCT are important for the diffusion of information throughout time-varying graphs. In fact, if a message is passed to one of these NU nodes, then there is a high probability that the message could be delivered to all the other NU − 1 nodes in the union of all LSCCT . Similar results are observed also at the scale of a week, where almost all graphs have just one LSCCT , except for week 18 and 19 where we found NS = 2 and NS = 3, respectively. In the rightmost column of Table I we report, for each time-varying graph, the size C of the giant component of the corresponding static aggregated graph. At the scale of one day, the value of C is always much larger than S, as a consequence of the fact that the static representation of the time-varying graph systematically overestimates node connectedness and paths availability. Conversely, at the scale of one week the size of the LSCCT is comparable with the size of the largest strongly connected component of the aggregated graph. In fact, when we consider longer time periods, longer temporal paths appear and, consequently, there is a higher probability that a large number of pairs of nodes become mutually reachable. The affine graphs of entire weeks of RM are almost complete graphs and look similar to each other, so that we observe a relatively high correlation between S and C at the scale of one week, even if there is no correlation between S and C at the scale of a single day. For instance, on Monday of week 16 we observe the maximum value of C, namely C = 70, while the corresponding time-varying graph has a largest strongly connected component of size S = 29, which is relatively small compared to the other weeks. Conversely, on Monday of week 13 we observe a relatively small giant component, with C = 59 nodes, while the size of the largest strongly connected component at the same day is S = 36. In Table II we consider the time-varying graphs constructed at different hours of the day 3 of IC, and those obtained for each of the four days of the conference. In this case, the system at the scale of one day is saturated: there are just a few strongly connected components and only one LSCCT , which roughly correspond with the largest connected component of the aggregated graph. In fact, the dynamics of interactions between participants at a conference differs a lot from the recurrent daily interactions which are typical in RM. Usually, during a single day of conference the participants attend different plenary sessions, and consequently they have
1 2 3 4 5 6 7 8 9 10 11
K 197818 170830 211523 327351 419563 345943 346856 313564 493502 282759 217796
T 52284 50364 32655 102066 97631 117530 78769 188457 200061 85373 56615 59858
Ns 6445 7583 6922 9377 10182 10646 9335 10709 11475 10595 8753 7735
hsi 4.2 4.1 3.8 4.3 4.4 4.5 4.2 4.7 4.8 4.3 4.0 4.1
S NS NU NI 22 1 22 22 20 1 20 20 16 1 16 16 41 1 41 41 23 7 29 15 27 1 27 27 28 1 28 28 46 3 48 45 38 1 38 38 18 1 18 18 27 2 28 26 28 2 29 27
T Ns hsi S NS 2542462 48782 29.8 112 1 990149 17325 11.8 58 1 1936214 29947 17.5 89 1 135246 27432 19.3 88 1 8977497 1355049 42.5 119 1 4805124 392966 31.0 91 1 5527618 149156 23.0 145 1 3176483 195238 25.2 138 1 14700802 1160920 66.7 149 1 2966668 154016 21.5 87 1 2277735 29077 13.2 103 2
NU 112 58 89 88 119 91 145 138 149 87 104
NI 112 58 89 88 119 91 145 138 149 87 102
C 12000 13998 12773 17933 19973 20976 18537 20256 21990 20425 18266 15667 C 32071 33114 36820 37455 44464 44117 44107 44886 46790 43693 39950
TABLE III. Structural properties of the affine graphs corresponding to the time-varying graphs of weeks (upper rows) and pairs of adjacent weeks (lower rows) of FB data set. Legend as in Table I.
Finally, in Table III we report the structural properties of the affine graphs constructed from FB. We considered 12 time-varying graphs at the scale of a week and 11 time-varying graphs at the scale of 14 days, i.e. couples of subsequent weeks. In this case the number of nodes of the affine graphs was quite large, so we used HPC facilities provided by the Edinburgh Parallel Computing Center (EPCC), in order to run a parallelized version of the algorithm described in [47] on 128 processors. At the scale of a week, we observe significant fluctuations in the structural properties of the affine graphs corresponding to distinct weeks: there is a high variability in the number of links (K is in the range [43400, 79645]) and in the number of triangles (T is in the range [32655, 200061]).
11 However, the size of the LSCCT is relatively small, compared to the number of nodes in the graph. In fact, S remains in the range [16, 41], which is quite surprising for a graph with more than 100000 nodes. At the same time, there is no correlation at all neither between S and C nor between S and T . A similar result is obtained when considering pairs of adjacent weeks: in this case, the size of the LSCCT is slightly larger (the maximum is observed for the 9th pair of weeks, when S = 149), but S is still two orders of magnitude smaller than C. The case of FB is emblematic of the implicit weaknesses of a component analysis based on static aggregated graphs. According to traditional static graphs theory, the giant component of a network constructed from two adjacent weeks of Facebook communication contains at least 32% of the 100000 nodes, while a temporal analysis reveals that less than 0.15% of the nodes are indeed mutually reachable.
temporal measures are able to capture variations and fluctuations in the linking patterns, typical of many real social and biological systems. As a first application, we have studied three databases of human contacts, showing that variations in the pattern of connections among nodes produce relevant differences in the size and number of temporal strongly connected components. We have pointed out the important role played by nodes that belong to different strongly connected components at the same time, and we have also analyzed how the size of temporal strongly connected components depend on the observation interval. We hope that our formalism will be useful to analyze other data sets of time-varying networks that will be available in the near future, and to better characterize dynamical processes that take place on these networks, such as diffusion of information and spreading of diseases. ACKNOWLEDGMENTS
VI.
CONCLUSIONS
Conventional definitions of connectedness and components proposed so far have only considered aggregate, static topologies, neglecting important temporal information such as time order, duration and frequency of links. In this work we have extended the concepts of connectedness to the case of time-varying graphs, and we have introduced definitions of node and graph components which take into account duration, times of appearance and temporal correlations of links. The proposed
[1] S. Boccaletti, et al., Phys. Rep. 424, 175 (2006). [2] A. Arenas, Albert D´ıaz-Guilera, J. Kurths, Y. Moreno, C. Zhou, Phys. Rep. 469, 93 (2008). [3] B. Tadi´c and S. Thurner, Physica A 332, 566 (2004). [4] P. Holme, Phys. Rev. E 71, 046119 (2005). [5] J. Kleinberg, Commun. ACM, 51, 66 (2008). [6] G. Kossinets, J. Kleinberg, and D. Watts, In Proc. of ACM SIGKDD’08, p. 435, ACM Press. [7] L. Isella, J. Sthel´e, A. Barrat, C. Cattuto, J.-F. Pinton, W. Van der Broeck, J. Theor. Biol. 271, 166 (2011). [8] M. C. Gonz´ alez, C.A. Hidalgo and A.-L. Barab´ asi, Nature 453, 779 (2008). [9] A. Buscarino, L. Fortuna, M. Frasca, V. Latora, Europhys. Lett. 82, 38002 (2008). [10] B. Tadi´c, Physica A 293, 273 (2001) [11] C. Caretta-Cartozo, P. De Los Rios, F. Piazza, P. Li` o, PLoS Computational Biology, 3, e103 (2007). [12] A. Ahmed and E. P. Xing, Proc. Natl. Acad. Sci. USA 106, 11878 (2009). [13] M. Valencia, J. Martinerie, S. Dupont, and M. Chavez, Phys. Rev. E. 77, 050905R (2008). [14] F. De Vico Fallani et al., Journ. Phys. A: Math. Theor. 41, 224014 (2008).
This work was partially carried out under the HPCEuropa2 project (project number: 228398) with the support of the European Commission Capacities AreaResearch Infrastructures Initiative. This work made also use of the facilities of HECToR, the UKs national high performance computing service, which is provided by UoE HPCx Ltd at the University of Edinburgh, Cray Inc and NAG Ltd, and funded by the Office of Science and Technology through EPSRCs High End Computing Programme. This work has been partially supported by the EPSRC Project MOLTEN (EP/1017321/1).
[15] A.-L. Barab´ asi, H. Jeong, R. Ravasz, Z. Neda, T. Vicsek, and A. Schubert, Physica A 311, 590 (2002). [16] A. Clauset and N. Eagle. In Proc. of DIMACS’07 (2007). [17] G. Miritello, E. Moro, and R. Lara, Phys. Rev. E 83, 045102(R) (2011). [18] J. Sthele, A. Barrat and G. Bianconi, Phys. Rev. E 81, 035101 (2010). [19] P. Grindrod, D. J. Higham, Proc. R. Soc. A 466, 753 (2010). [20] P. J. Mucha, T. Richardson, K. Macon, M. A. Porter, and J.-P. Onnela, Science 328, 876 (2010). [21] N. Fujiwara, J. Kurths and A. D´ıaz-Guilera, Phys. Rev. E 83, 025101(R) (2011). [22] Tang, J., Musolesi, M., Mascolo, C. and Latora, V., In Proc. of ACM WOSN09 (2009), ACM Press. [23] J. Tang, M. Musolesi, C. Mascolo, V. Latora, and V. Nicosia, In Proc. of ACM SNS’10 (2010), ACM Press. [24] J. Tang, C. Mascolo, M. Musolesi and V. Latora, In Proc. of IEEE WOWMOM’11 (2011), IEEE Press. [25] J. Moody, Social Forces 81, 1 (2002). [26] L.E.C. Rocha, F. Liljeros and P. Holme, Proc. Natl. Acad. Sci. USA, 107, 5706 (2010) [27] S. Lee, L. E. C. Rocha, F. Liljeros, P. Holme, arXiv:1011.3928
12 [28] D. Kempe, J. Kleinberg and A. Kumar, J. Comput. Syst. Sci. 64, 820 (2002). [29] E. Cheng, J. W. Grossman, M. J. Lipman, Discrete Appl. Math. 128, 317 (2003) [30] P. Grindrod, D. J. Higham, M. C. Parsons, E. Estrada, Phys. Rev. E 83, 046120 (2011). [31] D. J. Higham, P. Grindrod, E. Estrada, ”Mathematics Faces up to Facebook”, University of Strathclyde Mathematics and Statistics Research Report 19 (2010). [32] V. Kostakos, Physica A 388, 1007 (2009). [33] J. Tang, S. Scellato, M. Musolesi, C. Mascolo, and V. Latora, Phys. Rev. E 81, 055101 (2010). [34] R. K. Pan and J. Saram¨ aki, Phys. Rev. E 84, 016105 (2011) [35] Broder, A. et al., Computer Networks 33, 309 (2000). [36] Albert, R., Jeong, H. and Barabasi, A., Nature 406, 378 (2000). [37] Dorogovtsev, S.N., Mendes, J.F.F. and Samukhin, A.N., Phys. Rev. E 64, 025101 (2001). [38] R. M. Karp, Complexity of Computer Computations. New York: Plenum. 85, (1972).
[39] D. B. West, “Introduction to graph theory”, Prentice Hall, 2nd ed., ISBN 0130144002 (2001) [40] R. G. Downey and M. R. Fellows, Theoretical Computer Science 141 (12), 109 (1995). [41] J. W. Moon, L. Moser, Israel Journal of Mathematics 3, 23 (1965). [42] C. Bron, J. Kerbosch, Communications of the ACM 16 (9), 575 (1973). [43] U. Feige, S. Goldwasser, L. Lov´ asz, S. Safra, M. Szegedy, In Proc. of IEEE SFCS’91, 2 (1991), IEEE Press. [44] S. Arora, S. Safra, Journal of the ACM 45 (1), 70 (1998). [45] S. Arora, C. Lund, R. Motwani, M. Sudan, M. Szegedy, Journal of the ACM 45 (3), 501 (1998). [46] R.E. Tarjan, A.E. Trojanowski, SIAM Journal on Computing 6, 537 (1977). [47] Robson, J. M. (1986), Journal of Algorithms 7 (3), 425 (1986). [48] N. Eagle A. Pentland, ”Reality mining: sensing complex social systems”, Pers. Ubiquit. Comput. 10, 255 (2006). [49] J. Scott et al., CRAWDAD Trace (INFOCOM, Barcelona, 2006). [50] C. Wilson, B. Boe, A. Sala, K.P.N. Puttaswamy and B. Y. Zhao, In Proc. of ACM EuroSys’09 (2009), ACM Press.