MARINE ECOLOGY PROGRESS SERIES Mar Ecol Prog Ser
Vol. 527: 167–180, 2015 doi: 10.3354/meps11265
Published May 7
Composition and temporal patterns of larval fish communities in Chesapeake and Delaware Bays, USA Filipe Ribeiro1, 3,*, Edward Hale2, Eric J. Hilton1, Todd R. Clardy1, Alison L. Deary1, Timothy E. Targett2, John E. Olney1,† 1
Virginia Institute of Marine Science, College of William & Mary, Gloucester Point, Virginia 23062, USA 2 School of Marine Science and Policy, University of Delaware, Lewes, Delaware 19958, USA
3
Present address: Marine and Environmental Sciences Centre — MARE, Faculdade de Ciências da Universidade de Lisboa, Campo Grande, 1749-016, Lisboa, Portugal
ABSTRACT: Comparing larval fish assemblages in different estuaries provides insights about the coastal distribution of larval populations, larval transport, and adult spawning locations. We simultaneously compared the larval fish assemblages entering 2 Middle Atlantic Bight (MAB) estuaries (Delaware Bay and Chesapeake Bay, USA) through weekly sampling from 2007 to 2009. In total, 43 taxa (32 families) and 36 taxa (24 families) were collected in Delaware and Chesapeake Bays, respectively. Mean taxonomic diversity, mean richness, and evenness were generally lower in Delaware Bay. Communities of both bays were dominated by Anchoa spp., Gobiosoma spp., Micropogonias undulatus, and Brevoortia tyrannus; Paralichthys spp. was more abundant in Delaware Bay and Microgobius thalassinus was more abundant in Chesapeake Bay. Inter-annual variation in the larval fish communities was low at both sites, with a relatively consistent composition across years, but strong seasonal (intra-annual) variation in species composition occurred in both bays. Two groups were identified in Chesapeake Bay: a ‘winter’ group dominated by shelfspawned species and a ‘summer’ group comprising obligate estuarine species and coastal species. In Delaware Bay, 4 groups were identified: a ‘summer’ group of mainly obligate estuarine fishes being replaced by a ‘fall’ group; ‘winter’ and ‘spring’ groups were dominated by shelf-spawned and obligate estuarine species, respectively. This study demonstrates that inexpensive and simultaneous sampling in different estuaries provides important insights into the variability in community structure of fish assemblages at large spatial scales. KEY WORDS: Estuarine systems · Young-of-the-year · Community composition · Temporal variability · Ichthyoplankton · Middle Atlantic Bight Resale or republication not permitted without written consent of the publisher
INTRODUCTION Estuaries are important ecosystems for biota, serving as ecological filters, supplying nutrients, and providing nursery and reproductive areas (Lenanton & Potter 1987, Murdy et al. 1997). The multiple ecological functions of estuaries result from high aquatic productivity and high environmental variability in *Corresponding author:
[email protected] † Deceased
space and time; these are particularly extreme in temperate estuaries (Able & Fahay 2010). The wide variation in water temperature, salinity, oxygen, and turbidity enables many fishes to use estuaries for different functions, such as feeding, reproduction, or nursery during their early life (Lenanton & Potter 1987). Able & Fahay (2010) classified estuarine fish species as facultative users (i.e. species that oppor© Inter-Research 2015 · www.int-res.com
168
Mar Ecol Prog Ser 527: 167–180, 2015
tunistically use the estuarine environments for a specific function), obligate users (i.e. resident species that complete their life cycle inside the estuary or species that need it to reproduce, such as diadromous taxa), and expatriate users (i.e. primarily marine or freshwater species that occasionally enter estuaries, but if they remain there they do not survive). Estuaries are widely acknowledged as important nursery areas for many coastal marine facultative users from adjacent coastal ecosystems (Murdy et al. 1997, Able & Fahay 2010, Vasconcelos et al. 2010). The importance of estuaries as nursery grounds may vary annually and geographically (Able & Fahay 2010). Comparing annual and spatial data on the composition and structure of larval and juvenile fish communities between estuaries can provide baseline information to understand the importance of estuaries to fishes along temporal and spatial gradients in a given region (Able & Fahay 2010, Vasconcelos et al. 2010, Martinho et al. 2013). Larval fish communities in estuaries of temperate regions often exhibit seasonal patterns that are consistent between years and are generally dominated by resident, coastal facultative, and expatriate fishes (Witting et al. 1999, Ramos et al. 2006). This seasonality is expressed in terms of larval composition and abundance, and is determined by spawning location and timing (Allen & Barker 1990, Witting et al. 1999, Ramos et al. 2006). Along the Middle Atlantic Bight (MAB) of North America — the region of the continental shelf extending from Cape Cod, Massachusetts, southward to Cape Hatteras, North Carolina (Fig. 1) — larvae of many fishes are transported by currents into estuaries from spawning sites along the continental shelf to as far away as the Sargasso Sea, while other fishes and larvae are retained within the estuaries (Warlen & Burke 1990, Able & Fahay 1998). Therefore, temporal patterns of larval fish composition in a specific estuary are the result of the transport dynamics conveying larvae from their spawning site and retention within the estuary (Hare et al. 2005, Schieler et al. 2014). Consequently, this temporal pattern is dependent on the distance between the estuary and spawning locations of the resident and coastal species living in the area, i.e. on a spatial as well as a temporal dimension (Houde 1997, Hare et al. 2005). Directly comparing the MAB estuarine larval fish communities along a latitudinal gradient provides a unique opportunity to compare temporal patterns of larval ingress of facultative estuarine species and other aspects of community structure at a broad geographical scale (Able & Fahay 2010).
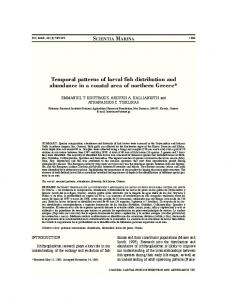
Fig. 1. Chesapeake Bay and Delaware Bay, USA, sampling site locations: York River Site (YRS; Gloucester Point, Virginia) and Roosevelt Inlet Site (RIS; Lewes, Delaware). Inset shows position of the Middle Atlantic Bight (MAB) and the area of detail shown in the map
In the MAB estuaries of the western North Atlantic Ocean, seasonal patterns of larval fish ingress have been extensively studied (e.g. Witting et al. 1999, Love et al. 2009). However, these studies have generally focused on a single estuary (e.g. Allen & Barker 1990, Witting et al. 1999, Love et al. 2009) or have been restricted to temporal patterns of single species compared among estuaries of the MAB (Sullivan et al. 2006, 2009, Able et al. 2011a). There have been no community-wide comparisons of larval fishes between the 2 largest estuaries in the region — Chesapeake Bay and Delaware Bay. Such comparisons, however, can provide information regarding the spawning areas of fishes (i.e. shelf, coastal, or local), improve our understanding of temporal patterns of larval fish community structure at a broad scale, and evaluate the importance of estuaries to coastal fish stocks along the MAB. A predictable seasonal succession of fish larvae in estuaries is reported to be generally consistent across years (Allen & Barker 1990, Witting et al. 1999, Love et al. 2009), although
Ribeiro et al.: Larval fish communities in estuaries
the observed seasonal pattern has never been compared simultaneously in different estuaries and between years (Allen & Barker 1990, Hettler & Chester 1990, Love et al. 2009). In this study, we describe and compare simultaneously the communities of fish larvae in 2 estuaries in the MAB: Chesapeake Bay and Delaware Bay. We compare taxonomic composition and structure from 3 yr of weekly sampling of larval fishes to detect annual variability of the seasonal patterns in their community structure between estuaries.
MATERIALS AND METHODS
169
mately 5 km from the mouth of Delaware Bay. At this location, the river is 60 m wide and the site is 3 m deep; water temperature varied from −1 to 28°C; salinity from 4 to 33 ppt; and tidal water velocity from 0.3 to 0.5 m s−1 (Hale 2012). The York River Site (YRS, 37°14.4’ N, 76° 30.8’W) is located approximately 11 km upriver from the river mouth and 47 km from the entrance to Chesapeake Bay; at this location, the river is 700 m wide and the site is 4 m deep. During this study, water temperature ranged from 2 to 29°C, water salinity from 14 to 24 ppt, and water current from 0.2 to 0.8 m s−1 (Virginia Estuarine and Coastal Observing System [VECOS], station YRK005.40, http:// web2.vims.edu/vecos/).
Study areas Field methods Chesapeake Bay and Delaware Bay are located on the coast of the western North Atlantic in the northeastern USA (Fig. 1). These 2 large estuaries discharge onto the continental shelf in the southern MAB, producing a strong current along the coastline (Epifanio & Tilburg 2008). Chesapeake Bay is among the largest estuaries in North America, with a surface area of more than 11 000 km2 and watershed of over 175 000 km2 (Murdy et al. 1997). Delaware Bay is significantly smaller, with a surface area of approximately 2000 km2 and a watershed area of 35 000 km2 (Janzen & Wong 2002, Epifanio & Tilburg 2008). Chesapeake Bay is a relatively shallow estuary (on average < 6 m deep) and the mean annual freshwater flow of the 3 largest tributaries (Susquehanna, Potomac, and James Rivers) is 2000 m3 s−1 (Schubel & Pritchard 1986). Delaware Bay has a mean depth of 10 m and presents a freshwater flow of 531 m3 s−1, primarily from the Delaware River. The lower freshwater input and higher tidal current amplitudes have important consequences for circulation patterns in Delaware Bay, which is a weakly stratified estuary, whereas Chesapeake Bay is a moderately stratified estuary (Murdy et al. 1997, Janzen & Wong 2002, Epifanio & Tilburg 2008). The general patterns of water salinity and temperature are similar in the 2 estuaries, with salinity varying between 0.5 and 32 ppt depending on season and weather conditions, and water temperature between 1 and 4°C in late winter and between 28 and 30°C in late summer (Able & Fahay 2010). Shore-based sampling sites were located at Roosevelt Inlet in Lewes, Delaware (Delaware Bay) and on the York River in Gloucester Point, Virginia (Chesapeake Bay; Fig. 1). The Roosevelt Inlet Site (RIS, 38° 47.8’ N, 75° 8.5’ W) is located at the mouth of the Broadkill River, approxi-
Samples were collected at the same time by a different field crew in each of the 2 estuaries (occasional differences of 1 to 2 d), on a weekly basis from 1 September 2007 through 31 August 2010, with a total of 155 sampling occasions at each location. During each sampling event, 3 passive plankton tows were conducted using a 1 m diameter plankton net with a mesh size of 1 mm. Each tow consisted of lowering the net for 30 min during the night-time flood tide at a depth of 1 m. Between June and August, sampling occurred every 2 wk and sampling times were reduced to 15 min tows to reduce the amount of collected ctenophores and avoid clogging the net due to large concentrations of resident species with low taxonomic richness (e.g. catches dominated by bay anchovy). A flowmeter (General Oceanics, model 2030) was suspended in the mouth of the net to determine the volume of water sampled in each tow at both locations. At the YRS, water flow data from VECOS station YRK005.40 was used to obtain volume flow values for sampling occasions with missing values due to flowmeter malfunction or obstruction. A regression was performed between the volumes calculated from the flowmeter and those from the VECOS data to allow a better estimate of filtered volumes, and for use in case of flowmeter malfunction. An average of 507 m3 (196 m3 SD) of water was sampled in each tow at the YRS and 348 m3 (180 m3 SD) at the RIS. Nets were rinsed into collection buckets and samples were taken to the laboratory and promptly sorted by removing the larval and juvenile fishes, which were preserved in 70% ethanol. Larvae were sorted under a stereo microscope after a preliminary screening by naked eye. Once sorted, taxa were identified to species level or to the lowest pos-
170
Mar Ecol Prog Ser 527: 167–180, 2015
sible taxon (e.g. Anchoa spp., Paralichthys spp., Gobiosoma spp., Menidia sp., Menticirrhus sp., Syngnathus sp., Ammodytes sp.) using keys in Richards (2006) and Fahay (2007); individuals of each species were counted. Anchoa spp. includes A. mitchilli and A. hepsetus, Gobiosoma spp. includes G. bosc and G. ginsburgi, and Paralichthys spp. includes exclusively P. dentatus, although discrimination from P. lethostigma was not confirmed (P. lethostigma is typically a more southern species that has recently been documented as juveniles in the Chesapeake Bay; Lusk et al. 2014). The filtered water-volume was used to calculate the density of fish larvae per tow, and the density data from the 3 consecutive tows were combined to calculate a mean density for a sampling event; these are presented as the number of fish larvae per 1000 m3. Mean density estimates from each sampling event were used as the basic sampling unit to calculate mean annual density and species abundances and for comparison between sites and dates.
Data and statistical analysis Species richness, Shannon-Wiener diversity index, and Pielou’s evenness index (Shannon & Weaver 1963, Pielou 1966) were calculated for each sampling occasion, using the ‘vegan’ package in R (R Development Core Team 2012). Mean values of community indices (richness, diversity, and evenness) and mean total densities were compared between bays (Welch 2-sample test, p < 0.05) and in each bay between years using a 1-way ANOVA, followed by Tukey’s HSD test (p < 0.05). Density differences for each taxon were evaluated between bays using a non-parametric test (Mann-Whitney U-test, p < 0.05). To compare the inter-annual densities of each taxon, a Kruskal-Wallis test (p < 0.05) was done for the 15 most abundant taxa in each bay (forming about 99.7 and 99.3% of the larval fish community at the RIS and the YRS, respectively). Non-parametric statistical tests were used if the data did not comply with ANOVA assumptions (e.g. homogeneity of variances and normal distribution of the data) even after log transformation (Zar 1999, McCune & Grace 2002). Following the KruskalWallis test, Dunn’s tests were performed as a post hoc comparison test to determine inter-annual differences (Zar 1999). All non-parametric tests were performed using R. We also compared larval fish assemblage data between bays and between years in each bay by running a permutational multivariate ANOVA (PERMANOVA, Anderson 2001) in R (‘vegan’ package, ‘adonis’ function).
To evaluate larval assemblage variation between bays and between years in each bay, a multiresponse permutation procedure (MRPP) was done to complement the ANOVA (McCune & Grace 2002). The MRPP is appropriate for community datasets that violate the assumption of normality required for parametric statistics and ranks species based on their abundance (McCune & Grace 2002). One global community matrix of 15 common taxa between both bays was used to compare differences in community composition between sites. A community data matrix of the 15 most abundant taxa for each bay was used to evaluate inter-annual differences in each bay (McCune & Grace 2002). Bray-Curtis distances were calculated for all 3 community datasets between sampling units, and the mean within-group distance (δ) (groups: bay and year) was compared. Lower δ values indicate more similarity among sample units within each group (McCune & Grace 2002). A test statistic (T ) was calculated to describe the separation between groups based on a permutation test that assumed a continuous distribution (Pearson type III) of expected δ-values (McCune & Grace 2002). Negative T-values indicate stronger group separation. Finally, an agreement statistic (A) was calculated to evaluate the chance-corrected within-group agreement (McCune & Grace 2002); when sites have identical species assemblages to one another, the observed δ is 0 and A = 1 (highest value). If withingroup heterogeneity equals the expectation by chance then A = 0. If within-group heterogeneity is less than expected by chance, then A < 0. According to McCune & Grace (2002), values for A in community ecology are generally below 0.1, and A > 0.3 represents high agreement values. Indicator species analysis (ISA) was also conducted to identify the primary species defining the larval fish community in each bay and in each year. The MRPP and ISA procedures were run in R using the ‘vegan’ package and ‘mrpp’ and ‘indval’ functions. To identify seasonal taxonomic groups in each bay, a hierarchical cluster analysis of the 15 most abundant taxa was performed in conjunction with nonmetric multidimensional scaling (nMDS). Dendrograms of taxa were created using hierarchical, groupaveraged clustering (cut-off value: 0.8) from BrayCurtis ranked similarities based on log-transformed larval concentrations (McCune & Grace 2002). Stress levels of the nMDS were minimized with 30 random restarts and only considered significant if stress levels were lower than 15% and if the results were ecologically interpretable in 2-dimensional space (McCune & Grace 2002). nMDS was run in R using isoMDS
Ribeiro et al.: Larval fish communities in estuaries
171
Table 1. Mean total and annual taxonomic richness (no. of species), Shannon-Wiener diversity index, Pielou evenness index, density (no. per 1000 m3), and total number of fish larvae sampled in Delaware Bay (Roosevelt Inlet Site, RIS) and in Chesapeake Bay (York River Site, YRS) (± 95% confidence interval). Site total values were compared using Welch 2-sample test. Statistical differences among years were obtained by 1-way ANOVA (F-value) in each bay. For richness and density, F-values were obtained for log(x+1) transformed data. Results of a posteriori Tukey’s test are indicated by superscript letters; ns: not significant; NA: not applicable Site
Year
Richness
Diversity
Evenness
Density
No. of fish larvae
RIS
2007−2008 6.0 ± 0.5a 0.82 ± 0.10a 0.47 ± 0.05 2008−2009 5.3 ± 0.6ab 0.72 ± 0.11ab 0.48 ± 0.06 2009−2010 4.5 ± 0.7b 0.61± 0.11b 0.46 ± 0.07 F 6.666, p < 0.01 4.156, p < 0.05 0.059 ns Total 5.3± 0.4 0.73± 0.06 0.47± 0.03 (t = −3.698, p < 0.001) (t = −4.066, p < 0.001) (t = −2.018, p < 0.05)
784.7 ± 256.9 526.6 ± 250.1 521.9 ± 251.2 1.413 ns 621.0±148.1 (t = 2.626, p < 0.01)
154 515 86 844 52 111 NA 293 470
YRS
2007−2008 6.2 ± 0.8 0.89 ± 0.10 0.53 ± 0.05 2008−2009 6.7 ± 0.7 0.89 ± 0.09 0.49 ± 0.05 2009−2010 5.8 ± 0.6 0.91± 0.10 0.54 ± 0.06 F 1.520 ns 0.046 ns 0.835 ns Total 6.2± 0.4 0.90± 0.06 0.52± 0.03 (t = −3.698, p < 0.001) (t = −4.066, p < 0.001) (t = −2.018, p < 0.05)
370.1±175.4 431.9 ±152.8 440.9 ± 238.7 2.091 ns 403.0±108.5 (t = 2.626, p < 0.01)
28 248 26 893 22 459 NA 77 600
based on the Bray-Curtis distance. In order to identify any seasonal pattern of species obtained by hierarchical clustering and non-metric multidimensional scaling, an MRPP analysis was conducted on the dataset of each bay considering the calendar seasons. The procedure was the same as the previous MRPP and an agreement statistic (A) was calculated. The seasonal ISA was performed considering each year separately and all years together (Dufrene & Legendre 1997); this ISA was performed separately for each bay.
RESULTS The total number of fish larvae collected at the YRS during the study period was about one-fourth of the total catch at the RIS (Table 1). Mean density was approximately 1.5 times higher at the RIS than at the YRS (Table 1, Fig. 2a). Total taxonomic richness was higher at the RIS with 43 taxa from 32 families; Sciaenidae (5 taxa) and Gobiidae (4 taxa) represented the richest families. Thirty-six taxa were collected at the YRS with representatives of 24 families, with Sciaenidae (8 taxa) and Clupeidae (4 taxa) representing the 2 richest families. In contrast, mean taxonomic richness was higher for most of the study period at the YRS than the RIS (Table 1, Fig. 2b). Mean diversity and mean evenness were also significantly higher at the YRS than at the RIS, and relatively constant throughout the study period (Table 1, Fig. 2c,d). Anchoa spp. was the most abundant taxon at both locations (Table 2). At the YRS,
other dominant taxa in the sample included Microgobius thalassinus, Gobiosoma spp., Micropogonias undulatus, and Brevoortia tyrannus; these 5 taxa, including Anchoa spp. accounted for 94% of the larval fish community (Table 2). The 5 most abundant taxa at the RIS accounted for 97% of the fish community, and included Anchoa spp., M. undulatus, B. tyrannus, Gobiosoma spp., and Paralichthys spp. (Table 2). We found significant differences in larval fish density of common taxa between sites (Table 2). Generally, Anchoa spp., M. undulatus, B. tyrannus, Paralichthys spp., and Menidia sp. had higher abundances at the RIS than at the YRS (Table 2). Conversely, M. thalassinus and Leiostomus xanthurus were significantly more abundant at the YRS, and Symphurus plagiusa, Bairdiella chrysoura, and Hypsoblennius hentz were among the most abundant species at the YRS (Table 2). Within the 15 most abundant species, 3 species were exclusive to the RIS (Ctenogobius boleosoma, Gobionellus oceanicus, and Pseudopleuronectes americanus), and 1 species was exclusive to the YRS (Sciaenops ocellatus; Table 2). The community composition differences between bays were significant in the PERMANOVA (MS = 3.17, p < 0.001). The MRPP analysis also showed significant differences (A = 0.0156, p < 0.001) in community composition between the YRS and the RIS, with B. tyrannus, M. undulatus, and Paralichthys spp. being the indicator taxa at the RIS, whereas 6 other indicator taxa were associated with the YRS (Syngnathus sp., M. thalassinus, S. plagiusa, H. hentz, L. xanthurus, and B. chrysoura).
Mar Ecol Prog Ser 527: 167–180, 2015
172
1.8
a
Shannon-Wiener index
2000
1000
1.2
0.6
0
0
1.2
16
d
b
12
Pielou index
8 4
0.6 0.3
Aug-10
Apr-10
Dec-09
Aug-09
Apr-09
Dec-08
Aug-08
Aug-07
Aug-10
Apr-10
Dec-09
Aug-09
Apr-09
Dec-08
Aug-08
Apr-08
Dec-07
0 Aug-07
0
0.9
Apr-08
Taxa richness (no.)
c
Dec-07
Density of larvae (no. per 1000 m3)
3000
Fig. 2. Temporal variation in the mean values of (a) total larval density (no. per 1000 m3), (b) taxonomic richness (no.), (c) Shannon-Wiener diversity index, (d) Pielou’s evenness index in the Delaware Bay (RIS; Roosevelt Inlet Site, black line) and in the Chesapeake Bay (YRS; York River Site, grey line) between September 2007 and August 2010. Shaded grey areas represent summer and winter periods, unshaded areas represent fall and spring periods. Mean values were obtained by a 5 wk moving average in order to improve clarity of the temporal trends
Table 2. Species rank, mean ± 95% CI densities (no. per 1000 m3), frequency of occurrence (FO, %), and relative species abundance (SA, %) for the 15 most abundant species collected at each site: Chesapeake Bay (York River Site, YRS) and Delaware Bay (Roosevelt Inlet Site, RIS). Taxa in bold have significantly higher densities at the RIS while underlined species have higher densities at the YRS. Mann-WhitneyWilcoxon’s test statistic (W) was used to compare total densities between bays; ns: not significant, *p < 0.05, **p < 0.01, ***p < 0.001 Species
Anchoa spp. Microgobius thalassinus Gobiosoma spp. Micropogonias undulatus Brevoortia tyrannus Leiostomus xanthurus Anguilla rostrata Symphurus plagiusa Syngnathus spp. Paralichthys spp. Menidia sp. Sciaenops ocellatus Bairdiella chrysoura Hypsoblennius hentz Cynoscion regalis Ctenogobious boleosoma Pseudopleuronectes americanus Gobionellus oceanicus Conger oceanicus
Abbreviation
Rank
YRS Total
Anch M.tha Gobio M.und B.tyr L.xan A.ros S.pla Syng Para Meni S.oce B.chr H.hen C.reg C.bol P.ame G.oce C.oce
1 217.96 ± 68.26 2 57.27 ± 27.24 3 53.98 ± 24.90 4 35.32 ±15.13 5 15.88 ± 6.09 6 4.94 ± 4.10 7 4.07 ±1.93 8 2.62 ±1.59 9 2.36 ± 0.77 10 1.61± 0.84 11 1.46 ± 0.87 12 1.00 ± 0.89 13 0.60 ± 0.47 14 0.60 ± 0.23 15 0.59 ± 0.37 – – – – – – (>15) –
FO
SA
90.3 31.6 45.2 58.1 58.1 27.1 40.0 30.3 55.5 28.4 24.5 12.9 8.4 23.2 10.3 – – – –
54.1 14.2 13.4 8.8 3.9 1.2 1.0 0.7 0.6 0.4 0.4 0.2 0.1 0.1 0.1 – – – < 0.1
Rank
RIS Total
1 228.41± 93.64 11 1.43 ±1.08 4 74.13 ± 38.14 2 173.21± 77.25 3 115.13 ± 52.27 7 2.30 ±1.95 6 7.12 ± 2.82 (>15) – 10 1.50 ± 0.44 5 10.10 ± 3.42 9 1.56 ±1.05 – – (>15) – (>15) – 15 0.45 ± 0.41 8 1.75 ±1.75 12 0.70 ± 0.56 13 0.57 ± 0.78 14 0.57 ± 0.37
W FO
SA
63.9 15.5 41.9 58.1 62.6 13.5 41.3 – 44.5 47.7 14.2 – – – 5.2 18.7 8.4 9.7 14.8
36.8 0.2 11.9 27.9 18.5 0.4 1.1 < 0.1 0.2 1.6 0.3 – < 0.1 < 0.1 0.1 0.3 0.1 0.1 0.1
p
9566 0.002** 9756 < 0.001*** 11 840 0.810 ns 14 165 0.005** 14 044 0.008** 10 398 0.004** 12 596 0.406 ns – – 10 794 0.099 ns 15 162 < 0.001*** 10 901 0.041* – – – – – – 11 403 0.096 ns – – – – – – – –
Ribeiro et al.: Larval fish communities in estuaries
The mean annual larval density and evenness index presented little variation among years at both sites (Table 1). The community richness and diversity indices showed no significant annual variation during the 3 yr at the YRS (Table 1) while at the RIS, richness and diversity were significantly higher during the first and second years relative to the second and third years (Table 1). Although considerable mean annual density differences at the species level were observed at each site, the annual densities were significantly different only for very few species. PERMANOVA analysis showed that annual variation was stronger at the RIS (MS = 0.97, p < 0.001) than at the YRS (MS = 0.62, p < 0.05). At the YRS there was little inter-annual variation in taxonomic density; only 3 taxa (Gobiosoma spp., L. xanthurus, and S. plagiusa) showed marginal annual variation (KruskalWallis, p < 0.10, see Tables S1−S3 in the Supplement at www.int-res.com/articles/suppl/m527p167_supp. pdf). The MRPP analysis showed significant community differences at a low level (A = 0.0077, p < 0.021), with M. undulatus as the indicator species. The larval fish community at the RIS comprised more species with significant annual variation of taxonomic densities. B. tyrannus, L. xanthurus, and G. oceanicus had
173
significant variation in annual density (Kruskal-Wallis, p < 0.05, Tables S1−S3), with the density of B. tyrannus being significantly higher for 2007−2008 than in other years at the RIS. Four other taxa (M. undulatus, Paralichthys spp., Menidia sp., and Cynoscion regalis) had marginal differences (KruskalWallis, p < 0.1, Tables S1−S3) in annual densities. The MRPP analysis showed significant differences (A = 0.0148, p < 0.001) in community composition between years at the RIS, with B. tyrannus and M. undulatus as indicator taxa for 2007−2008. Larval fish density varied considerably within the year in both bays (Fig. 2a). At the YRS there was a clear peak in larval fish abundances in late spring to summer. At the RIS there were 2 peaks in larval density: a late spring to summer peak and a fall to winter peak (Fig. 2a). Taxonomic richness also varied consistently by season. At the YRS there were 2 peaks in summer and winter, while at the RIS the highest richness was observed in late summer/early fall and in early spring (Fig. 2b). The increase in taxonomic richness in both bays seemed to be accompanied by a similar pattern of seasonal variation in the community diversity index, with highly diverse communities in winter and summer at the YRS, while at the RIS diver-
Fig. 3. Taxonomic cluster analysis and non-metric multidimensional scaling analysis for (a) Chesapeake Bay (York River Site, YRS) and (b) Delaware Bay (Roosevelt Inlet Site, RIS) for the 15 most abundant taxa at each site collected between September 2007 and August 2010 (155 sampling weeks). In the cluster analysis, ecologically identifiable groups are identified as fall (dark grey), winter (black), spring (white), and summer (light grey). Taxonomic abbreviations are coded as in Table 2
174
Mar Ecol Prog Ser 527: 167–180, 2015
Fig. 4. Relative abundance (%) and mean monthly density (no. per 1000 m3) of the 10 most abundant taxa collected in (a) Chesapeake Bay (York River Site, YRS) and (b) Delaware Bay (Roosevelt Inlet Site, RIS). Note that the top 8 taxa are shared between the 2 locations, and the patterns of Ctenogobius boleosoma and Menidia spp. from the RIS are similar to those of Microgobius thalassinus and Symphurus plagiusa from the YRS
175
2007 2008 2009 2010 Rank Sep Oct Nov Dec Jan Feb Mar Apr May Jun Jul Aug Sep Oct Nov Dec Jan Feb Mar Apr May Jun Jul Aug Sep Oct Nov Dec Jan Feb Mar Apr May Jun Jul Aug YRS Anchoaspp. 1 Microgobius thalassinus 2 Gobiosomaspp. 3 Micropogonias undulatus 4 Brevoortia tyrannus 5 Leiostomus xanthurus 6 Anguilla rostrata 7 Symphurus plagiusa 8 Syngnathussp. 9 Paralichthysspp. 10 Menidiasp. 11 Sciaenops ocellatus 12 Bairdiella chrysoura 13 Hypsoblennius hentz 14 Cynoscion regalis 15 RIS Anchoaspp. 1 Microgobius thalassinus 2 Gobiosomaspp. 3 Micropogonias undulatus 4 Brevoortia tyrannus 5 Leiostomus xanthurus 6 Anguilla rostrata 7 Syngnathussp. 8 Paralichthysspp. 9 Menidiasp. 10 Cynoscion regalis 11 Ctenogobious boleosoma 12 Pseudopleuronectes americanus 13 Gobionellus oceanicus 14 Conger oceanicus 15 Species
sity increased in fall and spring (Fig. 2c). Seasonal patterns of community evenness were distinct for both bays (Fig. 2d); the YRS had higher evenness during winter and lower during spring and summer, while community evenness at the RIS was generally higher in spring and lower during the fall months. The cluster analysis and the nMDS identified seasonal groups of fish larvae occurring at both sites (Fig. 3). At the YRS (Fig. 3a), 2 seasonal groups were evident (from an analysis of the 15 most abundant taxa in the sample). A ‘winter’ group comprising M. undulatus, Paralichthys spp., Anguilla rostrata, B. tyrannus, and L. xanthurus was generally present between October and April (Fig. 4, Table 3). A ‘summer’ group was formed by larvae of obligate estuarine species (Anchoa spp., Menidia sp., Syngnathus sp., H. hentz, Gobiosoma spp., and M. thalassinus) and coastal and lower-bay spawning species (C. regalis, S. plagiusa, and S. ocellatus). The RIS larval fish community comprised 4 different seasonal groups according to the cluster analysis (Fig. 3b). The summer group was formed mainly by obligate estuarine fishes (Anchoa spp., Menidia sp., Syngnathus sp., Gobiosoma spp., and M. thalassinus) and by a coastal spawner (C. regalis). As the year progressed, these species were joined by a fall group that also included C. boleosoma and G. oceanicus; this group occurred predominantly in October (Figs. 3b & 4). A winter group was present between October and April and was composed of shelf-spawned species (B. tyrannus, M. undulatus, Paralichthys spp.) and A. rostrata (Figs. 3b & 4). In May, the larval fish community at the RIS was characterized by 3 species (L. xanthurus, Conger oceanicus, and P. americanus; Fig. 3b, Table 3). The seasonal changes in larval communities seemed to be strong for the 3 yr of data at both sites, with high agreement values obtained from MRPP (A > 0.18, p < 0.001). The ISA (Table 4) showed that for the YRS, the ‘winter’ group could be further divided into a fall-species group
Table 3. Months of occurrence for the 15 most abundant species collected at each site: Chesapeake Bay (York River Site, YRS) and Delaware Bay (Roosevelt Inlet Site, RIS) for the 3 years considered. Months of occurrence were defined by the presence of respective larvae in a given month
Ribeiro et al.: Larval fish communities in estuaries
Mar Ecol Prog Ser 527: 167–180, 2015
176
(M. undulatus), a winter-species group (Paralichthys spp., A. rostrata, B. tyrannus), and L. xanthurus as a spring-species group (often accompanied by B. chrysoura; Table 4). The summer group of the YRS was confirmed with this analysis (Table 4). At the RIS, the ISA found M. undulatus and Paralichthys spp. to be associated with fall species (C. boleosoma and G. oceanicus), and B. tyrannus and A. rostrata to be typically winter species (Table 4). The spring and summer groups were largely the same at this location (Fig. 3b, Table 4).
DISCUSSION The goal of this study was to explore speciesspecific patterns of transport through time between 2 estuaries in the MAB. The difference in proximity from the inlet mouth to the 2 sampling locations may influence the observed composition and structure of the ichthyoplankton communities because factors such as the distance to bay mouths, water circulation patterns, and current speeds affect the transport of early-stage fish into estuarine environments and their mortality (Norcross & Shaw 1984). Future studies must examine how representative each sampling site is relative to the larger estuarine community for their respective bays, and to evaluate the effect of
settlement on the observed seasonal and spatial patterns. However, many of the remaining methodological aspects (sampling timing, frequency, and effort) of this study were standardized among the 3 years of intensive sampling (generally weekly), and therefore can be used to compare general temporal and spatial patterns of ichthyoplankton communities of these 2 locations in the MAB. Our results generally agree with previous studies along the coast of the western Atlantic Ocean (e.g. Allen & Barker 1990, Witting et al. 1999, Love et al. 2009), supporting the observed patterns of ichthyoplankton community composition. Further, we found consistent seasonal assemblages among years with distinct patterns in species abundance at the 2 locations, providing support to this comparison. The larval fish composition observed in both estuaries was similar to previously recorded fish communities of other MAB estuaries (e.g. Great Bay, New Jersey; Witting et al. 1999) and in the coastal lagoon system in Maryland (Love et al. 2009). The larval fish communities in Delaware and Chesapeake Bays were dominated by Anchoa spp., along with a significant component of resident estuarine taxa (e.g. Gobiosoma spp., Syngnathus sp., Microgobius thalassinus). Also, shelf-spawning species (e.g. Micropogonias undulatus and Paralichthys spp.), coastal spawning species (e.g. Brevoortia tyrannus), and
Table 4. Significant indicator species (SIA): taxa that significantly contributed to each seasonal assemblage are shown with marks for each year (1: 2007−2008), (2: 2008−2009), (3: 2009−2010) and all years combined (A: 2007−2010) by location and season for which significant contributions were present. NA: species not abundant; NE: species not existent in the bay; NI: non-indicator species. YRS: York River Site, Chesapeake Bay; RIS: Roosevelt Inlet Site, Delaware Bay Species Fall Anchoa spp. Microgobius thalassinus Gobiosoma spp. Micropogonias undulatus Brevoortia tyrannus Leiostomus xanthurus Anguilla rostrata Symphurus plagiusa Syngnathus sp. Paralichthys spp. Menidia sp. Sciaenops ocellatus Bairdiella chrysoura Hypsoblennius hentz Cynoscion regalis Ctenogobious boleosoma Pseudopleuronectes americanus Gobionellus oceanicus Conger oceanicus
– – – 1, 2,A – – – – – – – – – – –
Winter
YRS Spring Summer
– – – – – – 3 – 1,A – 1, 2 3,A 1, 2, 3,A – – – – – 1, 2, 3,A – – 3 – – – 1, 3, A – – – – NE NE NE NA
1, 2, 3,A 1, 2, 3,A 1, 2, 3,A – – – – 1, 3,A 1, 2, 3,A – 1, 2,A 1, 2, 3,A – 1, 2, 3,A 1, 3,A
Fall
Winter
RIS Spring Summer
– – – – – – 1, 2, 3,A – – 1, 2,A – – – 1, 2, 3,A
– – – – – 1,A –
1, 2, 3,A 1, 2, 3,A 1, 2, 3,A – – – –
– –
– 2, 3,A
– – 2, 3,A – 1, 2, 3,A
2, 3,A – – – –
NA NI 1, 3,A –
2 – NE NA NA
– 1, 2, 3,A – 1,A –
– – – – –
Ribeiro et al.: Larval fish communities in estuaries
ocean-spawning species (e.g. Anguilla rostrata) formed important elements of the larval fish communities in these 2 estuaries. However, the densities at both sites were different for most of the shared taxa (Table 2), which is most likely due to latitudinal differences in species distributions and abundances along the MAB region. These density differences could also be due to the influence of predominant currents (Labrador and Gulf Stream) along the western Atlantic Ocean in the larval transport to the estuaries (Able & Fahay 2010). For instance, the higher larval abundance of Sciaenops ocellatus (a coastal spawner) and Leiostomus xanthurus (a shelf spawner) at the Chesapeake Bay location is likely the result of higher adult abundances in this area (Murdy et al. 1997, Able & Fahay 2010). The higher abundance of adult fish populations of resident species (M. thalassinus and Hypsoblennius hentz) and of estuarine spawners (Bairdiella chrysoura) in the Chesapeake area contribute to the observed differences in larval density found in the current work, in which the larvae of these species were absent or less abundant at the Delaware location (Murdy et al. 1997, Able & Fahay 2010). Conversely, the higher larval abundance of a resident species (Ctenogobius boleosoma) and of an estuarine spawner (Pseudopleuronectes americanus) at the Delaware location is likely due to their distribution patterns and higher abundance in northern areas of the MAB (Able & Fahay 2010). A spatially recognizable pattern was expected given previously documented observations of larval fish communities between North Carolina and New Jersey estuaries (Allen & Barker 1990, Hettler & Chester 1990, Witting et al. 1999). For instance, in estuaries of North Carolina, Mentichirrus sp., B. chrysoura, and L. xanthurus were found to be common and abundant as larvae (Allen & Barker 1990, Hettler & Chester 1990). Conversely, in the Great Bay–Little Egg Harbor system of New Jersey, these sciaenids were not among the most abundant species (Witting et al. 1999). The larval fish assemblages of the Chesapeake Bay and Delaware Bay were distinct in terms of species richness and diversity, although the most abundant and common taxa were generally shared (11 of the 15 most abundant taxa) and showed similarity in their inter-annual variability. The densities of larval fishes varied significantly between the bays for 11 of the 14 taxa depicting spatial differences in terms of larval fish assemblage composition. Annual differences were restricted to a few species (M. undulatus at the YRS and B. tyrannus, L. xanthurus and Gobionellus oceanicus at the RIS). The larval fish community in
177
each bay changes dramatically through the year, with 4 seasonal groups at the RIS and 2 clear seasonal groups at the YRS. The seasonal groups were similar in species composition and dominance between the 2 different sites. During this study, the total number of species observed at the RIS (43) was higher than at the YRS (36), although the mean species diversity, richness, and evenness were higher at the YRS. The close proximity of the RIS to the mouth of the Delaware Bay may have contributed to the high number of total taxa due to the occurrence of both coastal and estuarine spawners, and the occasional occurrence of marine expatriate species. At the RIS, the larval fish community was dominated by few marine taxa appearing in high densities (Tables 1 & 2), while the larval fish community at the YRS was generally dominated by both estuarine-resident and some marine species, observed by high mean diversity at this latter site (Table 1, Fig. 2). The observed total richness at both study sites was similar to that found by Allen & Barker (1990; 45 taxa), but lower than in the study by Witting et al. (1999) in a southern New Jersey estuary (81 taxa) and by Hettler & Chester (1990) in Beaufort Inlet, North Carolina (74 taxa). The observed differences in taxonomic richness between all of these studies likely resulted from different methodologies (sampling and study duration) but also from the geographical sampling location along the MAB (Able & Fahay 2010). The observed differences in abundance in some taxa provide confirmation about the relative distance to the spawning areas of fishes and reflect the distinct geographic distributions of the species collected (Able & Fahay 2010). For instance, Anchoa spp. spawn close to shore (6 to 10 km from the coast) or inside the bay, supporting the marginal density differences of Anchoa spp. at the RIS (higher densities) which is closer to the bay mouth (Luo & Musick 1991, North & Houde 2004). However, the observed difference in density of Anchoa spp. is only slightly different in terms of mean values (Table 1). The lower abundance of shelf-spawners (M. undulatus and Paralichthys spp.) and a coastal spawner (B. tyrannus) at the YRS is likely due to the longer distance between the sampling site and the spawning grounds, allowing larval settlement inside Chesapeake Bay prior to reaching the sampling site (Stegmann et al. 1999). Moreover, northward shifts in the distribution of summer flounder due to climate change result in lower abundances of spawning adults in southern populations (Nye et al. 2009, Pinsky & Fogarty 2012). Sampling-site characteristics could also
178
Mar Ecol Prog Ser 527: 167–180, 2015
explain the abundance differences in some species. For instance, the RIS is located in a narrower channel closer to marsh areas, which is typical of Menidia sp. spawning grounds (Able et al. 2011b). Symphurus plagiusa spawn in deeper waters in the lower bay, and therefore differences in channel morphology between the sites or sampling-site position inside the bay could result in higher larval density of this species at the YRS (Olney 1983, Witting et al. 1999). The larval fish community in both estuaries showed limited inter-annual differences (Tables S2 & S3 in the Supplement), with only 4 taxa (Hippocampus erectus at the YRS, B. tyrannus, L. xanthurus, and G. oceanicus at the RIS) changing significantly in annual density. The inter-annual variation of larval fishes in the MAB estuaries has been documented to occur over decadal periods (Wood 2000, Wood & Austin 2009). For instance, Able & Fahay (2010) reported high interannual variability in larval abundance of B. tyrannus, L. xanthurus, Paralichthys spp., B. chrysoura, and H. hentz, but these differences were only observed in long-term monitoring studies (e.g. Witting et al. 1999). In spite of the short period of sampling of the current study (3 yr), there were clear differences observed in B. tyrannus at the RIS, with record high densities for this region. This inter-annual variability in B. tyrannus larval abundance could result from fluctuations in spawning site locations and differences in transport rates along the MAB, as suggested by Lozano et al. (2012). The present study showed that the overall species composition is predictable between years, as demonstrated by Wood (2000), Allen & Barker (1990), and Witting et al. (1999). The 2 latter studies showed that the inter-annual variability of the larval fish community, however, did not contribute significantly to the total variation in taxonomic density over longer periods of time (e.g. 5 to 6 yr). The results presented here demonstrate clear seasonal groups that varied in density and richness between 2 MAB estuaries. The occurrence of these seasonal groups is generally consistent across years in several estuaries along the MAB (Fig. 3, Table 4; Allen & Barker 1990, Witting et al. 1999, Love et al. 2009). Allen & Barker (1990) observed the occurrence of 2 seasonal groups (summer and winter) in a South Carolina estuary. Those authors observed a summer group dominated by gobiids and clupeids followed by blenniids and sciaenids (C. regalis and B. chrysoura). An initial analysis (Fig. 3a) identified a summer group at the YRS that was similar in terms of taxonomic composition, comprising both resident (gobiids and blenniids) and coastal-spawning taxa (summer sciaenids and Anchoa spp.). The summer
group was also observed at the Delaware Bay site but with fewer taxa and a higher dominance of Anchoa spp. (Fig. 3b, Table 3). This is consistent with Witting et al. (1999), who identified a summer group in which Anchoa spp. was dominant (96% of total abundance). At the YRS, a ‘winter’ group included 5 species and was present between September and May (Table 3). Initially, M. undulatus occurred during the fall, and was followed by the occurrence of Paralichthys spp., B. tyrannus, and A. rostrata during winter months; these species were succeeded by the ‘late-winter’ species L. xanthurus (Table 4, Fig. 4). The general composition of this group was similar to those found in studies of other MAB estuaries but with slight differences in species composition and abundance. The winter group identified at the RIS comprised all 4 taxa identified at the YRS except L. xanthurus (Fig. 3). This is similar to the winter group observed by Witting et al. (1999) in New Jersey. In fact, the remaining 3 seasonal groups at the RIS were similar to those identified in the Great Bay estuary in New Jersey (Witting et al. 1999) and were composed of the same taxa. However, the early spring group observed in New Jersey included P. americanus and Ammodytes sp., whereas for the RIS, P. americanus was associated with Conger oceanicus and L. xanthurus. Similarly, the early summer group identified in New Jersey shared many taxa with the summer group at both study sites (Anchoa spp., Menidia sp., and Syngnathus sp., Witting et al. 1999; Fig. 3). Therefore, the seasonal groups observed at the RIS (northern location of the current study) most closely resemble those observed by Witting et al. (1999) in New Jersey (north of Delaware Bay), while the seasonal groups identified at the YRS (southern location of the current study) were more similar to those observed in southern bays in North and South Carolina (Allen & Barker 1990, Hettler & Hare 1998).
CONCLUSIONS This 3 yr study, with simultaneous sampling in 2 MAB estuaries, provides data on the seasonal patterns of larval fish assemblages and clarifies some aspects of the variation in sources of estuarine larval fish (Able & Fahay 2010). Position of the sampling sites relative to their respective bay mouths, the influence of environment (water temperature, wind angle, river discharge), and oceanic currents may affect the taxonomic composition and structure of larval fish communities (Warlen et al. 2002, Hare et al. 2005, Hare & Able 2007, Love et al. 2009, Schieler et
Ribeiro et al.: Larval fish communities in estuaries
al. 2014). However, the broad seasonal patterns observed in assemblage structure were consistent between sites. Further, longer-term trends (e.g. influence of decadal cycles) are masked by the relatively short timeframe of this study (3 yr). This underscores the need for long-term monitoring programs for larval fishes to better understand trends in variability and how this might relate to other aspects of the population structure for individual species (e.g. recruitment). There are relatively few continuous monitoring programs in the estuaries of the East Coast of North America (Hare & Able 2007, E. Houde pers. comm.); sampling at the YRS from this study has continued to the present day in hopes to fill this void for the southern MAB. The current study suggests a similar pattern of larval fish use of the estuaries for resident and shelfspawning species in Delaware Bay and Chesapeake Bay, although differences in species distribution along the MAB affect annual larval fish composition. Seasonal variation in species composition was strong and consistent across years in both bays. Consequently, the inter-annual variation of larval fish communities from the 2 sites was generally restricted to a limited number of taxa, with the communities themselves maintaining a consistent composition across years. Here we demonstrate that simultaneous larval fish sampling in different MAB estuaries provides significant insight into understanding variability in fish community patterns and the role of these estuaries for fish assemblages.
➤ Able KW, Allen DM, Hare JA, Hoss DE and others (2011a)
➤
➤
➤
➤
➤
➤ ➤
Acknowledgements. F.R. and E.J.H. thank the late John E. Olney for his guidance and supervision of this work. F.R. is very grateful for J. E. Olney’s support during his stay at VIMS. We thank P. McGrath, P. Crewe, B. Watkins, A. Rhea, T. Tuckey, and S. Upton at the York River site and R. Kernehan, B. Schieler, K. Crum, R. Balouskus, A. Hale at the Roosevelt Inlet site for field and lab assistance. We are also thankful to C. Lozano for his constructive comments on earlier drafts of this manuscript. This study was funded by the Virginia Sea Grant (NA07OAR4170047; projects R/CM-28, R/CF-09-01) and Delaware Sea Grant (NA05OAR4171041; project R/ECO-3). F.R. was supported by the Portuguese Science Foundation (SFRH/BPD/46761/2008) from the Programa Operacional Potencial Humano/Fundo Social Europeu (POPH/FSE). This is contribution number 3461 of the Virginia Institute of Marine Science, College of William & Mary.
➤ ➤ ➤
➤
LITERATURE CITED
➤ Able KW, Fahay MP (1998) The first year in the life of estuarine fishes in the middle Atlantic bight. Rutgers University Press, New Brunswick, NJ Able KW, Fahay MP (2010) Ecology of estuarine fishes. The John Hopkins University Press, Baltimore, MD
179
➤
Life history and habitat use of the speckled worm eel, Myrophis punctatus, along the east coast of the United States. Environ Biol Fishes 92:237−259 Able KW, Grothues TM, Rowe PM, Wuenschel MJ, Vasslides JM (2011b) Near-surface larval and juvenile fish in coastal habitats: comparisons between the inner shelf and an estuary in the New York bight during summer and fall. Estuaries Coasts 34:726−738 Allen DM, Barker DL (1990) Interannual variations in larval fish recruitment to estuarine epibenthic habitats. Mar Ecol Prog Ser 63:113−125 Anderson MJ (2001) A new method for non-parametric multivariate analysis of variance. Austral Ecol 26:32−46 Dufrene M, Legendre P (1997) Species assemblages and indicator species: the need for a flexible asymmetrical approach. Ecol Monogr 67:345−366 Epifanio CE, Tilburg CE (2008) Transport of larval forms near large estuaries of the Middle Atlantic Bight: a wet and windy journey. J Mar Res 66:723−749 Fahay MP (2007) Early stages of fishes in the western north Atlantic Ocean. (Davis Strait, Southern Greenland and Flemish Cape to Cape Hatteras). Vols 1 and 2. Northwestern Atlantic Fisheries Organization, Dartmouth Hale EA (2012) Biophysical dynamics of larval fish ingress into Chesapeake and Delaware bays. PhD dissertation, University of Delaware, Lewes, DE Hare JA, Able KW (2007) Mechanistic links between climate and fisheries along the east coast of the United States: explaining population outbursts of Atlantic croaker (Micropogonias undulatus). Fish Oceanogr 16:31−45 Hare JA, Thorrold S, Walsh H, Reiss C, Valle-Levinson A, Jones CM (2005) Biophysical mechanisms of larval fish ingress into Chesapeake Bay. Mar Ecol Prog Ser 303: 295−310 Hettler WF Jr, Chester AJ (1990) Temporal distribution of ichthyoplankton near Beaufort Inlet, North Carolina. Mar Ecol Prog Ser 68:157−168 Hettler WF Jr, Hare JA (1998) Abundance and size of larval fishes outside the entrance to Beaufort Inlet, North Carolina. Estuaries 21:476−499 Houde ED (1997) Patterns and consequences of selective processes in teleost early life histories. In: Chambers RC, Trippel, EA (eds) Early life history and recruitment of fish populations. Chapman & Hall, London, p 173−196 Janzen CD, Wong KC (2002) Wind-forced dynamics at the estuary-shelf interface of a large coastal plain estuary. J Geophys Res 107, C10, 3138, doi:10.1029/2001JC000959 Lenanton RCJ, Potter IC (1987) Contribution of estuaries to commercial fisheries in temperate western Australia and the concept of estuarine dependence. Estuaries 10:28−35 Love JW, Luers DF, Williams BD (2009) Spatio-temporal patterns of larval fish ingress to Chincoteague Bay, Maryland, USA during winter and spring 2004 to 2007. Mar Ecol Prog Ser 377:203−212 Lozano C, Houde ED, Wingate RL, Secor DH (2012) Age, growth and hatch dates of ingressing larvae and surviving juveniles of Atlantic menhaden Brevoortia tyrannus. J Fish Biol 81:1665−1685 Luo J, Musick JA (1991) Reproductive biology of the bay anchovy in Chesapeake bay. Trans Am Fish Soc 120:701−710 Lusk SC, Watkins BE, Rhea A, Dillman CB, Hilton EJ (2014) Occurrence of juvenile Paralichthys lethostigma (southern flounder) in tributaries of Chesapeake Bay. Southeast Nat 13:515−522
180
Mar Ecol Prog Ser 527: 167–180, 2015
➤ Martinho F, van der Veer HW, Cabral HN, Pardal MA (2013)
➤ ➤ ➤
➤
➤ ➤
➤
➤
➤
Juvenile nursery colonization patterns for the European flounder (Platichthys flesus): a latitudinal approach. J Sea Res 84:61−69 McCune B, Grace JB (2002) Analysis of ecological communities. MjM Software Design, Gleneden Beach, OR Murdy EO, Birdsong RS, Musick JA (1997) Fishes of Chesapeake Bay. Smithsonian Institution Press, Washington, DC Norcross BL, Shaw RF (1984) Oceanic and estuarine transport of fish eggs and larvae: a review. Trans Am Fish Soc 113:153−165 North EW, Houde ED (2004) Distribution and transport of bay anchovy (Anchoa mitchilli) eggs and larvae in Chesapeake Bay. Estuar Coast Shelf Sci 60:409−429 Nye JA, Link JS, Hare JA, Overholtz WJ (2009) Changing spatial distribution of fish stocks in relation to climate and population size on the Northeast United States continental shelf. Mar Ecol Prog Ser 393:111−129 Olney JE (1983) Eggs and early larvae of the bay anchovy, Anchoa mitchilli, and the weakfish, Cynoscion regalis, in lower Chesapeake Bay with notes on associated ichthyoplankton. Estuaries 6:20−35 Pielou EC (1966) The measurement of diversity in different types of biological collections. J Theor Biol 13:131−144 Pinsky ML, Fogarty M (2012) Lagged social-ecological responses to climate and range shifts in fisheries. Clim Change 115:883−891 R Development Core Team (2012) R: a language and environment for statistical computing. R Foundation for Statistical Computing, Vienna Ramos S, Cowen RK, Ré P, Bordalo AA (2006) Temporal and spatial distributions of larval fish assemblages in the Lima estuary (Portugal). Estuar Coast Shelf Sci 66:303−314 Richards WJ (2006) Early stages of Atlantic fishes: an identification guide for western central north Atlantic. Taylor & Francis, Boca Raton, FL Schieler BM, Hale EA, Targett TE (2014) Daily variation in ingress of fall-spawned larval fishes into Delaware Bay in relation to alongshore and along-estuary wind components. Estuar Coast Shelf Sci 151:141−147 Schubel JR, Pritchard DW (1986) Responses of upper ChesaEditorial responsibility: Paul Snelgrove, St. John’s, Newfoundland and Labrador, Canada
➤
➤
➤
➤
➤
➤
➤
peake Bay to variations in discharge of the Susquehanna River. Estuaries 9:236−249 Shannon CE, Weaver W (1963) The mathematical theory of communications. University of Illinois Press, Urbana, IL Stegmann PM, Quinlan JA, Werner FE, Blanton BO, Berrien P (1999) Atlantic menhaden recruitment to a southern estuary defining potential spawning regions. Fish Oceanogr 8(Suppl 2):111−123 Sullivan MC, Able KW, Hare JA, Walsh HJ (2006) Anguilla rostrata glass eel ingress into two U.S. east coast estuaries: patterns, processes and implications for adult abundance. J Fish Biol 69:1081−1101 Sullivan MC, Wuenschel MJ, Able KW (2009) Inter and intra-estuary variability in ingress, condition and settlement of the American eel Anguilla rostrata: implications for estimating and understanding recruitment. J Fish Biol 74:1949−1969 Vasconcelos RP, Reis-Santos P, Maia A, Fonseca V and others (2010) Nursery use patterns of commercially important marine fish species in estuarine systems along the Portuguese coast. Estuar Coast Shelf Sci 86:613−624 Warlen SM, Burke JS (1990) Immigration of larvae of fall/winter spawning marine fishes into a North Carolina estuary. Estuaries 13:453−461 Warlen SM, Able KW, Laban EH (2002) Recruitment of larval Atlantic menhaden (Brevoortia tyrannus) to North Carolina and New Jersey estuaries: evidence for larval transport northward along the east coast of the United States. Fish Bull 100:609−623 Witting DA, Able KW, Fahay MP (1999) Larval fishes of a middle Atlantic bight estuary: assemblage structure and temporal stability. Can J Fish Aquat Sci 56:222−230 Wood RJ (2000) Synoptic scale climatic forcing of multispecies fish recruitment patterns in Chesapeake bay. PhD dissertation, College of William and Mary − Virginia Institute of Marine Sciences, Gloucester Pt, VA Wood RJ, Austin HM (2009) Synchronous multidecadal fish recruitment patterns in Chesapeake Bay, USA. Can J Fish Aquat Sci 66:496−508 Zar JH (1999) Biostatistical analysis. Prentice Hall Inc., Upper Saddle River, NJ Submitted: February 21, 2014; Accepted: March 2, 2015 Proofs received from author(s): April 29, 2015