Chapter 1
Compound clustering and consensus scopes of metabolic networks Franziska Matth¨ aus Interdisciplinary Center for Scientific Computing University of Heidelberg, Germany
[email protected] Carlos Salazar Department of Biology Humboldt University Berlin, Germany
[email protected] Oliver Ebenh¨ oh Department of Biology Humboldt University Berlin, Germany
[email protected]
We investigate the structure of metabolic networks by identifying sets of metabolites having a similar synthesizing capacity. We measure the synthesizing capacity of a compound by determining all metabolites that can be produced from it, and call this set the scope of the compound. We then define a distance measure based on the Jaccard coefficient and apply a hierarchical clustering method. Compounds within the same cluster are chemically similar and often appear in the same metabolic pathway. For each cluster we define a consensus scope by determining a set of metabolites that is most similar to all scopes within the cluster. We find that only a few of the resulting consensus scopes are mutually disjoint while others overlap, and some consensus scopes are fully contained in others. Thus, our approach reveals a number of functional subunits of the metabolic network which are arranged into a hierarchical setting.
2
1.1
Introduction
Cellular metabolism is mediated by highly efficient and specialized enzymes which catalyze chemical transformations of substrates into products. Since in general the products of a particular reaction may serve as substrates for other reactions, the entirety of the biochemical reactions form a complex and highly connected metabolic network. With the sequencing of whole genomes of an ever increasing number of organisms and the emergence of biochemical databases such as KEGG [6] or Brenda [8], which are based on genomic information, large-scale metabolic networks have become accessible. Several approaches to analyse the structure of large-scale metabolic networks have emerged in recent years. Graph theoretical approaches have revealed characteristic global features [1]. It was shown that metabolic networks exhibit a small world character [9], possess a scale-free topology [5] and display a hierarchical organization [7]. The representation of a metabolic network as a graph has, however, the disadvantage that during the simplification process information is lost, which makes it impossible to reconstruct the original metabolic network from the graph. We have recently developed a novel strategy for the analysis of large-scale metabolic networks. The so-called method of network expansion [2, 3], which in a natural way links structural and functional properties of metabolic networks, is based on the basic biochemical fact that only those reactions may take place which use the available substrates and that the products of these reactions may in turn be utilized by other reactions. With a number of given substrates (the seed), a series of metabolic networks is constructed, where in each step the network is expanded by those reactions which utilize only the seed and those metabolites which are products of reactions incorporated in previous steps. The set of metabolites within the final network is called the scope of the seed. By construction, the scope describes the synthesizing capacity of a metabolic network when only the seed compounds are available as external resources. In the present work, we aim at elucidating the global organization of functional aspects of metabolism by comparing the synthesizing capacities of the different biochemical compounds. We present several ways to cluster metabolites with respect to their scopes. Based on our observation that many compounds exhibit very similar synthesizing capacities, we introduce the notion of consensus scopes, which characterize the synthesizing capacities of large groups of metabolites. Comparison of the determined clusters as well as the consensus scopes reveal interesting hierarchical structures which shed new light onto the structural organization of large-scale metabolic networks.
1.2
Clustering by principal components analysis
In this section, we characterize all biochemical compounds by their synthesizing capacity. By the synthesizing capacity of a particular metabolite we understand the set of all metabolites which can in principle be synthesized by all available
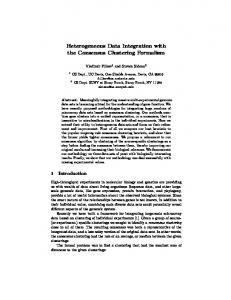
3 enzymatic reactions when exclusively the metabolite itself, water and oxygen are available as substrates. This quantity is determined using the network expansion algorithm as defined in [3] and, following their terminology, will be called the scope of the compound. For our calculations we retrieve a biochemical interaction network from the KEGG database which contains 4811 reactions from over 200 organisms connecting n = 4104 metabolites. For all these metabolites we calculate the scopes resulting in the n-dimensional binary vectors S1 , . . . Sn . The entry of the vector equals 1 if the respective metabolite is in the scope and 0 otherwise. In a first step we apply a common method of dimensionality reduction (principal components analysis, short PCA) [4] and visualize the data by plotting the first versus the second principal component. The result is shown in Figure 1.1, where one can distinguish immediately six well separated clusters. Almost 84% of the scopes are contained in cluster 1, which is made up of small scopes with a size below 70. Only about 16% of the scopes form the remaining 5 clusters. The identification of the compounds of these clusters will follow in Section 1.3. 15 6
10
PC 2
5 2
0 1 4
−5 3
−10 −15 0
5
10
20 PC 1
30
40
Figure 1.1: Result of PCA. Projection of the data onto the two-dimensional space spanned by the first and second principal component. The data points can be grouped into six well distinguishable clusters. The amount of variation contained in the principal components is 63.3% for the first and 20.8% for the second principal component.
It is in principle possible to further divide the clusters into subclusters by reapplying PCA on single clusters. For cluster 6, for example, this results in two subclusters, a larger one containing metabolites with a scope similar to the one of ATP, and a smaller one containing four compounds which all possess the same scope of size 2183. As is known from previous analyses [3], this is the largest existing scope of a single compound, the scope of adenosinephosphosulfate (APS). The problem, however, is that the clustering based on PCA assigns all of the small scopes to the same cluster. The reason is that PCA is based on a Euclidian distance, and therefore two scopes with many zero entries are necessarily similar, even if they do not have a single metabolite in common. In order to achieve a
4 better resolution in the clustering of small scopes we will now derive a distance measure, which compares scopes only according to the similarity in their sets of metabolites, and then apply a hierarchical clustering algorithm.
1.3
Hierarchical clustering
A distance measure which better captures the dissimilarities between small scopes is based on the Jaccard-coefficient. For two scopes Si and Sj , the Jaccard coefficient is given as the ratio between the number of entries that are equal to one in both scopes |Si ∩ Sj | and the number of entries that equal to one in at least one of the scopes |Si ∪ Sj |. With this we define the distance between two scopes as: |Si ∩ Sj | . (1.1) dS (Si , Sj ) = 1 − |Si ∪ Sj | The distance dS is zero if the two scopes are identical, and one if they have no single metabolite in common. We choose a nearest neighbor group-average clustering algorithm [4], a bottom up clustering method where iteratively the elements or clusters with the smallest distance are joined. Group-averaging refers to the method of defining the distance between two clusters based on the distances between the cluster elements. The result obtained in this procedure is a clustering of the data on various scales. During the first iterations only very similar elements obtain the same cluster label and the clustering is very fine. Towards the end elements or clusters with large distances are joint, resulting in a coarse clustering with a smaller number of clusters. For our analysis we choose a scale of clustering where the elements within a cluster have a distance of at most 0.2. This value is chosen because in the range of distance values between 0.1 and 0.2 the number of larger clusters is practically constant, which indicates a certain robustness of the clustering at this scale. Furthermore, the distance value of 0.2 guarantees that elements within the same cluster are indeed very similar. At the chosen scale we find 12 clusters that contain at least 10 elements and label them cluster I to cluster XII. A summary of the clusters is given in Table 1.1. The compounds within a cluster are often chemically similar or appear in the same metabolic pathway, for instance cluster I contains mainly amino acids, cluster V mono- and polysaccharides, and the elements of cluster XI all appear in the pathway of indole and ipecac alkaloid biosynthesis. To relate the results from the two methods (PCA and hierarchical clustering), we color each data point in Figure 1.1 depending to which of the clusters I-XII it belongs. The result is shown in Figure 1.2. It can be seen that some of the clusters determined with the two different methods coincide. Other clusters from PCA are composed of several subclusters. Especially the large cluster of small scopes that was obtained by the PCA approach is now split into a number of subclusters, which proves the success of the hierarchical clustering with distance measure (1.1) in obtaining a better clustering resolution for small scopes.
5
15
III 10
5
IV Small scopes: magenta: V red: VII green: VIII black: XI cyan: X yellow: XII
0
VI −5
green: II black: IX I
−10
−15
0
5
10
15
20
25
30
35
40
Figure 1.2: Clusters obtained from hierarchical clustering. The clusters are plotted in the same two-dimensional space shown in Figure 1.1.
1.4
Consensus scopes
The observation that compounds form clearly distinguishable groups which are characterized by a similar synthesizing capacity suggests that there actually exist only a very small number of really distinct scopes. Even though scopes of different compounds are rarely completely identical, every scope is at least similar to one of a small set of typical scopes. These thoughts lead to the following generalization of the notion of the scope of a compound: Definition of the consensus scope of a cluster. For a cluster of compounds with similar synthesizing capacity, we define the consensus scope by constructing a scope vector c, in which a component is set to one if the corresponding metabolite appears in the majority of the scopes within the cluster and zero otherwise. The sizes of the consensus scopes are also listed in Table 1.1. The consensus scope can be larger, smaller or equal than the cluster size. If the consensus scope is larger or equal the cluster size, then all (or most of) the metabolites from the cluster also appear in the consensus scope. In the original notion of the scope of a compound, the compound is always included in its own scope. When talking about consensus scopes of a cluster, the situation can be different. In the case when the consensus scope is smaller than the cluster size, some of the compounds of the cluster are certainly not contained in the consensus scope. The consensus scopes for each cluster have a different size, but they are not necessarily mutually disjoint. To test for consensus scope overlap, we compute for every pair of consensus scopes i and j the amount of metabolites they have in common and the number of metabolites that are different, and compare these numbers to the consensus scope size. From the mutual overlap of a pair of con-
6 sensus scopes we obtain a scheme showing the consensus scopes in a hierarchical setting (see Figure 1.3).
VII III
V
VI
IV I XII
X
VIII II
XI
IX
Figure 1.3: Consensus scope overlap for the 12 clusters obtained with the hierarchical clustering method.
The largest consensus scope is reached by metabolites from cluster III, which contains organic compounds consisting of heterocyclic bases, sugars and phosphate groups, for example nucleotides, deoxynucleotides (except those with thymine as base), nucleotide sugars, coenzymes except coenzyme A and second messengers such as cAMP. Cluster VI consists predominantly of those deoxynucleotides and deoxynucleotide sugars with thymine as their base. Apparently, since the consensus scope is a subset of the consensus scope of cluster III, their synthesizing capacity is smaller than that of other deoxynucleotides. Yet less can be produced from members of cluster IV which consists mainly of sugar phosphates. This can be explained by the fact that sugar phosphates are chemical groups of metabolites in clusters III and VI, however, from sugar phosphates alone, e. g. nucleotides cannot be produced. Sugars form cluster V. Obviously, since the phosphate group is not available, their synthesizing capacity is even smaller and consequently the consensus scope is completely contained in the consensus scope of cluster IV. Most other inclusion relations can also be explained by the presence or absence of characteristic chemical groups. Interestingly, there are two clusters (VII and XI), whose consensus scopes do not overlap with other consensus scopes. Metabolites within cluster VII are all derived from 20-carbon polyunsaturated essential fatty acids, known as eicosanoids. Our results indicate that only a very special group of chemicals can be produced from them and conversely, those chemicals can exclusively be produced from eicosanoids. Cluster XI represents a group of nitrogen heterocyclic compounds with a the common feature that all contain an indol group. These compounds are involved in the idole and ipecac alcaloid biosynthesis.
7
Table 1.1: Clusters of biochemical compounds determined by a hierarchical clustering algorithm. For each cluster, we list structural categories to which the majority of the cluster members belong, the cluster size and the consensus scope size.
label I II III IV V VI VII VIII IX X XI XII
1.5
cluster elements (representative) organic compounds containing nitrogen organic compounds not containing nitrogen compounds with heterocyclic bases, sugars and phosphate groups sugar phosphates sugars deoxynucleotides and their sugars with thymine as base eicosanoids dicarboxylic acids, ketoacids and hydroxyacids coenzyme A compounds activated forms of terpenes and terpenoids nitrogen heterocyclic compounds with an indol group aromatic organic compounds with a benzene ring
cluster size 261 183
consensus scope size 423 148
102
1549
57 41 34
109 31 283
23 22
23 12
19 13
203 49
12
11
10
9
Summary
By grouping metabolites with respect to their synthesizing capacity, the huge variability of biochemical compounds involved in metabolism can be represented in a relatively concise form. Apparently, there exist only a small number of typical sets of metabolites (the consensus scopes) which can be produced from one single precursor. These sets display a hierarchy which in some cases can be explained by the chemical groups contained in the precursors. In other cases, the underlying chemical reasons for the hierarchical structuring is not so apparent. The hierarchy is a characteristic of the metabolic network comprising all biochemical reactions. The catalyzing enzymes are a product of a long evolutionary process which was governed by selection and mutation principles. In total, they catalyze only a small fraction of all theoretically possible chemical transformations. The analysis of the hierarchical structuring of metabolism may put forth valuable hints on the underlying principles which resulted in the selection of the particular set of enzymatic reactions which is found in contemporary organisms. To further elucidate this problem we plan to expand our analysis to organism
8 specific metabolic networks. The identification of organism specific hierarchies and the comparison among related organisms may further help to understand the principles and selection pressures which guided the evolution of metabolism.
Supplementary Online Material The metabolic network which was retrieved from KEGG and subsequently curated is available as a list of KEGG reaction IDs. A full list of the clusters determined with PCA and the hierarchical clustering method is provided along with a list of all corresponding consensus scopes. Supplementary online information is available for download at http://www.biologie.hu-berlin.de/theorybp/download/clustering.
Bibliography [1] Barabasi, A. L., and Z. N. Oltvai, “Network biology: Understanding the cell’s functional organization”, Nat Rev Genet 5, 2 (2004), 101–113. ¨ h, O., T. Handorf, and R. Heinrich, “Structural analysis of [2] Ebenho expanding metabolic networks”, Genome Informatics 15, 1 (2004), 35–45. ¨ h, and R Heinrich, “Expanding metabolic net[3] Handorf, T., O. Ebenho works: Scopes of compounds, robustness and evolution”, J. Mol. Evol. 61 (2005), 498–512. [4] Hastie, T., R. Tibshirani, and Friedman J. H., The Elements of Statistical Learning, Springer (2001). ´si, [5] Jeong, H., B. Tombor, R. Albert, Z. N. Oltvai, and A.-L. Baraba “The large-scale organization of metabolic networks”, Nature 407 (2000), 651–654. [6] Kanehisa, M., S. Goto, M. Hattori, K. F. Aoki-Kinoshita, M. Itoh, S. Kawashima, T. Katayama, M. Araki, and M. Hirakawa, “From genomics to chemical genomics: new developments in KEGG”, Nucleic Acids Res. 34 (2006), D354–357. [7] Ravasz, E., A. L. Somera, D. A. Mongru, Z. N. Oltvai, and A.-L. ´si, “Hierarchical organization of modularity in metabolic networks”, Baraba Science 297 (2002), 1551–1555. [8] Schomburg, I., A Chang, and D. Schomburg, “Brenda, enzyme data and metabolic information”, Nucleic Acid Research 30, 1 (2002), 47–49. [9] Wagner, A., and D. A. Fell, “The small world inside large metabolic networks”, Proc. R. Soc. Lond. B 268 (2001), 1803–1810.