Comprehensive Performance Monitoring for GPU Cluster Systems Karl F¨urlinger Ludwig-Maximilians-Universit¨at (LMU) Munich Computer Science Department, MNM Team Oettingenstr. 67, 80538 Munich, Germany Email:
[email protected]
Abstract—Accelerating applications with GPUs has recently garnered a lot of interest from the scientific computing community. While tools for optimizing individual kernels are readily available, there is a lack of support for the specific needs of the HPC area. Most importantly, integration with existing parallel programming models (MPI and threading) and scalability to the full size of the machine are required. To address these issues we present our work on monitoring and performance evaluation of the CUDA runtime environment in the context of our scalable and efficient profiling tool IPM. We derive metrics for GPU utilization and identify missed opportunities for GPU-CPU overlap. We evaluate the monitoring accuracy and overheads of our approach and apply it to a full scientific application. Keywords-performance monitoring and analysis; GPGPU computing; NVIDIA CUDA; GPU clusters; efficient scalable monitoring
I. I NTRODUCTION Heterogeneous and accelerator-based systems are gaining a lot of momentum in the high performance computing area. The addition of ECC protection for device memory and a significant boost in double precision floating point performance has rendered NVIDIA graphics cards an attractive building block for supercomputers. As of December 2010 the world’s fastest computer according to the Top 500 list (the Chinese Tianhe-1A system) as well as numerous smaller clusters are equipped with GPUs. Future massively parallel leadership-class systems in the multi-Petaflop range are likely to come with accelerators as well [1]. However, the optimal choice of programming model for heterogeneous accelerator-based systems is quite far from being determined. A developer has several ways to offload all or a portion of their application onto the accelerator. The options range from leveraging accelerated libraries (like CUBLAS, CUFFT, CULA [2], MAGMA [3]), decorating kernels with accelerator pragmas and relying on an accelerator-aware compilation tool-chain (e.g., PGI [4], [5], HMPP [6]), to the manual implementations of kernels specifically tuned for the accelerator, in either CUDA or OpenCL. All of these scenarios require the developer to have solid performance feedback in order to assess tuning opportunities and direct optimization strategies.
Nicholas J. Wright and David Skinner NERSC Lawrence Berkeley National Laboratory Berkeley, California 94720, USA Email: {njwright, deskinner}@lbl.gov
In this paper we describe our work on providing a comprehensive performance monitoring solution for applications executed on GPU clusters in the context of our performance monitoring and analysis tool IPM [7], [8]. We focus on CUDA as we see this framework currently having the most momentum. Our goal is to enable developers who design, adapt, or port their parallel codes to GPU clusters to get feedback from execution at the full scale of machines. Notably, we argue that optimization of individual kernels for a single workstation will not be sufficient for the effective use of accelerators in an HPC setting. We believe that monitoring at the full scale of machines is needed and that the interplay of various levels of parallelism (MPI, OpenMP) and other performance-influencing factors needs to be accounted for as well. Here is a list of some of the issues that a programmer has to address to create a well-performing MPI+CUDA parallel application for GPU clusters 1) Each kernel needs to be optimized for the GPU individually. 2) The scheduling and interaction of multiple kernels has to be analyzed. 3) The load balancing across the MPI processes needs to be checked. As the number of MPI processes increases, the fraction of time spent in computation typically decreases and the MPI communication time increases. A smaller dataset for GPU offloading can also mean that the time to transfer data via the PCIe bus in relation to the GPU compute time changes, and offloading might become less beneficial. 4) While in the sequential case, GPU activity can only be overlapped with other CPU compute activities or file-I/O, in a parallel setting MPI communication with other processes is an additional option. 5) GPU cluster configurations vary widely. In some installations, a single GPU is paired with one or several multi-core CPUs and multiple MPI tasks might have to share the single GPU. In other scenarios a GPU can be exclusive to an MPI task. In the shared GPU case, the kernel performance might be dramatically different in the production MPI case compared to an isolated
workstation setting. 6) There are more factors beyond the immediate control of a developer on large-scale machines. The overall system load, file-system activity, background daemons and stray processes are impossible to predict but influence the application execution. Therefore, the application has to be measured on the actual machine to explain performance and scaling behavior and factor out various influencing factors. Some of these issues, such as (1) and (2) can be addressed with existing tools such as the CUDA profiler or Parallel Nsight. Others such as (3)–(6) can only be analyzed when the parallel application as a whole is taken into account, which is the focus of our work. The main contributions of this article are as follows: • We describe an effective monitoring solution for CUDA, entirely implemented as a thin layer interposed between the application and the CUDA runtime. No source code changes, recompilation, or even re-linking of the application is required. • We show how basic host-side timing can be extended to uncover kernel execution time on the GPU and we define a metric of implicit host blocking time to identify opportunities for overlapped execution. • We provide a monitoring layer for accelerated numerical libraries (BLAS and FFT), to allow developers that try to leverage accelerators through re-linking with optimized libraries to obtain performance information. The rest of this paper is organized in the following way: To set the stage we give a short overview of our existing IPM (integrated performance monitoring) tool set in Section II. Then, Section III describes our monitoring methodology for CUDA in detail. Our approach is based on intercepting the runtime library calls and we show through a series of examples how basic host (CPU) side timing can be augmented to derive valuable metrics about GPU utilization and GPU-CPU interactions. In Section IV we evaluate our approach with respect to monitoring fidelity and overheads with several applications, ranging from small benchmarks to actual scientific applications. We review the related work in Section V and conclude in Section VI. II. A N OVERVIEW OF IPM IPM is a highly scalable workload characterization and performance monitoring tool. Originally focused on MPI, it has recently been extended to cover a number of other domains such as OpenMP and file-I/O [9]. IPM acts as a thin measurement layer between the application and the operating system and runtime. Its goal is to obtain the complete runtime event inventory and to derive high-level application characteristics (such as the communication percentage or the parallel coverage) from it. IPM’s implementation strives to minimize monitoring overhead and application perturbation.
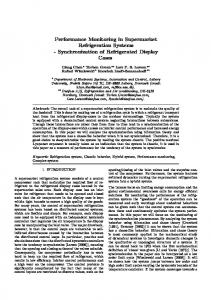
A recent study has shown that the application perturbation is typically less than 0.5% of overall execution time, which is often less than the natural system variability due to system noise. [9] In contrast to a traditional ad-hoc performance analysis setting, this enables a scenario where the monitoring can be activated for each job executed on a high performance cluster. A project investigating this approach is currently under way at the NERSC computing center. CALL BYTES ... 01010 ........... ......101101 128 bit Event Signature (Key) Index i Hash Function
Signature (Key)
#events, tmin, tmax, tavg
... 010...101
728, 3.20, 5.61, 4.41
... Performance Data Hash Table
Figure 1: Event attributes and the hash table used by IPM. During application execution, IPM’s main mechanism for storing data is a central performance data hash table. The structure of the performance data hash table is outlined in Fig. 1. The hash key (also called the event signature) is derived from the type of monitored event (e.g., MPI_Send or fopen) as well as a number of other attributes such as the number of bytes transmitted or read. For each hash table entry IPM stores the number of calls made and the average duration, as well as the minimum and maximum for each call. The output of IPM comes in two forms. Immediately after program termination a profiling banner report is written to stdout. This report summarizes the most important aspects of the execution. IPM also writes a more detailed profiling log in XML format which includes the full details of the hash table. The XML file can then be used by the IPM parser (ipm_parse) to produce a number of different output formats. The parser can re-produce the banner, it can generate an HTML based webpage (which is well-suited for permanent storage of the profiling report), and it can convert the IPM profile into the CUBE format [10]. The last option is a recent addition and is particularly well suited for the interactive exploration of performance data using the CUBE GUI. CUBE is part of the Scalasca tool set [10] and also available for download as stand-alone package[11]. In previous work [9] we have also demonstrated IPM’s scalability up to the full size of current supercomputers (several tens of thousands of cores). III. CUDA M ONITORING WITH IPM The CUDA programming system consists of a compiler (nvcc), a runtime system, and a device driver managing the interaction with the GPU. nvcc translates CUDA kernel code into PTX assembly which is just-in-time compiled for the GPU by the driver. The runtime system manages the memory transfers (which can be either synchronous
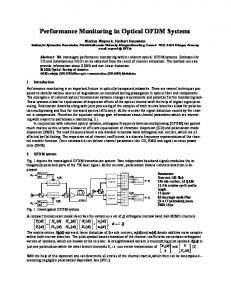
cudaError_t cudaCall(arg1,...) { cudaError_t ret; double begin, end, duration; begin = get_time(); ret = real_cudaCall(arg1,...); end = get_time(); duration = end - begin; UPDATE_DATA(CUDA_CALL_ID, duration); return ret;
#define REPEAT 10000 __global__ void square(double *a, int N) { int i, idx = blockIdx.x; for( i=0; i