Hindawi Advances in Materials Science and Engineering Volume 2017, Article ID 3832072, 10 pages https://doi.org/10.1155/2017/3832072
Research Article Comprehensive Testing Techniques for the Measurement of Shrinkage and Structural Changes of Fine-Grained Cement-Based Composites during Ageing Barbara Kucharczyková, Libor Topolál, Petr Danjk, Dalibor Kocáb, and Petr Misák Faculty of Civil Engineering, Brno University of Technology, Veveˇr´ı 331/95, 602 00 Brno, Czech Republic Correspondence should be addressed to Barbara Kucharczykov´a;
[email protected] Received 6 October 2016; Revised 1 December 2016; Accepted 22 December 2016; Published 15 January 2017 Academic Editor: Rishi Gupta Copyright © 2017 Barbara Kucharczykov´a et al. This is an open access article distributed under the Creative Commons Attribution License, which permits unrestricted use, distribution, and reproduction in any medium, provided the original work is properly cited. The paper deals with an experimental analysis focusing on the utilization of a specific measurement technique for determining the development of shrinkage and for monitoring structural changes in fine-grained cement-based composites during their ageing. Advanced measurement equipment and procedure allowing simultaneous measurement of length changes, mass losses, acoustic responses, and temperature development were designed and verified by the experimental investigation. The main scope of the experiments performed was focused on finding the relationships between the characteristics being investigated while maintaining a uniform test setup. For the purpose of the experimental measurement, three fine-grained cement composite mixtures were designed and manufactured. The mixtures differed in the water-to-cement ratio (w/c) and in the amount of plasticizer. The measurement outputs are presented in the form of diagrams showing the relations between the studied parameters, such as relative length changes, mass losses, temperature progress, and acoustic emission (AE) activity during solidification of the composites. The measurement results showed close relations between the examined characteristics. The progress of relative length changes together with the progress of mass losses and temperature development is reflected in the AE activity. The advanced measurement procedure and technique provided valuable information about the behaviour of cement-based composites during early setting and long-term hardening.
1. Introduction The determination of the volume change development and crack formation in cement-based composites is currently receiving attention from civil engineers and concrete producers. Along with the design of new materials, factors influencing volume changes appear throughout the whole period of their setting and hardening [1, 2]. Progress in technology and the composition of building materials require advancements in test procedures for determining the physical and mechanical parameters of new materials. The current testing approach is based on the earliest possible identification of disruptions in the internal structure of structural elements, which facilitates early diagnostics of the problem allowing relevant precautions to be taken in order to prevent later collapse of the structure being designed.
The reason why this area is being focused on is because many problems with cracking of cement composites arise at early ages [3–5]. In civil engineering, crack formation and propagation are closely associated with tensile strength (the value of which is generally only about 10 percent of that of compressive strength) and with fracture parameters. At early ages, there are internal stresses generated by volume changes but the strength of the element is not yet fully developed. Controlling the variables that affect volume change can minimize high stresses and cracking [4, 6, 7]. Recent measurements suggest the necessity of assessing the magnitude of shrinkage in two consecutive stages of a composite’s ageing, at an early age and at later ages [7–10]. Early-age measurements reveal differences in the development of volume changes as well as differences in the initiation and propagation of cracks which cannot normally be identified with traditional
2 measurement made after specimens have been removed from moulds (typically after 24 hours) [11]. Literature offers a number of approaches to determine the value of cement-based composite shrinkage [12–14]. However, these methods mostly determine separate components of shrinkage at an early age, for example, methods for determining plastic or autogenous shrinkage [5, 6, 9, 13, 15–18] and methods for determining the shrinkage due to drying (defined mainly in the standards of various countries). Contemporary approaches to shrinkage measurement are based primarily on the determination of relative length changes. In most cases, measurement begins after removing specimens from moulds, which is typically no sooner than 24 hours of ageing. In important or complicated concrete structures, such as bridges, suspended slabs, or structures with a complex shape, shrinkage can be measured directly on a concrete element using a special type of wire strain gauge designed to be embedded directly in the concrete. Such gauges are typically fixed to the reinforcement cage of the element by means of rebar extensions [19–23]. Guidelines reflecting recent progress in theoretical and experimental research in the field of cement composite creep and shrinkage (especially concrete) have been published under RILEM TC-242-MDC (chair Zdenˇek P. Baˇzant) [24]. In recent years, the method of acoustic emission (AE) has also been widely used as supplemental measurement in the nondestructive monitoring of changes in a specimen’s internal structure during static and dynamic loading tests as well as for the monitoring of the behaviour of composite materials during setting and hardening [11, 25, 26]. The AE method is considered to be a “passive” nondestructive technique because it usually identifies defects as they develop during the test [27] and allows the monitoring of changes in the behaviour of materials over a long period of time without moving any of their components. This, together with its ability to detect crack propagation taking place not only on the surface but also deep inside the material, makes the technique quite unique. A crack developing in a material is accompanied by the release of stored strain energy, which is then consumed by nucleating new external surfaces (cracks) and emitting elastic waves known as AE waves. The elastic waves propagate inside a material and are detected by an AE sensor. With the exception of contactless sensors, AE sensors are directly attached to the surface [28]. In practice, there are situations where attaching a sensor directly onto the surface is not possible, for example, installation onto a part of an element that is inaccessible or onto a surface which reaches very high temperatures. Detection sensitivity can be increased by using a waveguide. A typical case in civil engineering is the placement of a waveguide into a prepared hole in a fresh composite. An acoustic waveguide is a physical structure for guiding sound waves, that is, a soundpropagation duct that behaves like a transmission line. The duct contains some sound-propagation medium [8].
2. Experimental Part 2.1. Materials. Three fine-grained cement composite mixtures were designed and manufactured for the purposes of the
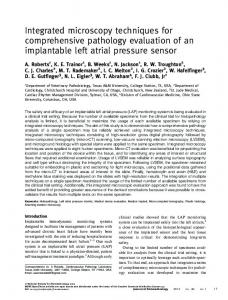
Advances in Materials Science and Engineering experiment. They differed in the water-to-cement ratio (w/c) and in the amount of plasticizer. Compositions of mixtures ˇ are based on the standard CSN EN 196-1 [29]. The fresh composite was made with standardized quartzite sand (maximum ˇ nominal grain size of 2 mm pursuant to CSN EN 196-1 [29]) and CEM I 42.5 R Portland cement and water at a ratio of 3 : 1 : 0.5 (S : C : W), 3 : 1 : 0.47, and 3 : 1 : 0.35 with the addition of SIKA SVC 4035 superplasticizer (polycarboxylate etherbased technology) at an amount of 1% by cement mass. A mixing device with controllable mixing speed was used to prepare the fresh mixtures. Six specimens with the dimensions of 100 × 60 × 1000 were prepared from each mixture. Table 1 shows basic information about the composition, manufacturing, and fresh-state properties. The workability was determined using the flow table with a calibrated scale ˇ designed for the testing of fresh mortars pursuant to CSN EN 1015-3 [30]. Bulk density of the fresh composite was ˇ determined in accordance with CSN EN 1015-6 [31] using a calibrated vessel with the volume of 1 dm3 . 2.2. Test Equipment and Procedures 2.2.1. Determination of Length Changes. The measurement procedure designed to determine the progress of cement composites’ shrinkage was designed to simultaneously record relative length changes, mass losses caused by free drying, temperature inside the tested specimens, and AE activity due to structural changes during solidification. The ambient temperature and relative humidity were also monitored. The measurement of shrinkage was performed using measurement equipment standardized pursuant to the Austrian standard OENORM B 3329:2009-06-01 [32]. Special moulds of 1000 mm in length and with a 60 × 100 mm cross section were used for recording the length changes measured along the central axis of the specimens using an inductive sensor leaning against the movable head of the mould. These moulds are primarily designed for cement composite shrinkage measurement in the early stages of setting and hardening. Special markers designed at the Brno University of Technology (BUT) were used to perform subsequent long-term measurement of relative deformation [33]. These markers were embedded into the upper surface of the cement composite placed in the shrinkage moulds. This way, two gauging bases were created for further measurement (see Figure 1). This arrangement enabled the capture of the total relative length change of the composite since the time at which the composite is placed into the mould until its long-term ageing after the specimen has been removed from the shrinkage mould. Details about the marker types and their drawing and arrangement can be found in [33]. A polyethylene foam mat (MIRELON) of 2 mm in thickness was placed on the bottom and along both sides of the shrinkage moulds in order to ensure that the specimen can move freely in the mould. The shrinkage moulds were filled with a fine-grained cement composite and placed onto a special weighing table that enables continuous recording of mass losses caused by free drying of the specimen surfaces. For more details about the weighing table, see [34].
Advances in Materials Science and Engineering
3
Table 1: Composition and properties of fresh composites. Components and properties
Units
Sand Cement I 42.5 R Water Superplasticizer SVC 4035 w/c ratio Mixing speed Workability Bulk density
kg kg kg % by cement mass — Revolutions/min mm kg/m3
0
Composite ID III
IV
45.9 15.3 7.65 — 0.5 20 140 2200
45.9 15.3 7.16 — 0.47 30 128 2210
45.9 15.3 5.35 1.0 0.35 40 135 2280
2
4 3 5
2
1
5
Figure 1: Arrangement of measurement devices (1: shrinkage mould; 2: weighing table; 3: acoustic emission sensor with a waveguide; 4: temperature probe; 5: markers for long-term measurement).
A thermal sensor COMET was embedded at one end of the shrinkage moulds in order to measure the temperature inside the specimens. The ambient temperature and relative humidity were recorded by an automatic gauging station COMET. This measurement configuration enabled simultaneous measurement of all investigated parameters of the composite placed in a shrinkage mould. The final arrangement of the measurement devices before starting the measurement is shown in Figure 1. Note that the measurement in shrinkage moulds can only be started after the composite has set a little so that the movable head of the mould is not pushed out under the composite’s own weight. Due to the consistency of the fresh composite, measurement was started approximately one hour after the composite was poured into the moulds. The length change was measured on the specimens in the moulds, which were placed on the weighing table standing on hard rubber pads in a climate control chamber at a temperature of 21 ± 2∘ C and relative humidity of 60 ± 10% until the composite was 3 days old. The top surface of the composite was not protected from drying. During this time, the chamber was locked, which prevented people from entering the chamber so that the measurement could continue undisturbed. Also, the shrinkage moulds and all measurement devices were secured against movement. Once early measurement was finished, the specimens were extracted from the moulds, placed on the table, and left
to dry freely in the climate chamber at a stable temperature of 21 ± 2∘ C and relative humidity of 60 ± 10%. The following measurements were performed using a strain gauge which was fixed onto the surface of the specimens. The positions of the gauging points were predefined by the markers embedded at spacing of 200 mm. The specimens were left to dry freely throughout the entire time of the measurement and were weighed at regular intervals. 2.2.2. Determination of Structural Changes by Acoustic Emission Method. Changes in the specimens’ internal structure during the early stage of setting and hardening were monitored using the nondestructive passive method of AE. Magnetic AE sensors (type IDK09 with 35 dB preamplifier) were placed in positions predefined by the embedded steel probes (waveguides) (see Figure 1). Drawing on experience from previous measurements, the threshold was set to the value of 72 𝜇V. The threshold value of the signals was set with the aim of eliminating background noise and recording only the signals produced by the formation of the material’s microstructure and internal cracking. The measurement chain consists of the measurement sensor attached to the waveguide followed by a preamplifier with a gain of 35 dB and finally there is a data recorder with a software preamplifier with a gain of 40 dB. The internal structure changes were monitored with two AE sensors placed in each shrinkage mould: the first one was placed near the movable head (AE2) and the second one was located near the other end of the
4
Advances in Materials Science and Engineering Dynamic modulus of elasticity (N/mm2 )
Compressive strength (N/mm2 )
70 65 60 55 50 45 40 35 30 25 20
3
28 Age of specimens (days)
90
0 III IV
40000 38000 36000 34000 32000 30000 28000 26000 24000
3
28 Age of specimens (days)
90
0 III IV (a)
(b)
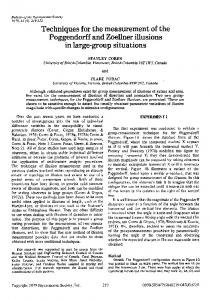
Figure 2: Development of compressive strength (a) and dynamic modulus of elasticity (b) during composite ageing.
mould (AE3). This way, the progress of events occurring during the cement composites’ setting and hardening was recorded continuously. AE signals were being detected for 72 hours by the measuring equipment DAKEL XEDO with two channels. The measurement of AE was started together with the measurement of relative length changes, mass losses, and temperature. To eliminate outside noise, guard sensors were placed on the bottom of the frame of the shrinkage moulds. This setup ensured that AE waves coming from the area being measured hit the sensors on the waveguides before hitting any of the guards. Conversely, waves from outside hit at least one of the guards before hitting the sensors on the waveguides.
3. Results and Discussion The measurement results are presented below. Table 2 and Figure 2 show the development of compressive strength and dynamic modulus of elasticity determined for all the mixtures being examined. The results confirm general presumptions. The highest values of both parameters were found in mixture IV (low w/c with the addition of plasticizer). Concerning shrinkage measurement, the following trends were found. Figure 3 shows the progress of relative deformation and mass losses determined at an early age. The data were obtained from measurements performed on the specimens in shrinkage moulds placed on a weighing table. As shown below, different progress of shrinkage and mass losses were recorded for the mixtures being investigated (see Figure 3). Shortly after the start of the measurement, both mixtures without plasticizer were expanding (length increment), while specimens with plasticizer were shrinking rapidly (see Figure 3(a)). Also, the progress of mass losses recorded within the first 72 hours of ageing is different in mixtures which contain plasticizer and which do not. The mass losses of both composites
without plasticizer are higher than in the case of the composite with plasticizer (see Figure 3(b)). This progression is closely linked with the adjustment of water content. Once plasticizer is added, water content is reduced which influences the progress of volume changes as well as mass losses. Thus, the w/c ratio of the composites without plasticizer was rather high (see Table 1). No component segregation in fresh mixture was observed during either the mixing or the manufacturing of the test specimens. On the other hand, a relatively large amount of water rose to the upper surface of the test specimens after their manufacturing and storing. This phenomenon is commonly known as bleeding [35]. Gradually, during the solidification of the composite, a part of the water evaporates from the specimen surface, causing mass losses, while some amount is drawn back into the pore structure of the composite, contributing to the composite’s expansion [9]. It is known and has been proven by previous experimental measurements [36] that the addition of plasticizer also has a substantial influence on cement hydration. The addition of superplasticizer retards cement hydration and has a critical influence on its overall progress. The margin of hydration retardation is strongly dependent on the amount and properties of the cement and plasticizer used in the composite mixture [37]. The progress of shrinkage corresponds well with the progress of temperature measured inside the test specimens (see Figure 4). In case of composites without superplasticizer, the highest temperature was recorded approximately 11 hours after the start of measurement. At that same time, a surge of expansion (length increment) can be seen as well. This length increment can be ascribed to the cement composites’ thermal expansion. It was proved by earlier measurements that the initial expansion is typical for cement composites with a high w/c ratio [4]. The origin of this expansion is not fully understood and is the object of ongoing research. Similar
Advances in Materials Science and Engineering
5
Table 2: Values of compressive strength and dynamic modulus of elasticity. Age of specimens [days] 28 90 3 28 90 Compressive strength [N/mm2 ] Dynamic modulus of elasticity [N/mm2 ] (standard deviation) (standard deviation) 27.28 36.53 37.62 27340 27735 28693 (1.84) (2.57) (2.32) (669) (724) (492) 30.80 42.38 49.03 29487 30698 31047 (1.92) (4.01) (3.87) (473) (424) (610) 50.61 54.90 62.10 36962 37500 37903 (2.90) (5.49) (5.08) (782) (786) (854) 3
Composite ID
0 III IV
100
0
0 −50
−200
Mass loss m (g/g · 10−4 )
Relative deformation (m/m)
−100
−300 −400 −500 −600 −700
−100
−150
−800 −900 −1000
0
10
20
30 40 Time (hours)
50
60
70
−200
0
10
20
30 40 Time (hours)
50
60
70
m_0 m_III m_IV
_0 _III _IV
(a)
(b)
100 0 −100 −200 −300 −400 −500 −600 −700 −800 −900 −1000
0
10
_0 _III _IV
20
30 40 Time (hours)
50
60
70
25 24 23 22 21 20 19 18 17 16 15
Temperature inside the specimen t (∘ C)
Relative deformation (m/m)
Figure 3: Relative deformations and mass losses measured during the first 72 hours of specimen ageing.
t_0 t_III t_IV
Figure 4: Relative deformations and temperature measured inside the test specimen (during the first 72 hours of specimen ageing).
relationship between temperature and progress of deformation was recorded in the composite with superplasticizer. The presence of the superplasticizer retarded early hydration and delayed temperature growth by approximately 5 hours (in comparison with the composite without the plasticizer). A dormant period accompanied by short expansion during the progress of shrinkage was observed after the maximum temperature was measured. Next progress of shrinkage in all mixtures is affected by the setup of the experiment. Note that in this stage of measurement the test specimens are placed in the shrinkage moulds and only the specimens’ upper surface is not protected from drying. This fact is also reflected in the progress of mass losses whereas the most prominent effect was observed in mixture IV (see Figures 3(b) and 9(b)). Concerning the AE measurement, different results were again obtained for mixtures with and without superplasticizer. The acoustic waves recorded by the measurement
6
Advances in Materials Science and Engineering 100
100
90
0
90
−100
80
−100
80
−200
70
−300
60
−400
50
−500
40
−600
30
40
50
60
70
50
−500
40
−600
−800
20
10
−900
10
0
−1000
−900 20
60
−400
20
−800
10
70
−300
30
30
0
−200
−700
−700
−1000
Relative deformation (m/m)
0
0
10
20
Time (hours) _0 AE2_0 AE3_0
30 40 Time (hours)
50
60
70
Number of AE overshoots (−)
100
Number of AE overshoots (−)
Relative deformation (m/m)
100
0
_III AE2_III AE3_III
Figure 5: Relative deformations and AE overshoots measured during the first 72 hours of specimen ageing for mixtures without a superplasticizer.
equipment were converted to a number of overshoots for the purposes of result interpretation. This number of overshoots indicates the number and size of structural changes taking place within a certain period. Note that there is not a strict relationship between a particular structural change and the number of overshoots. This number can be defined as a relative value relating to the setting of the measurement sensitivity that must always be the same for all measurements performed as part of comparative tests. At the start of measurement, a high number of AE signals’ overshoots exceed the adjusted threshold value (see Figure 5). The high number of AE overshoots is due to the physical and chemical changes which take place in this early setting phase. During the first hours of composite solidification, plastic shrinkage is taking place. The movement of particles and the formation of new hydration products are the primary sources of the acoustic waves’ formation. The data show that, in this early setting phase, the mixture with plasticizer (composite IV, Figure 6) exhibited a lower number of AE overshoots than both mixtures without plasticizer, composites 0 and III (Figure 5). This is closely connected with the w/c ratio and initial bleeding observed in composites without superplasticizer. After the initial setting was finished, no notable structural changes were recorded for the mixtures without plasticizer until 20 hours of age (see Figure 5). The mixture with superplasticizer behaved rather differently; after the initial activity, another acoustic response was recorded at the time of initial temperature growth. Within the same period, a surge of shrinkage was recorded too (see Figures 4 and 6). This behaviour is associated with the low w/c ratio (of mixture IV), retardation of early hydration, and temperature growth due to the presence of plasticizer (as mentioned above). After 20 hours of ageing,
more acoustic activity was recorded again in all the mixtures. Taking into account the fact that all of the composites had hardened by this stage, it is possible that the increased AE activity originated from the creation of microcracks (the highest AE activity recorded in mixture 0 with the highest w/c ratio) and continuing formation of microstructure. Determining whether the AE activity is actually due to the formation of microcracks would require further research to verify that relationship. The lowest AE activity was recorded in mixture IV. This behaviour is connected with the rapid growth of strength which is typical for composites with a low w/c ratio with the addition of a superplasticizer (see Table 2 and Figure 2). The AE responses are also presented in connection with the progress of relative deformations and mass losses of the mixtures. The results are presented in Figures 7(a), 7(b), and 8 showing curves representing the relationship between the relative length changes (𝜀) and mass losses (𝑚) of the specimens during the first 72 hours of ageing together with the AE responses recorded during the same period. Figure 7 shows the results for mixtures without superplasticizer. The graphs show that the progress of the initial part of the 𝜀 − 𝑚 relationship is in both mixtures affected by their initial expansion (length increment) caused by thermal expansion and water reabsorption. Supposing that the increased initial AE activity due to plastic settlement and the initial formation of the composite microstructure are not taken into account, there are two other significant factors which lead to an increase in the AE activity during composite solidification: actual thermal conditions inside the test specimens and rapid changes in the progress of shrinkage.
Advances in Materials Science and Engineering
7 100
0
90
−100
80
−200
70
−300
60
−400
50
−500
40
−600 −700
30
−800
20
−900
10
−1000
0
10
20
30 40 Time (hours)
50
70
60
Number of AE overshoots (−)
Relative deformation (m/m)
100
0
_IV AE2_IV AE3_IV
Figure 6: Relative deformations and AE overshoots measured during the first 72 hours of specimen ageing for mixture with a superplasticizer.
Time (hours) 20
30
40
Time (hours) 50
60
70
100
120
0
10
20
30
40
50
60
80 0
60 40
−50 20
−100
0
−33
−100 −67 −134 Mass loss m (g/g · 10−4 )
0 −167
Relative deformation (m/m)
100 50
70
120 100
50
80 0
60 40
−50
−100
Number of AE overshoots (−)
10
Number of AE overshoots (−)
Relative deformation (m/m)
100
0
20
0
−30
−90 −60 −120 Mass loss m (g/g · 10−4 )
0 −150
/m_III AE2_III AE3_III
/m_0 AE2_0 AE3_0
(a)
(b)
Figure 7: Relationship between deformations and mass losses together with the AE overshoots measured during the first 72 hours of specimen ageing for mixtures without a superplasticizer.
Figure 7(a) shows measurement results for the mixture with the highest w/c ratio. The first appearance of increased AE activity (a high number of overshoots) between 25 and 40 hours of age corresponds to the time when the temperature measured inside the test specimens dropped to its
steady-state value. Within this time period, the temperature no longer contributes to the specimen expansion. The second period with high AE activity is visible at the time when the expansion (length increment) is changed to the shrinkage (length decrement). The curvature of the 𝜀 − 𝑚 relationship
8
Advances in Materials Science and Engineering
4. Conclusion
Time (hours) 100
0
10
20
30
40
50
60
70 120 100
−100
−200 80
−300 −400
60
−500 −600
40
−700 −800
Number of AE overshoots (−)
Relative deformation (m/m)
0
20
−900 −1000
0
−22
−43 −65 −86 Mass loss m (g/g · 10−4 )
0 −108
/m_IV AE2_IV AE3_IV
Figure 8: Relationship between deformations and mass losses together with the AE overshoots measured during the first 72 hours of specimen ageing for mixture with superplasticizer.
is also visibly changed. Similar results were recorded also in mixture III (see Figure 7(b)). Results obtained for mixture IV are rather different because the progress of shrinkage and mass losses were not affected by initial expansion and the temperature growth was delayed due to the presence of superplasticizer. Nevertheless, the results shown in Figure 8 indicate that the increased AE activity corresponds to the changes in curvature of the 𝜀 − 𝑚 relationship. Concerning the results of long-term measurement, it can be stated that the addition of superplasticizer has a substantial influence on the total progress of relative deformations (see Figure 9). The initial rapid growth of shrinkage influences also its final values which are more than two times higher than the values recorded in the cement composite without the superplasticizer with a w/c ratio of 0.5. The period of expansion appears not to be very significant in terms of magnitude. However, the initial expansion delayed the start of shrinkage by more than 20 hours. This delay can be of great benefit to the later development of physical and mechanical properties of cement composites. The total progress of mass losses corresponds well with the water content of the mixtures (see Table 1). The lowest mass loss was recorded in the composite with the superplasticizer with a w/c ratio of 0.35. The relationship between relative length changes and mass losses was observed over the whole time of the cement composite ageing (see Figure 10). However, the initial part of the curve is influenced by water reabsorption and thermal expansion.
The main aim of the experiments performed was to present comprehensive test techniques that can be used for the determination of shrinkage development in fine-grained cementbased composites and for monitoring structural changes throughout their ageing. The experimental investigation made use of advanced measurement equipment and procedure allowing the simultaneous measurement of length changes, mass losses, acoustic responses, and temperature development. The results were compared in terms of the overall behaviour of the studied materials with respect to a uniform setup of the test equipment (accuracy, sensitivity, curing conditions, etc.). Based on the results, it can be stated that the measurement technique described in the paper and used in the experiment fully satisfies the requirements for early-age diagnostics of the material’s behaviour. The measurement of relative length changes together with the recorded progress of mass losses and temperature measured inside the test specimens provided comprehensive information about the behaviour of the material in the early stage of its setting and hardening. The possibility of continuing to measure the relative length changes as well as mass losses of the test specimens, after they were removed from moulds, provided data about the continuous progress of the investigated characteristics during the whole time of the composites’ setting and hardening. The method of acoustic emission appears to be another suitable tool for continuous nondestructive monitoring of the structural changes taking place while the materials solidify. The conclusions presented in the article contain only a small fraction of the information contained in the AE data. The aim of the performed measurements was to compare the results obtained by measurements of three different mixtures manufactured, cured, stored, and measured under the same conditions. In this case, the absolute number of overshoots is not very important. Responses of the changes in the internal structure are strongly dependent on the material’s composition (the same response can induce a different number of overshoots in different materials). More important for the presented measurements was to record the moment and time spectrum (interval) of the overshoots’ appearance. Therefore, it was important to keep the same test setup across all measurements. The possibility of determining the occurrence of microcracks during the setting and hardening of cement composites may be of great use in the early diagnostics of material failures in the future. The number of microcracks present in the cement composites substantially affects their final mechanical properties (i.e., strength, modulus of elasticity, fracture parameters, durability, etc.). The application of the AE method for continuous monitoring of cement composites during the setting and hardening can be useful for early detection of micro disruptions. This information about the behaviour of the material may be later used for improving the material composition or adjusting the curing method which can lead to the design of cement composite structures with better properties. Data obtained from the experiment are of great use in the creation of new and verification of existing computational models designed for the prediction of the
Advances in Materials Science and Engineering
9
0 −50
−200 Mass loss m (g/g · 10−4 )
Relative deformation (m/m)
0
−400 −600 −800 −1000 −1200 −1400
−100 −150 −200 −250 −300 −350
0
10
20
30
40
50
60
70
80
90
−400
0
10
20
30
40
50
60
70
80
90
Time (days)
Time (days) m_0 m_III m_IV
_0 _III _IV
(a)
(b)
Relative deformation (m/m)
Figure 9: Progress of relative deformations and mass losses measured over the whole time of specimen ageing.
Acknowledgments
0
This paper has been written as part of Project no. LO1408 “AdMaS UP, Advanced Materials, Structures and Technologies,” supported by the Ministry of Education, Youth and Sports under the “National Sustainability Programme I.”
−200 −400 −600
References
−800 −1000 −1200 −1400
0
−50 −100 −150 −200 −250 −300 −350 −400 Mass loss m (g/g · 10−4 ) _0 _III _IV
Figure 10: Relationship between deformations and mass losses measured over the whole time of specimen ageing.
progress of volume changes and microcrack development in cement-based composites.
Competing Interests The authors declare that they have no competing interests.
ˇ ıtek, M. Rydval, and J. Kol´ısko, “Volumetric changes of the [1] D. C´ UHPC matrix and its determination,” Applied Mechanics and Materials, vol. 827, pp. 215–218, 2016. [2] X.-M. Kong, Z.-L. Zhang, and Z.-C. Lu, “Effect of pre-soaked superabsorbent polymer on shrinkage of high-strength concrete,” Materials and Structures, vol. 48, no. 9, pp. 2741–2758, 2014. [3] L. Østergaard, L. Damkilde, and H. Stang, Early age fracture mechanics and cracking of concrete: experiments and modelling [Ph.D. thesis], Department of Structural Engineering and Materials, Technical University of Denmark, Supervisor, 2003. [4] A. Bentur, Ed., Early Age Cracking in Cementitious Systems: Report of RILEM Technical Committee 181-EAS ‘Early Age Shrinkage Induced Stresses and Cracking in Cementitious Systems’, RILEM Publications, Bagneux, France, 2003. [5] J. Zhang, Y. Gao, Y. Han, and J. Wang, “Evaluation of shrinkage induced cracking in early age concrete: from ring test to circular column,” International Journal of Damage Mechanics, 2015. [6] PCA: The Portland Cement Association, http://www.cement .org. [7] P. Havl´asek, Creep and shrinkage of concrete subjected to variable environmental conditions. Prague [Ph.D. thesis], Czech
10
[8]
[9]
[10]
[11]
[12]
[13] [14]
[15]
[16]
[17]
[18]
[19]
[20]
[21]
[22]
[23]
Advances in Materials Science and Engineering Technical University in Prague, Faculty of Civil Engineering, Supervisor, Jir´asek Milan, Prague, Czech Republic, 2014. L. Topol´aˇr, P. Mis´ak, D. Koc´ab, and M. Matysik, “Applying method of acoustic emission for monitoring of different concrete mixture during setting and hardening,” Solid State Phenomena, vol. 249, pp. 91–95, 2016. E. E. Holt, “Early age autogenous shrinkage of concrete,” VTT Publications 446, Technical Research Centre of Finland, Espoo, Finland, 2001. “RILEM draft recommendation: TC-242-MDC multi-decade creep and shrinkage of concrete,” Materials and Structures, vol. 48, no. 4, pp. 753–770, 2015. L. Topol´aˇr and L. Pazdera, “Acoustic emission in protected and non-protected concrete during the first 24 hours,” Applied Mechanics and Materials, vol. 578-579, pp. 1149–1152, 2014. J. Newman and B. S. Choo, Advanced Concrete Technology: Concrete Properties, Elsevier, Amsterdam, The Netherlands, 2003. Schleibinger Testing Systems, http://www.schleibinger.com. H. W. Reinhardt and C. U. Grosse, Advanced Testing of Cement Based Materials During Setting and Hardening, RILEM Publications, Bagneux, France, 2005. M. Kratochv´ıl, M. Kadlec, I. Terzijski, and L. Zvol´anek, “Autogenous Shrinkage and its Measurement since the Moment of Concrete Casting. (Autogenn´ı smrˇst’ov´an´ı a jeho mˇeˇren´ı od okamˇziku uloˇzen´ı betonu),” Beton: Technologie, Konstrukce, Sanace, vol. 14, no. 3, pp. 64–67, 2014 (Czech). L. Barcelo, M. Moranville, and B. Clavaud, “Autogenous shrinkage of concrete: a balance between autogenous swelling and selfdesiccation,” Cement and Concrete Research, vol. 35, no. 1, pp. 177–183, 2005. A. M. Soliman and M. L. Nehdi, “Effect of drying conditions on autogenous shrinkage in ultra-high performance concrete at early-age,” Materials and Structures/Materiaux et Constructions, vol. 44, no. 5, pp. 879–899, 2011. A. Mazzoli, S. Monosi, and E. S. Plescia, “Evaluation of the earlyage-shrinkage of Fiber Reinforced Concrete (FRC) using image analysis methods,” Construction and Building Materials, vol. 101, pp. 596–601, 2015. I. Norisham, P. Omenzetter, and P. Lipscombe, “Monitoring system for in-situ measurement of creep and shrinkage effects in a prestressed concrete bridge,” in Proceedings of the 20th Australasian Conference on the Mechanics of Structures and Materials, pp. 767–771, Toowoomba, Australia, 2008. “Creep, shrinkage and durability mechanics of concrete and concrete structures,” in Proceedings of the Eighth International Conference on Creep, Shrinkage and Durability of Concrete and Concrete Structures, Ise-Shima, Japan, 30 September–2 October 2008, R. Sato, K. Maekawa, T. Tanabe, K. Sakata, H. Nakamura, and H. Mihashi, Eds., CRC Press, Boca Raton, Fla, USA, 2009. J. Str´ask´y, M. Zich, and P. Novotn´y, “Bridges with progressivelly erected decks ,” in Proceedings of the CIV-SPRING 2014, pp. 19– 22, Calgary, Canada, 2014. M. Zich, “The concept of a long-term monitoring of highway D47 bridges,” Prague: Czech Concrete Society, vol. 11, no. 4, 2011 (Czech). R. Hof´ırek and M. Zich, “R35 Sedlice-R35 Sedlice-opatovice, construction of the flyover SO 206.2-monitoring of the stress in the load bearing structure,” in Proceedings of the 22nd Concrete ˇ Days 2015, Czech Concrete Society CSSI, Praha, Czech Republic, 2015 (Czech).
[24] RILEM Technical Committee TC-242-MDC, “RILEM draft recommendation: TC-242-MDC multi-decade creep and shrinkage of concrete,” Materials and Structures, vol. 48, no. 4, pp. 753– 770, 2015. [25] A. Carpinteri, G. Lacidogna, G. Niccolini, and S. Puzzi, “Critical defect size distributions in concrete structures detected by the acoustic emission technique,” Meccanica, vol. 43, no. 3, pp. 349– 363, 2008. [26] L. Topol´ar, K. Timcakov´a, P. Mis´ak, L. Topol´aˇr, and K. Timˇcakov´a, “Influence of superplasticizer quantity on formation of micro-cracks during setting and hardening of concretes by acoustic emission method,” Advanced Materials Research, no. 1124, pp. 219–224, 2015. [27] C. Grosse and M. Ohtsu, Acoustic emission testing, Springer, Berlin, Germany, 2008. [28] J. Blitz and G. Simpson, Ultrasonic Methods of Non-Destructive Testing, Chapman & Hall, London, UK, 1st edition, 1996. ˇ [29] CNI, “Methods of testing cement—part 1: determination of ˇ ˇ strength,” CSN EN 196-1:2005, CNI, Prague, Czech Republic, 2005 (Czech). ˇ [30] CSN, “Methods of test for mortar for masonry—part 3: deterˇ mination of consistence of fresh mortar (by flow table),” CSN EN 1015-3:2000, CNI, Prague, Czech Republic, 2000 (Czech). ˇ [31] CSN EN 1015-6:1999, Methods of Test for Mortar for MasonryPart 6: Determination of Bulk Density of Fresh Mortar, This standard is the Czech version of the European Standard EN ˇ 1015-6:1999, CNI, Prague, Czech Republic, 1999 (Czech). [32] OENORM, “Grout—requirements and test methods,” OENORM B 3329:2009-06-01, OENORM, Vienna, Austria, 2009. [33] B. Kucharczykov´a, P. Danˇek, P. Mis´ak, T. Vymazal, and P. Danˇek, “Apparatus for measuring relative deformation of concrete and cement composites,” Czech Republic. CZ 21600 U1 Utility model. Applied 13.10.2010. Granted 12.1.2011. Entered 3.1.2011, 2011, https://isdv.upv.cz/webapp/webapp.pts.det?xprim=1583599&lan=en&s majs=vysok%C3%A9%20u%C4%8Den%C3% AD%20technick%C3%A9%20v%20brn%C4%9B&s puvo=kucharczykov%C3%A1&s naze=&s anot=. [34] T. Vymazal, P. Danˇek, B. Kucharczykov´a, and P. Mis´ak, “Continuous measurement method of cement composite weight losses in early phase of setting and hardening, and apparatus for making the same,” CZ 304898 B6 Patent, Czech Republic, 2015, https://isdv.upv.cz/webapp/webapp.pts.det?xprim=2083317&lan=en&s majs=vysok%C3%A9%20u%C4%8Den%C3%AD% 20technick%C3%A9%20v%20brn%C4%9B&s puvo=vymazal&s naze=&s anot=. [35] Bleeding and segregation. The Concrete Society, http://www .concrete.org.uk/fingertips-nuggets.asp?cmd=display&id=832. ˇ [36] P. Rovnan´ıkov´a and O. Zalud, “Effect of admixtures and fine grain of aggregate on the portland cement hydration,” in Trvanlivost 2015. Brno: Faculty of Civil Engineering, BUT, pp. 123–133, Faculty of Civil Engineering, Brno, Czech Republic, 2015. [37] H. Justnes, E. J. Sellevold, A. Van Gemert, D. Van Gemert, and F. Verboven, “Influence of plasticizers and super-plasticizers on chemical shrinkage of cement,” in Proceedings of the 6th International Conference on Superplasticizers and Other Chemical Admixtures in Concrete, CANMET/ACI SP-195, pp. 601–614, Nice, France, 2000.
Journal of
Nanotechnology Hindawi Publishing Corporation http://www.hindawi.com
Volume 2014
International Journal of
International Journal of
Corrosion Hindawi Publishing Corporation http://www.hindawi.com
Polymer Science Volume 2014
Hindawi Publishing Corporation http://www.hindawi.com
Volume 2014
Smart Materials Research Hindawi Publishing Corporation http://www.hindawi.com
Journal of
Composites Volume 2014
Hindawi Publishing Corporation http://www.hindawi.com
Volume 2014
Journal of
Metallurgy
BioMed Research International Hindawi Publishing Corporation http://www.hindawi.com
Volume 2014
Nanomaterials
Hindawi Publishing Corporation http://www.hindawi.com
Volume 2014
Submit your manuscripts at https://www.hindawi.com Journal of
Materials Hindawi Publishing Corporation http://www.hindawi.com
Volume 2014
Journal of
Nanoparticles Hindawi Publishing Corporation http://www.hindawi.com
Volume 2014
Nanomaterials Journal of
Advances in
Materials Science and Engineering Hindawi Publishing Corporation http://www.hindawi.com
Volume 2014
Journal of
Hindawi Publishing Corporation http://www.hindawi.com
Volume 2014
Journal of
Nanoscience Hindawi Publishing Corporation http://www.hindawi.com
Scientifica
Hindawi Publishing Corporation http://www.hindawi.com
Volume 2014
Journal of
Coatings Volume 2014
Hindawi Publishing Corporation http://www.hindawi.com
Crystallography Volume 2014
Hindawi Publishing Corporation http://www.hindawi.com
Volume 2014
The Scientific World Journal Hindawi Publishing Corporation http://www.hindawi.com
Volume 2014
Hindawi Publishing Corporation http://www.hindawi.com
Volume 2014
Journal of
Journal of
Textiles
Ceramics Hindawi Publishing Corporation http://www.hindawi.com
International Journal of
Biomaterials
Volume 2014
Hindawi Publishing Corporation http://www.hindawi.com
Volume 2014