for IC engine simulations with ECN test cases. T. Lucchini , G. D'Errico ... requisites for CFD codes to be used for the simulation of internal combustion engines. Within this ..... combining python scripts and the snappyHexMesh utility available in ...
R Comprehensive validation of OpenFOAM based libraries for IC engine simulations with ECN test cases
T. Lucchini , G. D’Errico, G. Montenegro, T. Cerri, A. Della Torre, A. Maghbouli, A. Onorati Politecnico di Milano, Dipartimento di Energia, Internal Combustion Engine Group∗
ABSTRACT A comprehensive validation with consolidated experimental databases represents one of the fundamental prerequisites for CFD codes to be used for the simulation of internal combustion engines. Within this context, a significant contribution was provided in the recent years by the Engine Combustion Network (ECN) community: spray and combustion experiments relevant for engine conditions were designed and then performed in different laboratories. Comparison between measured data improves their consistency and availability of different measurement techniques allows a clear understanding of the main physical and chemical phenomena governing fuel-air mixing and combustion processes. Purpose of this paper is the assessment and validation of OpenFOAM based libraries (Lib-ICE) for IC engine modeling using experimental data available within the context of the ECN. Different experiments were simulated including Diesel Spray combustion, fuel-air mixing in GDI sprays and flow in engine geometries. For each of them, this paper presents the developed CFD methodology, the simulation setup and a detailed comparison between computed and experimental data.
Introduction Every CFD code needs to be continuously validated with well verified experimental data. If possible, different measurement techniques must be applied to the same experiment to verify the consistency of the experimental findings and allow to understand possible interactions among the occurring physical and chemical phenomena. To get mutual benefits, experimental and numerical activities should be carried out in parallel, possibly with different institutions, comparing results periodically. This is the objective of the Engine Combustion Network community (www.ca.sandia.gov/ecn), whose purpose is to provide an open forum for international collaboration among experimental and computational researchers applied to engine combustion. ECN is coordinated by SANDIA National Laboratories and it involves different institutions (SANDIA, University of Valencia, Argonne National Labs, GM, IFPEN, TU/Eindhoven, Caterpillar . . . ) performing experiments aiming to achieve a comprehensive characterization of flow, fuel-air mixing and combustion in IC engines. A detailed comparison between the results achieved by different experimentalists on the same configuration ensure data consistency and the outcome of these efforts is a public-domain and comprehensive database which can be used to validate CFD models. Current available experimental data include: • Internal nozzle flow and primary spray atomization; • Fuel-air mixing for direct-injection engines; • Diesel-spray combustion at constant volume conditions; • Flows in real engine geometries. ∗ http://www.engines.polimi.it
Purpose of this paper is to carry out a comprehensive validation of models implemented by the authors in LibICE using experimental data available within the context of the Engine Combustion Network. Lib-ICE is a set of libraries and solvers tailored for IC engine simulation and based on the OpenFOAM technology. It includes algorithms to handle motion of complex engine geometries and suitable models to predict gas exchange, fuel-air mixing and combustion in both CI and SI engines. Application examples of Lib-ICE to different engine configurations are provided in [1, 2, 3, 4]. To the authors’ opinion, validation with ECN data is at the moment a fundamental pre-requisite to demonstrate the predictive capability of any CFD code which has to be employed for simulation of internal combustion engines. Three different topics were chosen in this paper: Diesel spray combustion, fuel-air mixing for GDI sprays and engine flows. For each of them, this work presents the related experiment, the CFD methodology developed for such simulation and a detailed comparison between measured and computed data.
Diesel spray combustion Initially, ECN efforts were mainly focused on Diesel spray combustion [5, 6]. Experiments at constantvolume conditions were carried out to understand effects of fuel, injection pressure and operating conditions on fuel-air mixing, combustion and soot formation. Attention is now mainly dedicated to the so-called Spray-A experiment, where n-dodecane (n-C12 H26 ) is used as fuel and delivered in a constant-volume vessel by means of a vertically mounted, single hole, KS nozzle. The possibility to change injection pressure and ambient conditions (pressure, temperature and composition) makes possible
Injection rate Liquid penetration Vapor penetration Ignition delay Lift-off length Soot volume fraction Mixing Formaldehyde, PAH
Momentum flux Diffused back-illumination, Mie-Scatter Shadowgraph or schlieren imaging Light based (chemiluminescence), pressure based OH chemiluminescence Laser extinction and planar laser-induced incandescence (PLII) Rayleigh scattering PLIF
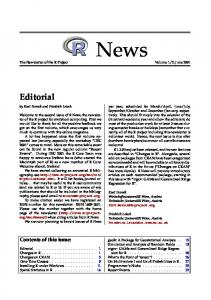
Concerning the simulation setup, a 2D computational mesh was employed, representing 1/72 of the vessel. The radial and axial mesh resolutions are 108 and 216 cells, respectively. Mesh size is minimum at nozzle location (0.12 mm) and it then grows in both directions with a successive ratio of 1.01. Spray is modeled by using the Lagrangian approach, with suitable sub-models for injection, breakup, evaporation and heat transfer. Computational parcels are introduced in the computational domain with the same nozzle diameter and their velocity is estimated from fuel density and injected mass flow rate. The Reitz model is used to compute the initial spray angle, which is function of nozzle L/D ratio, fuel and ambient density. For what concerns spray breakup, the KHRT model was adopted [9], which accounts for both Kelvin-Helmholtz and Rayleigh-Taylor instabilities. Both Reitz injection and KHRT breakup models were implemented by the authors in Lib-ICE. The standard k − ε model was used for turbulence with the C1 constant modified to 1.55 as it is commonly done to predict penetration and diffusion of gas jets. Spray and mesh setup were first tuned by simulating the baseline, non-reacting condition (T = 900 K, ρ = 22.8 kg/m3 , pinj = 150 MPa). Afterwards, many different operating points were simulated to verify the predictive capabilities of the model. Among all those conditions, the one with lower density and higher temperature (ρ = 7.6 kg/m3 , T = 1400 K) was selected here. A rather good agreement was always achieved between computed and experimental data. In particular, Fig. 1 shows that combined effects of temperature increase and density reduction are properly captured by the simulation: liquid penetration is slightly higher since the lower drag force acting on the liquid is compensated by a higher evaporation rate. Due to lower density, vapor penetration increases. Fig. 2 illustrates that the proposed model properly predicts the ambient temperature effects on steadystate liquid penetration when keeping the density and injection pressure constant. This is due to the fact that the
80 ,T= /m 6 kg . 7 ,ρ= 3
Penetration [mm]
Table 1: Spray-A available experimental data and related measurement techniques.
reduction of liquid penetration is caused by the increase of evaporation rate with breakup almost unchanged.
60
0K
140
or
Vap
3
40 or, ρ
.8
= 22
kg/m
,T=
900
K
Vap
20
3
Liquid, ρ = 7.6 kg/m , T = 1400 K 3
Liquid, ρ = 22.8 kg/m , T = 900 K
0 0
0.5
1
1.5
Time [ms]
Figure 1: Validation of spray simulation methodology using the Spray-A experiment. Comparison between computed and experimental data at two different operating conditions: baseline (ρ = 22.8 kg/m3 , T = 900 K, pinj = 150 MPa) and another one with higher temperature and lower density (ρ = 7.6 kg/m3 , T = 1400 K, pinj = 150 MPa). Continuous lines: computed data; dashed lines: experimental data. 24
Experimental Average Liquid Length [mm]
to perform a comprehensive experimental investigation on Diesel spray combustion. Table 1 summarizes the available experimental data and techniques adopted for their measurements [7, 8].
20
Computed
16 12
8 4
0 700
800
900
1000
1100
Ambient Temperature [K]
Figure 2: Effects of ambient temperature on steady-state liquid penetration at constantdensity and injection pressure conditions (ρ = 22.8 kg/m3 , pinj = 150 MPa) Once the spray model was properly validated, combustion simulations were carried out using the multiple Representative Interactive Flamelet model (m-RIF ) which was implemented by the authors in the Lib-ICE code [2, 10]. m-RIF is based on the laminar flamelet concept, assuming that a turbulent diffusion flame can be approximated as an ensemble of stretched counter flow diffusion flames, called flamelets. In the m-RIF model [10], species and energy equations are solved in the mixture fraction space accounting for reactions and mixing. Local chemical composition can be estimated from the Z field in the CFD domain, assuming that its sub-grid distribution can be represented by a β-pdf density func-
Table 2: Simulated reacting conditions for the Spray-A experiment. Injection duration is 4 ms. AR I1 I2 T1 T2 T3 T4 O1 O3 D1 D2
O2 [%] 15 15 15 15 15 15 15 13 21 15 15
Ta [K] 900 900 900 700 800 1000 1100 900 900 900 900
ρ [kg/m3 ] 22.8 22.8 22.8 22.8 22.8 22.8 22.8 22.8 22.8 7.6 15.2
Pinj [MPa] 150 50 100 150 150 150 150 150 150 150 150
A comprehensive validation of the m-RIF combustion model is illustrated in Figs. 3 - 4 comparing computed and experimental data of ignition delay (ID) and flame lift-off length (LL) for the operating conditions listed in Tab. 2. Fig. 3 shows that the m-RIF model properly describe how variation of operating parameters affects ignition delay, which is mainly influenced by kinetics and scalar dissipation rate. Any increase in terms of ambient density, temperature and oxygen concentration makes fuel oxidation faster with a consequent reduction of the ID value: this is correctly predicted by the m-RIF model as it is illustrated in Figs. 3(a),(c),(d). Effects of injection pressure on ignition delay are mainly related on how such parameter affects the evolution of the scalar dissipation rate in the first stages of the fuel-air mixing process. In particular, where ignition takes place there
are higher values of χ when Pinj is lower. This smoothens down chemical reactions and ignition takes place later. ID values are slightly overestimated for any of the tested operating condition, this requires further investigations about kinetic modeling of n-dodecane oxidation. 2
(a)
(b)
(c)
(d) Exp. Calc.
1.6
Ignition Delay [ms]
tion. To this end, transport equations for both Z and ′′ 2 g its variance Z need to be solved and their values are used to compute the scalar dissipation rate parameter χ which governs mixing in the mixture fraction space. In order to properly account for local flow and turbulence effects on the flame structure and predict flame stabilization, a multiple number of flamelets was used. Each one is representative of a certain portion of the injected fuel mass, and chemical composition in each cell is computed from mixture fraction and flamelet marker distribution. Combustion simulations were carried out at different operating conditions which are summarized in table 2, including variations of ambient temperature, density and oxygen concentration. All the simulations were performed using the mechanism proposed by Luo et al. [11] to describe oxidation of n-dodecane (106 species, 420 reactions). For what concerns the m-RIF setup, every 0.1 ms from the start of injection a new flamelet was introduced and initialized with the solution taken from the previous one both in terms of temperature and chemical species distribution in the mixture fraction domain. Suggested definitions from ECN were used to compute ignition delay (time from the start of injection to the time where the maximum rate of maximum temperature rise happens) and flame lift-off length (distance from the injector to the axial position of 2% of its steady-state OH mass fraction).
1.2
0.8
0.4
0 6 12 18 24 50
100 150 13
3 ρamb [kg/m ] pinj [MPa]
17
O2 [%]
21 800
950
1100
Tamb [K]
Figure 3: Comparison between computed and experimental data of ignition delay for the SprayA experiment as function of different operating parameters: (a) ambient density; (b) injection pressure; (c) oxygen concentration; (d) ambient temperature. Thermodynamic conditions affect lift-off and ignition delay in the same way: this is mainly due to the fact that flame stabilizes because of auto-ignition of diffusion flames according to the m-RIF model as discussed in [2]. Figs. 4(a)-(c)-(d) illustrate the rather good agreement between computed and experimental LL values as function of ambient density, oxygen concentration and temperature. Injection pressure and scalar dissipation rate are proportional when the mixture field is fully developed: for high values of Pinj the region where χ is greater than the extinction value is larger, therefore flamelets will ignite at a higher distance from the nozzle. This explains the dependency of the lift-off length on the injection pressure illustrated in Fig. 4(b) which is properly reproduced by the m-RIF combustion model. Satisfactory results were achieved in a very wide range of operating conditions using the m-RIF model, this means that its assumptions in terms of flame structure are suitable to predict Diesel combustion. As a further example, Fig. 5 reports the computed distribution of formaldehyde (CH2 O) and acetylene (C2 H2 , assumed here to represent PAH) at 0.9 ms and 1.6 ms for a simulation whose injection duration is 1.5 ms and ambient conditions are the same labeled as ’AR’ in Tab. 2. Computed ignition delay is approximately at 0.6 ms, which means that a diffusion flame structure is already established at 0.9 ms. The figure also reports the iso-contour of mixture fraction equal to 10-2 , which represents the boundary of the vapor region. The flame stabilizes at a 18 mm distance from the nozzle and liquid spray pene-
tration is approximately 10 mm. The first appearance of CH2 O is approximately at lift-off position in the domain and the shape of its region is similar to a hairpin, with two lobes directed towards the injector. Being an indicator of low-temperature auto-ignition in a stabilized flame, formaldehyde persists also right after the end of injection. Concerning acetylene, it is formed in the high temperature region where CH2 O is consumed. In particular, Fig. 5 displays a clear distinction between regions of maximum CH2 O and C2 H2 at 1.6 ms. Such results are consistent with investigations carried out in [12] and provides a further validation of the proposed approach used to simulate Diesel combustion. (a)
(b)
(c)
(d)
Lift-off length [mm]
60
Exp. Calc.
40
20
0 6 12 18 24 50
100 150 13
3 ρamb [kg/m ] pinj [MPa]
17
21 800
950
1100
Tamb [K]
O2 [%]
Figure 4: Comparison between computed and experimental data of flame lift-off length for the Spray-A experiment as function of: (a) ambient density; (b) injection pressure; (c) oxygen concentration; (d) ambient temperature.
will be also focused on multiple injections and engine combustion. This work illustrates preliminary simulation results of an operating condition with two short injection events (0.5 ms), separated by a 0.5 ms dwell time. No changes were performed in terms of number of flamelets and spray model constants compared to previous simulations. Fig. 6 displays the computed spray distribution (blue) and temperature field at different instants after the start of the first injection (ASOI). Autoignition takes place around approximately 0.6 ms ASOI when first injection is already finished. Reduction of the scalar dissipation rate in the dwell period is responsible for the backward propagation of the flame front towards the injector and this is clearly visible at 1.0 ms ASOI, when the second injection starts. Assuming no interaction between the flamelets belonging to the two different injection events, evolution and ignition of the fuel delivered during the second injection will be mainly affected by the changed thermodynamic conditions inside the vessel. In particular, it is expected that reduced density will increase the vapor penetration. At 1.5 ms, at the end of the second injection, most of the unburned fuel from the second injection is entrained in the already existing flame. The second auto-ignition takes place shortly after. Consistently with experimental observations, future work will be carried out by the authors to understand if it will be necessary to take into account possible interactions between flamelets for a better prediction of the Diesel combustion process when multiple injections are employed. 0.6 ms ASOI
0.7 ms ASOI
1.0 ms ASOI
C2 H2 0.9 ms ASOI
CH2O
1.5 ms ASOI
C2H2 1.6 ms ASOI
1.8 ms ASOI
CH2O 0
20
40
60
80
100
Distance from injector
Figure 5: Computed distribution of formaldehyde (CH2 O) and acetylene (C2 H2 ) mass fractions for the ’AR’ condition. White line: iso-contour of Z = 0.01. CH2 O mass fraction: 0 (blue) - 0.0045 (red); C2 H2 mass fraction: 0 (blue) - 0.014 (red). At next ECN workshop (ECN 4), to be held in Kyoto in Septempber 2015, experiments and modeling efforts
Figure 6: Computed spray evolution (blue dots) and temperature field for the spray A configuration with two injection events (duration 0.5 ms) separated by a 0.5 ms dwell time. Temperature range is 900 (black) - 1500 (white) Diesel combustion in engines will be another important topic: to this end, an optical engine operated at SANDIA will be employed with fuel delivered by means of a three hole injector (Spray-B) whose nozzle geometry is very similar of the one used for the Spray-A experiment.
Spray-B simulations in engine are currently carried out in a spray-oriented mesh representing a 120◦ sector of the combustion chamber as illustrated in Fig. 7.
tion of GDI sprays reproduces rather well the shape of the plumes either in liquid and vapor phase. New operating points at different ambient conditions (low pressure and temperature) together with simulation of spray G in real engine geometries will be matter of validation at ECN 4 workshop. Liquid, exp. Liquid, calc. Vapor, exp. Vapor, calc.
Figure 7: Computational, spray-oriented mesh which will be used for the simulation of the Spray-B experiment in engines.
Fuel-air mixing in GDI sprays In gasoline, direct-injection engines the mixture formation process is affected by injector design (pressure, targeting, nozzle hole geometry) and in-cylinder charge motions. Operating conditions are different compared to the ones encountered in Diesel engines and spray evolution is also influenced by cavitation since sharp-edged nozzles are generally employed. Concerning GDI sprays, ECN efforts were dedicated to the so-called Spray-G experiment, with fuel emerging from a solenoid actuated, 8hole, SVCO (stepped-hole valve covered orifice) injector. Constant-volume conditions are considered with pressure and density values mimicking the ones which are encountered in fully warmed SI engines. The injector nominal included spray-angle is 60 degrees, diameter and length of each hole are 165 µm and 300 µm, respectively [13]. Schlieren and Mie scattering imaging are used to determine the gasoline vapor boundaries while liquid penetration is estimated with the diffused back illumination technique. Over the years, a suitable methodology was developed by the authors in Lib-ICE to model evolution of GDI sprays [1]. Initial droplet size and velocity are computed by means of the Nurick model which account for possible presence of cavitation inside the nozzle. The HuhGosman model was applied to predict initial spray angle and jet atomization in order to consider turbulence and aerodynamic instability effects. Secondary breakup was estimated by means of the Wave model. A single operating point was simulated in this work, ambient conditions are ρ = 3.5 kg/m3 , T = 300◦ C. Injection duration is 0.8 ms. Evolution of the sprays emerging from the 8 holes is modeled in a three dimensional grid. To keep an acceptable mesh resolution, adaptive local mesh refinement was used and the minimum allowed cell size is 1.5 mm, which is consistent with what is generally used in simulation of GDI engines. Computed and experimental penetrations of liquid and vapor are compared in Fig. 8: a rather good agreement was achieved, also considering that the mesh and spray are not aligned. Finally, Fig. 9 compares computed and experimental distributions of liquid and vapor at 0.5 ms ASOI. The proposed methodology for simula-
Figure 8: Comparison between computed and experimental penetration of liquid and vapor for the Spray G experiment. Ambient conditions are: ρ = 3.5 kg/m3 , T = 300◦ C, pinj = 20 MPa. (a) Liquid at 0.5 ms ASOI
Exp.
Calc. (b) Vapor at 0.5 ms ASOI
Exp.
Calc.
Figure 9: Comparison between computed and experimental distributions of liquid (a) and vapor (b) at 0.5 ms ASOI for the spray G experiment.
Engine flows For a successful prediction of the flow and combustion processes, it is necessary to simulate the full-cycle in order to properly account for effects of charge-motions and in-cylinder turbulence on fuel-air mixing and flame propagation phenomena. However, mesh generation is a demanding process and mesh quality drastically affect the simulation results: in particular, bad meshes can vanish the efforts required to run detailed models. In the proposed approach, multiple meshes are necessary to cover the full-cycle simulation with each one valid within a certain crank angle interval. The computed flow field is then interpolated from one mesh to the next one by using an
inverse, distance weighted interpolation technique [4]. To drastically reduce the user time required for grid generation and increase the mesh quality, an automatic mesh generation technique was developed by the authors by combining python scripts and the snappyHexMesh utility available in OpenFOAM. This makes possible to generate grids oriented like the main flow features in a very short amount of time. Fig. 10 illustrates how the method works: from combustion chamber geometry CAD file and main engine data first a geometry oriented blockstructure grid is generated. Such grid is then modified to match the real chamber geometry. Multiple meshes are then generated according to user specified parameters of minimum allowed mesh quality (non-orthogonality, aspect ration, skewness) and maximum duration. 1) Engine geometry and main data
gine simulations using the full set of experimental data available within the Engine Combustion Network. Quality and consistency of available data made possible to extensively verify the developed numerical approaches when applied to target experiments focused on fuel-air mixing, combustion and engine flows. Further suggestions for CFD model improvement and development will be surely provided by the next ECN experiments which will be directly carried out in engine geometries. 10
2) Geometry-oriented block-mesh 3) Flow-oriented grid
0
10
10
20
20
30
30
40
40
50
50
60
10
60
Exhaust Intake
7.5
Lift [mm]
10
0
5
30
20
10
0
10
20
30
30
20
10
0
10
20
30
2.5
0 0
180
360
540
720
Crank Angle [deg]
Bore 80 mm Stroke 60 mm Conrod 160 mm
Figure 10: Automatic mesh generation of flow oriented grids from combustion chamber geometry. Validation of the proposed approach for automatic mesh generation was carried out by simulation of the Darmstadt optical engine [14], whose experimental data are available within the context of ECN. It is a fourvalve, pent-roof engine whose combustion chamber layout (see Fig. 10) is very similar to the one of modern GDI engines. A very detailed characterization of the incylinder flow field (and related fluctuations) is ensured by several PIV measurement techniques: low repetition rate planar PIV, high-speed PIV (HS-PIV), stereoscopic PIV (SPIV), and tomographic PIV (TPIV). Concerning the computational mesh, its size ranges from 0.25 mm in the valve region up to 4 mm in the intake and exhaust ports. Engine speed is 800 rpm, and measured pressure unsteady boundary conditions were imposed at the inlet and outlet boundaries. The reader is referred to [15] for the comprehensive validation of the proposed mesh generation methodology on the Darmstadt optical engine, including the effects of the mesh structure and the advantages of a flow-oriented grid. Here, Fig. 11 provides a comparison between computed and experimental flow fields at 540 CAD (BDC) on the cylinder symmetry plane towards the end of the intake stroke. Simulation correctly reproduce the presence of two main streams due to air entering in the cylinder and the location of the vortex located close to the piston. Within the context of ECN, further validation will be carried out including fuel-air mixing process, different engine speeds and premixed combustion.
Conclusions Purpose of this work was to illustrate the validation of the OpenFOAM based libraries (Lib-ICE) for IC en-
(a)
(b)
Figure 11: Comparison between computed and experimental velocity field at 540CA: a) experimental, b) computed on flow-oriented grid. Experimental data is taken from [14].
Acknowledgments Authors would like to acknowledge all the people who contributed to ECN over the years. In particular, Dr. Lyle Pickett and Scott Skeen (SANDIA National Laboratories), Dr. Scott Parish (GM), Prof. Raoul Payri (CMT Motores Termicos), Dr. Brian Peterson (TUDarmstadt), Prof. David Reuss (University of Michigan).
References [1] T. Lucchini et al. Int. Jou. of Engine Research, 15(5):pp. 581–596, 2013. [2] G. D’Errico et al. Comb. Theory and Modelling, 18(1):65–88, 2014. [3] G. D’Errico et al. Energy & Fuels, 26(7):4212–4223, 2012. [4] T. Lucchini et al. SAE Paper, 2014-01-1131, 2014. [5] C. A. Idicheria and L. M. Pickett. SAE Paper, 2007-010647, 2007. [6] L. M. Pickett et al. SAE Paper, 2005-01-3843, 2005. [7] M. Meijer et al. Atomization and Sprays, 22(9):777–806, 2012. [8] L. M. Pickett et al. SAE Int. Jou. of Engines, 3(2):156– 181, 2010. [9] R. D. Reitz. Atomization and Spray Technology, Vol. 3:pp. 309–337, 1987. [10] H. Barths et al. Int. Jou. of Engine Research, 1 (3):pp. 249–267, 2000. [11] S. Som et al. In Eastern States Section of the Combustion Institute Fall Technical Meeting, 2011. [12] S. A. Skeen et al. Proc. of the Comb. Inst., Vol. 35:pp. 31673174, 2015. [13] S. Parrish. SAE Int. J. Engines, 7 (2):1017–1033, 2014. [14] E. Baum et al. Flow, Turbulence and Combustion, 92(12):269–297, 2014. [15] T. Lucchini et al. SAE Paper, 2015-01-0376, 2015.