Received 4 December 2002; revised manuscript received 24 April 2003; published 29 August 2003. The pressure effects on the stability and energetics of lipid ...
PHYSICAL REVIEW E 68, 021924 共2003兲
Compressing inverse lyotropic systems: Structural behavior and energetics of dioleoyl phosphatidyl ethanolamine Michela Pisani,1 Theyencheri Narayanan,2 Giordano M. Di Gregorio,1 Claudio Ferrero,2 Stephanie Finet,2 and Paolo Mariani1 1
Istituto di Scienze Fisiche and INFM, Universita` di Ancona, Via Ranieri 65, I-60131 Ancona, Italy 2 European Synchrotron Radiation Facility, Boıˆte Postale 220, F-38043 Grenoble Cedex, France 共Received 4 December 2002; revised manuscript received 24 April 2003; published 29 August 2003兲 The pressure effects on the stability and energetics of lipid phases in the L-␣-dioleoyl phosphatidyl ethanolamine 共DOPE兲–water system are presented. Using synchrotron diffraction experiments, performed at a wide range of concentrations, pressure-induced transitions from the inverse hexagonal (H II) to the lamellar L ␣ phase and from the L ␣ to the lamellar L  phase are demonstrated. Moreover, in the most dehydrated samples an intermediate phase is found between the H II and the L ␣ phases, confirming that the lamellar-to-nonlamellar phase transition occurs through key intermediate structures. Simple molecular packing arguments lead to an interpretation of the phase behavior: in fact, pressure induces a progressive stiffening of the DOPE hydrocarbon chains and a reduction of the cross-sectional area. Because pressure is more effective in reducing the cross-sectional area near the terminal methyl groups than at the water-lipid interface, the curvature of that interface in the H II phase is reduced during compression. The work of isothermal compression was then obtained and analyzed in terms of the elastic energetic contributions that should stabilize the DOPE phases during compression. As a result, we observe that the isothermal lateral compression modulus is almost independent of concentration, but it increases as a function of pressure, suggesting that the DOPE repulsion becomes very strong while the whole lipid shape becomes more cylindrical. On the other hand, the bending rigidity is observed to decrease with increasing pressure, while the spontaneous curvature becomes less negative. This suggests that the chain repulsion becomes relatively weaker, and thus less efficient in balancing the torque of head-group repulsion, as the order parameter increases. DOI: 10.1103/PhysRevE.68.021924
PACS number共s兲: 87.14.Cc, 61.30.St, 61.30.Cz, 91.60.Gf
INTRODUCTION
In addition to the obvious biotechnological 共e.g., food processing 关1兴兲 and physiological 共e.g., marine biotopes 关2兴兲 interest in analyzing the biological properties of lipid systems at high pressure, there is general physicochemical interest in using pressure as a thermodynamic variable for determining the structural properties and stability of lipidic mesophases 共including model membranes兲 关3,4兴. Several 共in some cases unusual兲 features have in fact been observed. During compression, lipids adapt to volume restriction by changing their conformation and packing: since a delicate balance of competing energetic contributions is involved in stabilization of lipidic phases, such small changes in conformation determine large structural transformations. It has been observed that pressure induces lamellar-to-gel phase transitions in pure phosphatidylcholine-water dispersions 关5兴, an inverse hexagonal-to-lamellar phase transition in dioleylphosphatidylethanolamine–water dispersions 关6,7兴, and cubic-to-cubic and cubic-to-lamellar phase transitions in the monoolein-water system 关8 –10兴. Moreover, it has also been observed that transition temperatures related to nonlamellar phases are very sensitive to pressure 关3,4,7–11兴. Concerning the structural parameters, a striking feature seems to characterize inverse nonlamellar phases: the unit cell compressibility is usually negative 共i.e., under compression, the unit cell dimension increases兲 关7–12兴. Moreover, in excess water, the increase in the lattice constant is larger than that observed in less hydrated conditions, suggesting that a 1063-651X/2003/68共2兲/021924共11兲/$20.00
change in the hydration level should be associated with a variation of the basic geometrical shape of the lipid molecule 关7,8,10兴. As a consequence, the pressure-induced phase behavior appears strongly dependent on hydration: in monoolein, the Pn3m bicontinuous cubic phase transforms into a lamellar phase during compression in excess of water, while a bicontinuous Ia3d cubic structure forms from the Pn3m phase in less hydrated conditions 关10兴. This finding further confirms the general hypothesis that the Ia3d phase never forms as an equilibrium excess water phase for any single-component system, and also underlines that the presence of water in excess makes an interesting and complex system in a lyotropic dispersion. As recently demonstrated, the energetics and stability of lipidic phases can also be derived from high-pressure measurements 关9–11兴. In particular, in the monoolein-water system, the absence of a pivotal surface in the Pn3m bicontinuous cubic phase was considered to be an indication that the lipid-water interface is bending and stretching simultaneously as a function of pressure 关10兴. Using a simple free energy model based on curvature elastic contributions, it was shown that in monoolein the spontaneous curvature H 0 tends to zero when the pressure increases, while the ratio between the monolayer saddle splay modulus and the monolayer splay modulus k G /k increases up to unity. Moreover, it was derived that the curvature elastic energy is reduced progressively as a function of pressure, indicating that in these conditions the curvature elasticity does not dominate the total free energy. Therefore, analysis of the concentration-pressure
68 021924-1
©2003 The American Physical Society
PHYSICAL REVIEW E 68, 021924 共2003兲
PISANI et al.
phase behavior can help to disentangle different free energy contributions in the theoretical model for lipidic phases. Phosphatidylethanolamines have been the object of extensive studies, both at ambient and at high pressure, mainly because they exhibit stable or metastable lamellar-tononlamellar phase transitions 关5,7,13–15兴. In particular, at ambient pressure and room temperature, L-␣-dioleoyl phosphatidyl ethanolamine 共DOPE兲 forms an inverse hexagonal H II phase, which is stable at all concentrations. On cooling, DOPE in excess of water forms a lamellar L ␣ phase at T h ⬇10 °C and a lamellar L  phase at T m ⬇⫺6 °C 关14,15兴. Under mechanical pressure, both transitions occur at higher temperatures 关7兴: in particular, pressure dependencies dT m /d P⫽0.14 °C/MPa 共significantly lower than the 0.22 °C/MPa observed for saturated phospholipids 关4兴兲 and dT h /d P⫽0.44 °C/MPa have been reported 关7兴. Accordingly, structural studies on DOPE dispersed in excess of water showed that pressure forces a closer packing of the lipid chains, which results in a decreased number of gauche bonds and kinks in the chains 关3兴. At the H II-L ␣ phase transition, high-pressure dilatometry also reveals changes in the specific volume 关7兴. In particular, the transition volume decreases as the pressure is increased: the volume changes involved in this topological transition are at least an order of magnitude smaller than the changes observed at the chain melting transition, suggesting that under compression large structural transformations follow small changes in overall volume 关7兴. Motivated by the fascinating structural properties of inverse lipidic phases under pressure 关8,9兴 and by the absence of information on the pressure effects in dehydrated DOPE, we decided to investigate by x-ray diffraction the DOPEwater system over a large concentration range. The results confirmed a general finding for inverse phases 关4,8,9兴: the unit cell dimension increases during compression at all hydrations, even though the increase in the lattice size is remarkably smaller than that observed in excess water conditions 关7兴. In the less hydrated samples, we observed the occurrence of an intermediate phase at the H II-to-L ␣ phase transition. Even though the phase identification was not possible, this observation is remarkable, because it confirms that the lamellar-to-nonlamellar phase transition occurs through key intermediate structures: in metastable conditions, a cubic structure has been suggested to arise from topological defects of the membrane surface 关7,16,17兴; in stable conditions, a stalk structure, similar to the commonly postulated interbilayer state that is crucial to membrane fusion, has recently been described 关18,19兴. A basic model for lipid compression was then derived: pressure increases the lipid chain order parameter, modifying the overall shape of the molecule and hence producing a decrease of the curvature of the polarapolar interface. We also show that information on the energetics of the system can be obtained by modeling the work of isothermal compression through different elastic energy contributions. MATERIALS AND METHODS
L-␣-dioleoylphosphatidylethanolamine was obtained from Sigma Chemical Co. 共99% purity兲. The DOPE was dissolved
in chloroform and then the solvent was removed under vacuum. The lipid was then hydrated in 2 mM TES buffer (pH 7.3兲 in different concentrations and equilibrated for 24 h at 25 °C 关14兴. The final sample concentration ranges from c ⫽0.67 to 0.9, c being the weight fraction of lipid in the mixture. No water loss was detected before the hydrated lipids were mounted into the pressure cell. Moreover, after the x-ray scattering experiments, the water composition of each sample was checked again by gravimetric analysis. The difference between the nominal concentration and the one measured after the pressure cycle was detected to be within the limit of the experimental errors. From the nominal composition, the sample lipid volume fraction lip was determined using
lip⫽
c , c⫹ 共 1⫺c 兲共 wat / lip兲
共1兲
where lip and wat are the specific volumes of DOPE and water, respectively. For high-pressure data, the volume concentrations were corrected considering the pressure dependence of the densities reported in Ref. 关20兴 for water and by Gruner and co-workers for DOPE 关7兴. Diffraction experiments were performed at the ID02 beamline at the European Synchrotron Radiation Facility, ESRF, Grenoble 共France兲, using a small-angle–wide-angle x-ray scattering 共SAXS-WAXS兲 setup 关21兴. The wavelength of the incident beam was ⫽0.1 nm and the investigated Q range was from 0.25 to 5.5 nm⫺1 (Q⫽4 sin /, where 2 is the scattering angle兲 on the SAXS detector and from 4.5 to 21 nm⫺1 on the WAXS detector. For high-pressure measurements, a NovaSwiss pressure-control system was used. The pressure cell has two diamond windows 共3.0 mm diameter and 1 mm thickness兲 and allows one to measure diffraction patterns at hydrostatic pressures up to 300 MPa. X-ray diffraction measurements were performed at 25 °C for different pressures, from 0.1 to about 220 MPa, with steps of about 10 MPa. To avoid radiation damage, the exposure time was 0.2–1 s/frame, and a fast beam shutter was used to protect the sample from irradiation when data were not acquired. Particular attention has been devoted to checking for equilibrium conditions and to monitoring radiation damage: measurements were repeated several times 共up to ten兲 at the same constant pressure to account for the stability in position and intensity of the Bragg peaks. Accordingly, a gentle compression of the sample, at a rate of 0.05–0.2 MPa/s, was sufficient to establish equilibrium conditions, including in the regions of phase coexistence. In all cases, once the pressure is stabilized 共in a few minutes兲, measurements were repeated at least twice, with an interval of about 5 min. Because the scattering was isotropic, data corrected for background, detector inhomogeneities, and sample transmission were radially averaged. In each experiment, a number of sharp reflections and a diffuse band were detected in the low- and wide-angle regions, respectively, and their spacings measured following the usual procedure 关22兴. SAXS profiles were indexed considering the different symmetry systems commonly observed in lipid phases 关22,23兴: the indexing problem was easy to
021924-2
PHYSICAL REVIEW E 68, 021924 共2003兲
COMPRESSING INVERSE LYOTROPIC SYSTEMS: . . .
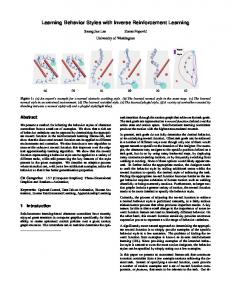
FIG. 1. Selected small-angle x-ray diffraction patterns measured at different pressures from DOPE samples at three concentrations. Pressures and concentrations and the peak indexing are reported. In the case of the intermediate phase, the symmetry is undetermined 共see text兲.
solve, because samples showed two different series of lowangle Bragg reflections, which were indexed according to the one-dimensional lamellar symmetry 共spacing ratios 1:2:3...兲 and to the two-dimensional hexagonal space group 共spacing ratios 1:): 冑4: 冑7...). However, in the less hydrated conditions, a few extra peaks were observed at moderate pressures, indicating the presence of at least an intermediate phase: because of the small number of peaks 共four, in the best cases兲, its symmetry remained undetermined. A possible indexing was obtained by considering the Ia3d cubic symmetry 共spacing ratios 冑6: 冑8: 冑20: 冑22 关22兴兲, but it has to be considered only tentative. The dimension of the unit cell was then calculated from the peak positions. In the following, a indicates the dimension of the unit cell in the hexagonal 共and cubic兲 phase and d that of the lamellar phase. In the wide-angle region, the diffuse band detected at all concentrations for pressures lower than about 200 MPa indicating the disordered 共type ␣兲 nature of the lipid short-range conformation. However, at higher pressures, the WAXS profile showed the presence of a narrower band, which proved the occurrence of a fluid-gel transition 共i.e., ordered  conformations of the DOPE chains兲.
⬎0.85. As a function of pressure, phase transitions are indicated by changes in the diffraction pattern. The pressureconcentration phase diagram derived from the diffraction data is then shown in Fig. 2. The phase behavior can be described considering different concentration regimes. At high hydration (c⭐0.8), compression was observed first to determine the displacement of the H II characteristic peaks to lower Q values 共see Fig. 1兲 and then, at about 60–20 MPa 共the value depends on concentration; see Fig. 2兲, to induce the decrease of their intensity and the appearance of a series of reflections that are characteristic of a lamellar phase. The hexagonal diffraction peaks were observed to completely disappear at 160–100 MPa 共still in dependence on concentration; see Fig. 2兲. Because no changes were detected in the WAXS profile, the lamellar phase was inferred to be L ␣ . On further compressing the samples, no more changes in the L ␣ peak intensity were detected, even if their spacing moves toward lower Q values.
RESULTS
The DOPE-water system was investigated at 25 °C on a range of concentrations from c⫽0.65 to 0.90. At each concentration, diffraction patterns were recorded from atmospheric pressure to 220 MPa. A few low-angle x-ray diffraction profiles obtained at different pressures for three different concentrations are reported in Fig. 1. At ambient pressure, the x-ray data confirm the presence of the H II phase in the concentration range from full hydration to c⬇0.75. As already reported 关14兴, a lamellar phase forms at this concentration, while a pure hexagonal phase occurs again at c
FIG. 2. Pressure- and concentration-dependent phase diagram of DOPE. Bars account for the experimentally measured extension of the two-phase regions. The intermediate phase is indicated as I.P., as its symmetry remains undetermined 共see text兲.
021924-3
PHYSICAL REVIEW E 68, 021924 共2003兲
PISANI et al.
At about 210 MPa, the formation of a lamellar L  phase was detected, as demonstrated by the presence of a narrow band in the WAXS profile and by the appearance in the low-angle region of a second series of reflections that can be indexed considering a one-dimensional symmetry. At intermediate concentrations (0.85⭓c⭓0.80), the hexagonal and lamellar phases were observed to coexist in equilibrium already at atmospheric pressure. Under compression, the hexagonal phase was detected to disappear at about 80 MPa 共see Fig. 2兲, while the L  phase formed at 210 MPa. At low hydration (c⭓0.85), the structural behavior was different. At low pressure, a reentrant hexagonal phase was detected. At about 20–50 MPa 共the value depends on concentration; see Fig. 2兲 a few additional reflections, which indicate the presence of at least an intermediate phase, were observed: the intermediate phase appeared to coexist with the hexagonal phase at the lower pressures, and with the lamellar L ␣ phase at the higher pressures. The system was biphasic up to about 180 MPa, and then only the lamellar L ␣ phase was detected. It should be noticed that the lattice symmetry of the intermediate phase cannot be assigned, as only four peaks have been observed in the best cases. Even if their spacing could indicate the presence of a cubic phase of Ia3d symmetry, a stalk structure of rhombohedral symmetry 共space group R3 关24兴兲 has recently been described at the lamellar-to-nonlamellar phase transition 关18兴. Because no apparent relation between the two lattice constants in the stalk structure has been found 关18,24兴, we cannot prove its presence by peak indexing, but it is highly possible that a similar structure also forms in the present case. Some examples of the pressure dependence of the unit cell dimensions, measured in the different phases, are reported in Fig. 3 共for the sake of completeness, the unit cell dimensions shown for the intermediate phase have been calculated assuming the Ia3d cubic symmetry兲. As a general result, it can be observed that the lattice dimension increases as a function of pressure at all the investigated concentrations. The dependence is rather linear in the range where only one phase exists, while a quadratic dependence is clearly detected in the biphasic regions 共this is particularly evident in the H II phase兲. This behavior suggests that in the biphasic region a continuous compositional change occurs, perhaps due to changes in the DOPE hydration level. Because of the constant sample composition, the large variation detected in the hexagonal unit cell could be indicative of a larger water uptake in this phase. A linear fit to the lattice dimensions measured on singlephase domains has been used to calculate the unit cell pressure dependence da/d P. From the results reported in Fig. 4, it can be observed that in the L ␣ phase the da/d P parameter is independent of concentration. Remarkably, the average value of 1.3⫾0.2 nm GPa⫺1 共i.e., 1.3 Å kbar⫺1兲 is very similar to that observed in the lamellar phase of monoolein, 1.0 ⫾0.1 nm GPa⫺1 关9兴. In the H II phase, the average unit cell pressure dependence is 1.6⫾0.5 nm GPa⫺1 , but a value of 3.4⫾0.2 nm GPa⫺1 was detected in the most hydrated sample (c⫽0.678). Note that an increase of a by about 10 nm GPa⫺1 was previously reported in excess of water 关25兴. As suggested by Gruner and co-workers 关25兴 and as already
FIG. 3. Pressure dependence of the unit cell dimension of the hexagonal H II and lamellar L ␣ phases in DOPE samples at different compositions. For the sake of completeness, the pressure dependence of the cell dimension of the intermediate phase, calculated assuming Ia3d cubic symmetry, is also reported. The lattice parameter variations per unit pressure (da/d P) are also indicated.
reported for the monoolein system 关10兴, this effect can be primarily ascribed to the transfer of water from the coexisting excess bulk water to the lipidic phase, due to pressureinduced changes in the lipid hydration level. The pressure effects on the DOPE molecule were then derived by calculating the structural parameters 共e.g., the lipid length, the area per molecule, and the interface curvature兲 in the hexagonal and lamellar phases. Following the original method introduced by Luzzati 关23兴, the DOPE phases were divided into lipid and aqueous compartments. It is evident that the calculated dimensions depend both on the
021924-4
PHYSICAL REVIEW E 68, 021924 共2003兲
COMPRESSING INVERSE LYOTROPIC SYSTEMS: . . .
however, be defined for an equivalent cylinder 共of inner radius R wat), in which the total lipid volume is equal to that in the H II phase: l eq⫽
a
冑2 /)
⫺R wat .
共5兲
In the lamellar phase, the molecular parameters can be obtained by using 关23兴 S lip⫽2V lip / 共 d lip兲
共6兲
l⫽ 共 d lip兲 /2.
共7兲
and FIG. 4. Concentration dependence of the lattice parameter variation per unit pressure da/d P measured in the single-phase domains of the hexagonal H II and lamellar L ␣ phases of DOPE. Lines are guides to the eye.
densities of the components and on the assumption of linear addition of their bulk specific volumes. In the present calculations, we used specific volumes determined at different pressures: in particular, water densities were taken from Ref. 关20兴, while DOPE specific volumes refer to data measured by high-pressure dilatometry 关7兴. In the hexagonal phase, the radius of the water cylinder, R wat , the curvature of the monolayer at the lipid/water interface, H, and the area occupied by one DOPE molecule at the same interface, S lip , can be determined as follows: R wat⫽ 冑a 2 共 1⫺ lip兲 )/ 共 2 兲 ,
共2兲
H⫽1/共 ⫺R wat兲 ,
共3兲
2V lip . S lip⫽2 R wat 2 a lip)
共4兲
and
In Eq. 共4兲, V lip is the DOPE molecular volume (V lip ⫽1.21 nm3 at ambient pressure兲. It should be noticed that just adjusting the value of the radial distance in Eqs. 共3兲 and 共4兲 (R i instead of R wat), the curvature and the cross-sectional area can be determined at any position along the lipid chain (H i and S i instead of H and S lip in the equations兲. Note also that the sign of the curvature is taken to be negative when the lipid head-group surface bends toward the aqueous phase; this means that the cross-sectional area per lipid increases from the head to the tail, reducing to zero at the center of the water channel. According to Marsh 关26兴, no unique length for the lipid molecule in the H II phase exists, due to the packing constraints of the hexagonal lattice which alter the cylindrical symmetry of the hydrocarbon chain region. The lipid length ranges from a minimum value l min⫽(a/2) ⫺R wat , measured along the direction joining the centers of the cylinders, to a maximum value l max⫽(a/))⫺Rwat , which is measured along a line at an angle 30° to the intercylinder axis 共see Fig. 1 in 关26兴兲. A characteristic lipid length l eq can,
Figure 5 shows the pressure dependence of the molecular parameters for two DOPE samples, one at low (c⫽0.88) and the other at high (c⫽0.687) hydration levels. Note that in the calculation the phase composition in the biphasic region has been considered equal to the sample nominal composition. From the results, it can be easily deduced that the increase of the unit cell during compression clearly involves a change in the DOPE molecular conformation. As a function of pressure, the lipid chain length increases, while the molecular area at the lipid-water interface decreases. As a consequence, in the hexagonal phase the curvature of the lipidwater interface is reduced as a function of pressure, while in the lamellar phase the lipid layer thickness increases. In the hexagonal phase, two points have been carefully examined: 共i兲 the lateral DOPE compressibility and 共ii兲 the presence of a pivotal surface. As previously reported 关9兴, the pressure derivative of the molecular cross-sectional area, S i , calculated at different positions along the lipid molecular axis 关see Eq. 共4兲兴, gives a sort of lateral compressibility of the molecule as a function of the distance from the waterlipid interface. The dS i /d P have been calculated at different concentrations and the results for three different samples are reported in Fig. 6. It can be clearly seen that, at all concentrations, pressure is more effective in reducing the lateral cross section of DOPE near its terminal methyl group than it is at the water/lipid interface. The second point concerns the determination of the pivotal surface, which defines that position along the phospholipid molecule at which there is little change in molecular cross-sectional area during swelling 关13兴. On the basis of geometrical models, Templer and co-workers 关12兴 derived equations relating the lattice parameter to the water volume fraction in terms of the pivotal surface characteristics. In the H II phase, the interfacial geometry has been set to be cylindrical and the corresponding equations read a⫽
2 冑共 2 /) 兲关 1⫺ 共 V n /V lip兲 lip兴 lip共 S n /V lip兲
共8兲
and
021924-5
R n ⫽ 冑共 V n /S n 兲 2 ⫹)a 2 /2 ⫺V n /S n ,
共9兲
PHYSICAL REVIEW E 68, 021924 共2003兲
PISANI et al.
FIG. 6. Variation of the cross-sectional area per unit pressure change, dS i /d P, measured in the DOPE hexagonal H II phase at different distances from the water-lipid interface. Data refer to three different concentrations, as indicated.
FIG. 5. Pressure dependence of the structural parameters calculated for the hexagonal H II and lamellar L ␣ phases of DOPE at two different concentrations. From the top: lipid monolayer thickness 关 l eq in the case of the hexagonal phase, Eq. 共5兲, and l for the lamellar phase, Eq. 共7兲兴; area per molecule at the lipid-water interface 关 S lip ; see Eqs. 共4兲 and 共6兲 for the hexagonal and lamellar phases, respectively兴; monolayer curvature. Open and filled symbols refer to c⫽0.687 and 0.88, respectively.
where S n is the molecular area at the pivotal plane, V n is the molecular volume between the pivotal plane and the end of the lipid chain, and R n is the radial distance from the pivotal surface to the center of the water channel 共then H n ⫽ ⫺1/R n ). The pivotal surface characteristics were obtained at different pressures by fitting the concentration dependence of the hexagonal unit cell by Eq. 共8兲. A few examples of the fitting procedure are reported in Fig. 7: it appears that the pivotal surface exists at each considered pressure, but the worsening of the fit as the pressure increases suggest the relevance of the contribution of packing stresses at high pressures. This is an important point, because in monoolein the existence of a pivotal surface has been proved only in the Ia3d phase at ambient pressure and low hydration level 关10兴. In that case, the fit to high-pressure data was very far from being satis-
factory, suggesting that at high pressures the interface is bending and stretching simultaneously. Figure 8 shows the pressure dependence of the fitted S n ; in the same figure, the corresponding R n , calculated at different 共constant兲 pressures using Eq. 共9兲, are also reported as a function of composition. It can be clearly seen that the molecular area at the pivotal plane decreases during compression. Moreover, the distance of the pivotal plane from the center of the water channel decreases as a function of pressure, while the radius of the water channel increases 共the curvature of the lipid/water interface is reduced; see Fig. 5兲. Even though the data at atmospheric pressure are in full agreement with those reported by Rand and co-workers 共in fully hydrated conditions they found R n ⫽3.0 nm and S n ⫽0.75 nm2 ) 关13兴, during dehydration by osmotic stress both R n and R wat were observed to decrease. This suggests that on compression the DOPE molecules undergo a complex shape deformation. To visualize all the changes occurring as a function of pressure, a schematic, scaled representation of the dimensions of the structural elements is reported in Fig. 9. This aspect is further discussed below. DISCUSSION
Pressure strongly affects the DOPE-water phase stability, inducing a number of phase transitions. In close relation to the concentration-temperature phase diagram, which shows a reentrant hexagonal phase at high concentrations, the pressure-induced phase behavior at high and low DOPE hydrations is distinctly different. At high hydration, the hexagonal phase transforms into a lamellar L ␣ phase: the transition pressure is reduced on increasing the DOPE concentration, so that at intermediate concentration, 5–10 MPa are sufficient to induce the H II-L ␣ phase transition. On the other hand, by compressing the reentrant hexagonal phase, which occurs at c⭓0.85, an intermediate phase forms at the H II-L ␣ phase transition. The range of existence of this intermediate phase depends on concentration, being more stable at low hydration. It is interesting to note that the transition to the L 
021924-6
PHYSICAL REVIEW E 68, 021924 共2003兲
COMPRESSING INVERSE LYOTROPIC SYSTEMS: . . .
FIG. 8. Upper frame: pressure dependence of the molecular area at pivotal plane, S n , in the DOPE hexagonal H II phase. Lower frame: concentration dependence of the radial distance from the pivotal surface to the center of the water channel, R n , determined in the DOPE hexagonal H II phase at three different pressures, as indicated. FIG. 7. Typical best fit curves obtained by fitting to Eq. 共8兲 the hexagonal H II unit cell data. The corresponding 2 are 0.12 共0.1 MPa兲 共0.09, if data referring to the reentrant hexagonal phase are also considered in the fitting procedure; see the inset兲, 0.14 共20 MPa兲, and 0.18 共30 MPa兲. Experimental pressures are indicated in each frame.
phase is found only above 210 MPa for all concentrations, suggesting a low stability of the DOPE liquid conformation against pressure 共in monoolein, the transition to the gel phase was detected at pressures higher than 400 MPa 关10兴兲. The main molecular results are reported in Figs. 5–9. As can be deduced from the pressure dependence of the lipid length and of the area per molecule at the lipid-water interface, pressure increases the chain order parameter. Then, under compression, the basic geometrical shape of the DOPE molecule changes continuously from wedgelike to cylinderlike. In the hexagonal phase, this leads to a progressive decrease of the lipid layer curvature and to an enlargement of the unit cell. After the H II-L ␣ phase transition, the DOPE assumes a cylindrical shape: however, the unit cell still enlarges as a function of pressure because the chain order parameter still increases. The decrease of the cross-sectional area at the lipid-water interface also means that pressure induces a reduction of the exposed polar surfaces. According to the axiom that volume changes govern the behavior of any system under pressure, it is worthwhile to note that a reduced
hydration of polar surfaces makes a negative contribution to the total sample volume 关5兴. Therefore, the reduced hydration level could be the primary effect that determines the observed structural behavior. Because the stability of the different phases is controlled by a balance of competing different energetic contributions, it can be interesting to analyze the energetics of the DOPEwater system under pressure. In particular, the changes in free energy of a sample at concentration c can be derived by considering the work produced by isothermal compression. The compression work per lipid molecule is directly obtained by numerical integration of the pressure over the total sample volume V tot . By definition, ⌬g comp⫽g 共 P,c 兲 ⫺g 0 共 c 兲 ⫽⫺b
冕
P dV tot
共10兲
where P is the external pressure and b is a normalization factor (b⫽M/cN A , M being the DOPE molecular weight and N A Avogadro’s number兲. The volume variation is immediately obtained from the sample composition and the specific volumes of water and DOPE 关 V tot⫽clip⫹(1 ⫺c) wat兴 . The results of the calculation are shown in Fig. 10, where the changes in free energy per unit area (⌬g * ⫽⌬gcomp /S lip), determined at different concentrations and in both the hexagonal and lamellar phases, are reported as a
021924-7
PHYSICAL REVIEW E 68, 021924 共2003兲
PISANI et al.
FIG. 10. Changes in free energy per unit area, calculated at different concentrations using Eq. 共10兲, as a function of DOPE cross-sectional area. In particular, in the lamellar L ␣ phase ⌬g * ⫽⌬g comp /S lip is reported versus S lip , while in the hexagonal H II phase ⌬g * ⫽⌬g comp /S n is reported versus S n .
where k S is the lateral compression modulus, and S 0 is the optimum area per molecule at the water/lipid interface that minimizes the sum of the head-group and chain contributions to the free energy. According to 关29兴, the k S can be directly obtained from the second derivative of the free energy function with respect to the area per molecule: FIG. 9. 共Color兲 Scaled representation of the structural elements in the DOPE hexagonal H II phase at different pressures and concentrations: outer and inner circles represent the section of the equivalent cylinder where the methyl terminal groups are located and the section of the water cylinder, respectively; the position of the pivotal plane is represented by pale colors. The section of the wedge-like DOPE molecule is also represented.
function of the DOPE cross-sectional area. Note that in the hexagonal phase ⌬g * is defined at the pivotal surface (S lip ⫽S n ). Changes in the molecular volume of both DOPE and water reflect on changes in structural properties and energetics of the whole system. In a first approximation, the calculated free energy can be analyzed considering a simple model, which describes the energy of the hexagonal and lamellar phases in terms of various elastic contributions, namely, a lateral expansion 共or compression兲 g S and a curvature g curv term 关27–30兴: g el⫽g S ⫹g curv ,
k S ⫽S lip
d 2 ⌬g comp 2 dS lip
.
共13兲
Typical values for k S are around 0.1 N m⫺1 关29兴. The isothermal lateral compression moduli calculated in the present case as a function of pressure by Eq. 共13兲 are reported in Fig. 11 共note that in the hexagonal phase k S has been calculated at the pivotal surface S lip⫽S n ). It is noteworthy that k S shows a constant value up to moderate pressures, while it strongly increases at higher pressures; in particular, the cost for lateral
共11兲
where g el is the elastic energy. The lateral expansion contribution is generally assumed to be much larger than the curvature term, i.e., deformations involving stretching are expected to be more costly energetically than those involving bending. The energetic cost to expand 共or contract兲 a hydrated lipid monolayer from its equilibrium area is given by 关28,29兴
冉
S lip 1 ⫺1 ⌬g S ⫽ k S 2 S0
冊
2
,
共12兲
FIG. 11. Pressure dependence of the lateral compression modulus calculated at different concentrations. The inset shows the dependence at low pressure.
021924-8
PHYSICAL REVIEW E 68, 021924 共2003兲
COMPRESSING INVERSE LYOTROPIC SYSTEMS: . . .
compression appears very large after the formation of the lamellar phase, suggesting that the DOPE repulsion is very strong as long as the whole lipid shape becomes cylindrical. The energetic cost of bending a hydrated lipid monolayer is described to first approximation by the quadratic function 关27,30兴
冉
1 1 1 ⌬g curv⫽ k c ⫺ 2 R R0
冊
2
,
共14兲
which gives the energy 共per unit area兲 of bending a surface from a minimum radius R 0 共the radius of spontaneous, intrinsic curvature of the lipid in an unstressed state兲 to a radius R against a bending 共rigidity兲 modulus k c . Accordingly, the flattening of a hexagonal-phase monolayer into a planar bilayer conformation increases the associated free energy by k c /(2R 0 2 ), even if other contributions are expected to be involved in the hexagonal-to-lamellar phase transition 关14,31兴. In the case of DOPE, the energy gain associated with the removal of interstices 共the so-called interstitial energy兲 has indeed been observed to critically determine the temperature at which the hexagonal-to-lamellar phase transition occurs and the temperature range of the reentrant transition 关31兴. It should be noticed that the area per molecule and the radius of curvature in Eqs. 共12兲 and 共14兲 can be conveniently defined by considering the pivotal position 关see Eq. 共8兲兴: by definition, the elastic energy calculated at such a surface involves only the energy of bending the hydrated DOPE monolayer to a different radius 关13兴. Our data indicate the presence of a pivotal surface in the hexagonal phase at each pressure considered 共see Fig. 7兲. Therefore, Eq. 共14兲 can be used to account for free energy changes during DOPE dehydration at constant pressure and to evaluate the propensity of the DOPE-water system to form a lamellar rather then a hexagonal phase. On the other hand, changes in the pivot surface characteristics have been observed during compression 共see Fig. 8兲, so that the pressure dependence of the DOPE free energy needs to be described considering both the lateral expansion 共compression兲 and curvature energy contributions. The free energy changes of the hydrated DOPE layer in the hexagonal phase were then analyzed as follows. First, we calculated as a function of concentration the values at atmospheric pressure of the integration constant g 0 (c) in Eq. 共10兲. At the pivotal surface, the g 0 (c) corresponds to the bending energy, which can be determined by Eq. 共14兲 using R 0 ⫽3.5 nm and k c ⫽0.3⫻10⫺15 J m⫺2 as reported by Rand and co-workers 关13兴, and assuming the free energy in fully hydrated conditions equal to zero. Second, the g 0 (c) values were used to scale the free energy curves obtained by Eq. 共10兲. The scaled g( P,c) values, interpolated at some selected pressures, are shown in Fig. 12 as a function of the curvature of the pivotal surface 共which in turn depends on concentration and pressure; see Fig. 8兲. Confirming that deformations involving stretching are more costly energetically than those involving bending, the free energy changes induced by pressure at constant concentration 共see the dashed lines in Fig. 12兲 are larger than those observed at constant pressure as a function of concentration 共see the continuous lines in the
FIG. 12. Variation of the elastic free energies with the curvature of the pivotal surface in the DOPE hexagonal H II phase. Filled and open symbols refer to scaled and unscaled energies determined at the different indicated pressures, as reported in the text. Free energies at ambient pressure, calculated as a function of concentration using Eq. 共14兲 with R 0 ⫽3.5 nm and k c ⫽3⫻10⫺15 J m⫺2 关13兴, are indicated by cross symbols. Continuous lines are best fit curves obtained by fitting Eq. 共14兲 to the scaled energies at each constant pressure; dashed lines join data at the same concentration. Note that the curvature of the pivotal surface increases when both pressure and DOPE concentration increase 共from bottom to top and from left to right, respectively兲.
same figure兲. Third, the quadratic form of the bending energy 关Eq. 共14兲兴 was used to fit the free energy data at each 共constant兲 pressure. The fitting parameters k c and H n,0 共the spontaneous curvature of the pivotal surface兲 are reported as a function of pressure in Fig. 13. It is evident that the bending rigidity decreases with increasing pressure, suggesting that the DOPE chain repulsion becomes weaker as the order parameter increases. Moreover, the spontaneous curvature becomes less negative, i.e., the monolayer tends to bend less toward the water medium, indicating that under compression the torque associated with chain repulsion is less efficient in balancing the torque of head-group repulsion. This result confirms the data on lateral compressibility reported in Fig. 6, which show that, at all concentrations, pressure is more effective in reducing the lateral cross section of the lipid near its terminal methyl group than it is at the water/lipid interface. Note also that in excess of water the H II phase is expected to assume a curvature close to the intrinsic curvature 关13,14,26,31兴, thereby explaining the increase in the lattice constant detected by compressing DOPE samples in excess water 关3兴. Using the fitted k c and H n,0 parameters, the free energy cost to unbend at constant pressure the lipid monolayer to flat was also calculated. The results are reported in Fig. 14: considering the free energy data reported in Fig. 10, it appears that the reduction of the negative spontaneous curvature is a sufficient condition for thermodynamic preference of the lamellar over the hexagonal phase, which in fact forms under compression. However, the situation is more complicated, in particular when the appearance of the reentrant hexagonal phase is considered: according to 关31兴, it might be
021924-9
PHYSICAL REVIEW E 68, 021924 共2003兲
PISANI et al.
FIG. 14. Pressure dependence of the energy cost to unbend the DOPE monolayer to flatness 关 ⌬g unb⫽k c /(2R 0 2 ) 兴 .
FIG. 13. Pressure dependence of k c and H 0 parameters obtained by fitting DOPE scaled free energies at each constant pressure by Eq. 共14兲 共see Fig. 12兲. Lines are only guides to the eye.
suggested that the interstitial energy should play an important role in defining the concentration and pressure range of the transitions. Note also that the analyzed free energy changes were calculated by volume compression 关Eq. 共10兲兴, and thus also includes the compression energy of water: therefore, the model used could not be fully adequate to describe the energetics of the system. This point merits further investigation. The occurrence of the intermediate phase in the less hydrated samples should also be noted. It has already been suggested that the lamellar-to-nonlamellar phase transition occurs through key structures, which can be crucial in understanding the membrane fusion mechanism 关18,19,32兴. In particular, there has long been speculation about the intermediate state between the L ␣ and the H II phases 关19兴, and the widely used model for membrane fusion suggests that there is an intermediate state in which the two contacting monolayers become continuous via an hourglass-shaped structure called a stalk. Very recently, a structure similar to the postulated model was observed on a hydrated lipid system which has a negative spontaneous curvature 关18兴. In the present
关1兴 Trends in High Pressure Bioscience and Biotechnology, edited by R. Hayashi 共Elsevier, Amsterdam, 2002兲. 关2兴 High Pressure Molecular Science, edited by R. Winter and J. Jonas 共Kluwer, Dortrecht, 1999兲.
case, we observe that pressure modifies the DOPE spontaneous curvature and then a stalk structure could occur in less hydrated conditions. Nevertheless, it should also be observed that a bicontinuous cubic phase 共probably of Pn3m symmetry兲 has been detected forming as an intermediate between the L ␣ and the H II phases in excess water conditions, even if large kinetic barriers 共i.e., slow rate of formation兲 have been invoked to account for the formation of this phase only in metastable conditions 共i.e., thermally cycling DOPE across the L ␣ -H II phases at ambient pressure 关33兴, or waiting for a long time under such extreme conditions as 80 °C and 175 MPa for more than 1 day 关7兴兲. Therefore, the present results might indicate that in dehydrating conditions compression speeds up the kinetics, perhaps by promoting the formation of defects that can nucleate a cubic phase 关32,33兴. If this is the case, it should be noticed that the cubic phase occurring at the L ␣ -H II phase transition depends on the hydration level: an Ia3d structure has never been observed as an equilibrium excess water phase for any single-component system 关9兴. In conclusion, this work shows that an appropriate understanding of the stability and transformation of lipid phases can be obtained by analyzing the relationship between the lipid molecular structure and a few thermodynamic parameters when pressure and concentration vary. It is evident that the present analysis is not exhaustive 共in particular, the intermediate phase needs to be analyzed in detail兲, but the reported experimental data could help to disentangle different free energy contributions in further theoretical approaches. ACKNOWLEDGMENTS
P.M. acknowledges the financial support of INFM 共Italy兲 and ESRF 共France兲 in the frame of the Synchrotron Radiation project.
关3兴 R. Winter, Curr. Opin. Colloid Interface Sci. 6, 303 共2001兲. 关4兴 R. Winter, Biochim. Biophys. Acta 36562, 1 共2002兲. 关5兴 R. Winter, A. Landwehr, T. Brauns, J. Erbes, C. Czeslik, and O. Reis, in High Pressure Effects in Molecular Biophysics and
021924-10
PHYSICAL REVIEW E 68, 021924 共2003兲
COMPRESSING INVERSE LYOTROPIC SYSTEMS: . . .
关6兴 关7兴 关8兴 关9兴 关10兴 关11兴 关12兴
关13兴 关14兴
关15兴 关16兴 关17兴
Enzymology, edited by J. L. Markley, D. B. Northorp, and C. A. Royer 共Oxford University Press, Oxford, 1996兲, pp. 274 – 297. R. Winter and C. Czeslik, Z. Kristallogr. 215, 454 共2000兲. P. T. C. So, S. M. Gruner, and S. Erramilli, Phys. Rev. Lett. 70, 3455 共1993兲. C. Czeslik, R. Winter, G. Rapp, and K. Bartels, Biophys. J. 68, 1423 共1995兲. P. Mariani, B. Paci, P. Bosecke, C. Ferrero, M. Lorenzen, and R. Caciuffo, Phys. Rev. E 54, 5840 共1996兲. M. Pisani, S. Bernstorff, C. Ferrero, and P. Mariani, J. Phys. Chem. B 105, 3109 共2001兲. C. Czeslik, R. Winter, G. Rapp, and K. Bartels, J. Phys.: Condens. Matter 10, 11 499 共1998兲. R. H. Templer, J. M. Seddon, N. A. Warrender, A. Syrykh, Z. Huang, R. Winter, and J. Erbes, J. Phys. Chem. B 102, 7251 共1998兲. R. P. Rand, N. L. Fuller, S. M. Gruner, and V. A. Parsegian, Biochemistry 29, 76 共1990兲. K. Gawrisch, V. A. Parsegian, D. A. Hajduk, M. W. Tate, S. M. Gruner, N. L. Fuller, and R. P. Rand, Biochemistry 31, 2856 共1992兲. M. M. Kozlov, S. Leikin, and R. P. Rand, Biophys. J. 67, 1603 共1994兲. D. Siegel, Biophys. J. 49, 1155 共1986兲. S. Andersson, S. T. Hyde, K. Larsson, and S. Lidin, Chem. Rev. 共Washington, D.C.兲 88, 221 共1988兲.
关18兴 L. Yang and H. W. Huang, Science 297, 1877 共2002兲. 关19兴 D. P. Siegel, Biophys. J. 76, 291 共1999兲. 关20兴 Roark’s Formulas for Stress & Strain, 6th ed., edited by W. C. Young 共McGraw-Hill, New York, 1989兲. 关21兴 T. Narayanan, O. Diat, and P. Bosecke, Nucl. Instrum. Methods Phys. Res. B 177, 1005 共2001兲. 关22兴 P. Mariani, V. Luzzati, and H. Delacroix, J. Mol. Biol. 204, 165 共1988兲. 关23兴 V. Luzzati, in Biological Membranes, edited by D. Chapman 共Academic, London, 1968兲, Vol. 1, Chap. 3. 关24兴 L. Yang, T. M. Weiss, R. I. Lehrer, and H. W. Huang, Biophys. J. 79, 2002 共2000兲. 关25兴 O. Narayan, P. T. C. So, D. C. Turner, S. M. Gruner, M. W. Tate, and E. Shyamsunder, Phys. Rev. A 42, 7479 共1990兲. 关26兴 D. Marsh, Biophys. J. 70, 2248 共1996兲. 关27兴 W. Helfrich, Z. Naturforsch. C 28, 693 共1973兲. 关28兴 E. Evans and R. Skalak, Mechanics and Thermodynamics of Biomembranes 共CRC, Boca Raton, FL, 1980兲. 关29兴 J. M. Seddon, Biochim. Biophys. Acta 1031, 1 共1990兲. 关30兴 R. H. Templer, D. C. Turner, P. Harper, and J. M. Seddon, J. Phys. II 5, 1053 共1995兲. 关31兴 M. M. Kozlov, S. Leikin, and R. P. Rand, Biophys. J. 67, 1603 共1994兲. 关32兴 D. M. Anderson, S. M. Gruner, and S. Leibler, Proc. Natl. Acad. Sci. U.S.A. 85, 5364 共1988兲. 关33兴 E. Shyamsunder, S. M. Gruner, M. W. Tate, D. C. Turner, P. T. C. So, and C. P. S. Tilcock, Biochemistry 27, 2332 共1988兲.
021924-11