DATA AND REVIEW
Compression and Mechanical Properties of Tablet Formulations Containing Corn, Sweet Potato, and Cocoyam Starches as Binders O.A. Odeku*, O.O. Awe, B. Popoola, M.A. Odeniyi, and O.A. Itiola
The authors study the effects of sweet potato and cocoyam starches on the compressional and mechanical characteristics of a paracetamol tablet formulation using cornstarch BP.
3.0
l–n [1 4 (1 2 D)]
2.6
2.2
Potato 1.8
Corn starch Cocoyam
ln [1 4 (1 – D)] 5 KP 1 A
1.4 0
50
100
150
200
250
Applied pressure (MNm–2)
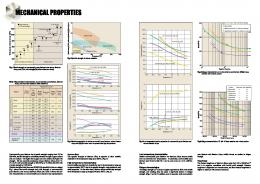
Figure 1: Heckel plots for paracetamol tablet formulations containing 5.0% w/w of starch.
O.A. Odeku is a senior lecturer, O.O. Awe is a research student, B. Popoola is a research student, M.A. Odeniyi is a lecturer, and O.A. Itiola is a professor, all at the Department of Pharmaceutics and Industrial Pharmacy, University of Ibadan, Ibadan, Nigeria. tel.123 48033235828,
[email protected]. *To whom all correspondence should be addressed.
82
Pharmaceutical Technology
APRIL 2005
S
tarch is one of the most widely used excipients in the manufacture of solid dosage forms. Researchers have tried to develop botanical starches for use as binders and disintegrants in tablet formulations (1–5). For example, sweet potato and cocoyam starches have shown potential as binding agents and/or disintegrants in tablet formulations (3, 6). The effects of these starches on compressional characteristics of the tablets and mechanical properties, however, have not been investigated. In this article, the effects of sweet potato and cocoyam starches on a paracetamol tablet formulation’s compressional characteristics and mechanical properties are compared with those of official cornstarch BP grade. The tablets’ compressional characteristics were studied using density measurements and the Heckel and Kawakita equations (7–9). The mechanical properties were assessed using the tensile strength (T) (i.e., a measure of bond strength) and the brittle fracture index (BFI) values (i.e., a measure of the brittleness of the tablets) (10–13). The Heckel equation is widely used for relating a powder bed’s relative density (D) during compression to the applied pressure (P). The equation is written as follows: [1]
The slope of the straight line portion (K) is the reciprocal of the material’s mean yield pressure (Py). From the value of the intercept A, the relative density (DA) can be calculated using the following equation (14): DA 5 1 – e–A
[2]
The powder’s relative density at the point at which the applied pressure equals zero (D0) describes the initial rearrangement phase of densification as a result of die filling. The relative density DB describes the phase of rearrangement at low pressures and is the difference between DA and D0: DB 5 DA – D0
[3]
The Kawakita equation relates to study powder compression using the degree of volume reduction (C) and is written as: C 5 (V0 – Vp ) 4 V0 5 abP 4 (1 1 bP)
[4]
The equation, in practice, can be rearranged as: P 4 C 5 (P 4 a) 1 (1 4 ab)
[5]
www.phar mtech.com
DATA AND REVIEW in which V0 is the powder’s initial bulk volume and Vp is the bulk volume after compression. The constant a is the material’s minimum porosity before compression; the constant b relates to the material’s plasticity. The reciprocal of b defines a pressure term Pk, which is the pressure required to reduce the powder bed by 50% (15, 16). The BFI was devised by Hiestand et al. (17) and is obtained by comparing the tensile strengths of tablets with and without a hole at their centers at the same relative density (10, 17). The hole acts as a built-in stress concentration defect. Paracetamol was chosen because of its poor compression properties. Hence, it needs a binding agent to form satisfactory tablets among other excipients.
Table I: Parameters derived from density measurements and from Heckel and Kawakita plots. Starch
Sample concen. (% w/w)
Heckel plots D0
Py
DA 2
(MN/m )
Kawakita plots DB
Pk
DI
(MN/m)
0.00 0.228 176.03 0.736 0.508 4.066 0.325 2.50 0.230 360.29 0.831 0.601 2.565 0.310 Sweet potato
5.00 0.248 276.45 0.823 0.575 2.462 0.291 7.50 0.257 239.75 0.822 0.565 2.311 0.281 10.00 0.263 217.12 0.817 0.554 2.121 0.274 2.50 0.222 270.01 0.849 0.627 2.627 0.309
Materials and methods Materials. The materials used were paracetamol BP (RhonePoulenc Sante, Paris, France), lactose (DMV, Veghel, Netherlands), cornstarch BP (BDH, Chemicals Ltd., Poole, UK), sweet potato starch obtained locally from the tubers of Ipomoea batatas, and cocoyam starch obtained locally from the tubers of Colocasia esculenta. The experimental starches were prepared in a University of Ibadan (Ibadan, Nigeria) laboratory. The description of the starches’ preparation and purification has been given elsewhere (2, 4). Preparation of granules. Batches (250 g) of a basic paracetamol– lactose formulation (80:20% w/w) were dry-mixed for 5 min in a planetary mixer (Kenwood Corp., Tokyo, Japan). The mixture was moistened with 40 mL of distilled water or the appropriate amounts of starch mucilage to produce granules containing various concentrations of the starch as binders. Massing continued for 5 min. Then, the wet masses were granulated manually by passing them through a 12-mesh sieve (1400 mm), dried in a hot-air oven for 18 h at 50 8C, and resieved through a 16-mesh sieve (1000 mm). The granules were stored in airtight containers. Determination of particle density. The samples’ particle densities were determined with a pycnometer with xylene as the displacement fluid. An empty 50-mL pycnometer bottle was weighed (W), filled with xylene (nonsolvent), and the excess wiped off. The filled bottle was weighed a second time (W1). The difference between this weight and W was calculated (W2). A 2-g quantity of the sample was weighed (W3) and quantitatively transferred into the pycnometer bottle. The excess solvent was wiped off and the bottle was weighed again (W4). The particle density, rt (g/cm3), was calculated from the following equation: rt 5 (W2 3 W3) 4 50(W3 – W4 1 W2 1 W)
[6]
Determination of precompression density. The bulk density of each formulation at zero pressure (loose density) was determined by pouring the granules at a 458 angle through a funnel into a 50mL glass measuring cylinder with a diameter of 21 mm (2, 18). Determinations were conducted in triplicate. The relative density (D0) of each formulation was obtained from the ratio of its loose density to its particle density. Preparation of tablets. Tablets (500 mg) were prepared from the 500–1000-mm granules by compressing them for 30 s with predetermined loads on a hydraulic hand press (model C, Carver Inc., Menomonee Falls, WI). Before each compression, the 10.584
Pharmaceutical Technology
APRIL 2005
Cocoyam
5.00 0.242 219.35 0.848 0.606 2.196 0.295 7.50 0.254 183.38 0.841 0.587 2.014 0.281 10.00 0.261 164.30 0.831 0.570 1.862 0.276 2.50 0.215 229.60 0.811 0.596 4.966 0.310 5.00 0.234 197.06 0.799 0.565 4.272 0.297
Corn
7.50 0.248 187.86 0.795 0.547 3.875 0.282 10.00 0.258 157.57 0.770 0.512 3.192 0.277
Abbreviations: D0 is the relative density at zero pressure; Py is the mean yield pressure; DA is the relative density from the value of intercept A; DB describes the phase of rearrangement at low pressures (DA – D0); Pk is the pressure required to reduce powder bed by 50% (recipricol of b); and DI is the initial relative density.
mm die and flat-faced punches were lubricated with a 2% w/v dispersion of magnesium stearate in a ether–ethanol (1:1) solution. Tablets with a hole (1.59-mm diameter) at their centers were made using an upper punch with a hole and a lower punch with a pin (2, 10). After ejection, the tablets were stored over silica gel for 24 h to allow for elastic recovery and hardening. This procedure prevents false low-yield values. The tablets’ weights and dimensions were determined to within 61 mg and 0.01 mm, respectively. Their relative densities (D) were calculated using the equation: D 5 W 4 (Vt 3 rs)
[7]
in which Vt is the tablet’s volume (cm3), including the hole when present, and rs is the solid material’s particle density (g/cm3). Heckel plots of ln (1 4 [1 – D]) versus applied pressure (P) and Kawakita plots of P 4 C versus P, were made for all formulations. Testing. The tensile strengths of the normal tablets (T) and the apparent tensile strengths of tablets containing a hole (T0) were determined at room temperature by diametral compression (19) using a hardness tester (PTB 301, Pharmatest, Switzerland) and by applying the equation: T (or T0) 5 2F 4 pdt
[8]
in which T (or T0) is the tensile strength of the tablet (MN/m2), F is the load (MN) needed to cause fracture, d is the tablet diameter (m), and t is the tablet thickness (m). Results were taken only from tablets that split cleanly into two halves without any www.phar mtech.com
DATA AND REVIEW 0.2
BFI 5 [(T 4 T0) – 1 ]
[9]
Results and discussion
400
0.0 Log tensile strength
Applied pressure/degree of volume reduction
sign of lamination. All measurements were made in triplicate or more. The results given are the means of several determinations. The tablets’ BFI were calculated using the following equation:
300
-0.2
200 -0.4
Potato Corn starch Cocoyam
100
Potato
Figure 1 shows representative -0.6 Corn starch 0.75 0.80 0.85 0.90 0.95 Heckel plots for paracetamol forCocoyam Relative density 0 mulations containing 5% of the 0 50 100 150 200 250 starches as a binder. Py was calcuFigure 3: Log tensile strength versus relative Applied pressure (MNm ) lated from the regions of the plots density for paracetamol tablet formulations (with showing the highest correlation co- Figure 2: Kawakita plots for paracetamol tablet and without a hole at their center) containing 5.0% efficient of >0.990 for all the for- formulations containing 5.0% w/w of starch. w/w of starch. mulations (usually 84.93–226.47 MN/m2). The intercept A was deFigure 2 shows representative Kawakita plots for paracetatermined from the extrapolation of the line. The values of the mean yield pressure, D0, Py, DA, and DB for the formulations are mol formulations containing 5% w/w of the starches as a bindpresented in Table I. The D0 value—which represents the degree ing agent. A linear relationship was obtained at all compression of initial packing in the die as a result of die filling—increased as pressures used with a 0.999 correlation coefficient for all starches. the starch concentration increased. Formulations containing a Values of a and ab were obtained from the slope and intercept sweet potato binder had the highest D0 values; formulations con- of the plots, respectively. Values of 1 – a yield the initial relative taining cornstarch had the lowest. This result indicates that for- density of the starches (DI) while Pk values were obtained from mulations containing sweet potato starch exhibited the highest the reciprocal of b (see Table I). The DI values, which is a measurement of the packed initial degree of packing in the die because of die filling; formulations relative density of the starches with the application of small prescontaining cornstarch exhibited the lowest values. The DA values, which represent the total degree of packing sures or tapping (12), decreased as the concentration of starches at zero and low pressures, decreased as the starch concentra- increased. These values are also higher than the corresponding tion increased. In general, formulations containing cornstarch values of loose initial relative density, D0. This result corresponds showed the lowest DA values; those containing cocoyam starches with previous findings of Odeku and Itiola (12). exhibited the highest values. The Pk values, which are an inverse measurement of the plastic The DB value represents the particle rearrangement phase in deformation occurring during the compression process (12), also the early compression stages and tends to indicate the extent of decreased with an increase in the starch concentration. In genparticle or granule fragmentation, although fragmentation can eral, Pk values rankings (i.e., the order of magnitude of the varioccur concurrently with plastic and elastic deformation of con- ous values for the relevant parameters) for the formulations constituent particles. The DB value also decreased with an increase taining the various starches was cocoyam, followed by sweet potato, in starch content. Formulations containing cocoyam starch ex- and then corn. Thus, formulations containing cornstarch exhibhibited the highest values; those containing cornstarch showed ited the lowest degree of total plastic deformation during the comthe lowest values. This result indicates that granule fragmenta- pression process, and formulations containing cocoyam starch tion decreased with an increase in starch concentration. Fur- exhibited the highest values. It has been established that the lower the Pk value, the more the thermore, the values of DB were usually higher than those of D0 because granule fragmentation and the subsequent filling of total plastic deformation occurs during compression (12). Alvoid spaces between particles occurred extensively at low pres- though formulations containing cornstarch exhibited a faster onset sures. The loose packing of the large granules at zero pressure of plastic deformation during compression as indicated by the low Py values, they also exhibited the lowest degree of plastic detended to yield low D0 values (10). The mean yield pressure, Py, is inversely related to the formula- formation during the compression process. On the other hand, tions’ ability to deform plastically under pressure. The Py values formulations containing the experimental starches exhibited a decreased with an increase in the starch concentration. Formula- slower onset of plastic deformation but a higher amount of plastions containing sweet potato starch exhibited the highest Py val- tic deformation during compression. Thus, cornstarch will be ues, and those containing cornstarch exhibited the lowest Py val- more useful than other experimental starches in a high-speed ues. These results indicate that formulations containing cornstarch tablet machine with a short dwell time. as a binder exhibited the fastest onset of plastic deformation durThe results of the tensile tests on the paracetamol tablets fit ing compression. Formulations containing sweet potato exhibited the general equation (correlation coefficient .0.980): the slowest rate. This finding indicates that cornstarch plastically log T (or T0) 5 aD 1 b [10] deforms faster during compression than the experimental starches. –2
86
Pharmaceutical Technology
APRIL 2005
www.phar mtech.com
DATA AND REVIEW in which a and b were constants for each forcontact points for interparticulate bonding Table II: Tensile strength (T) and mulation but depended on whether the (5, 10). brittle fracture index (BFI) values tablet had a hole in it. Figure 4 shows repreTherefore, cornstarch would be more usefor paracetamol tablets containing sentative plots of log tensile strength versus ful than the experimental starches for minvarious concentrations of the relative density for formulations containing imizing the problems of lamination and cap5% w/w of the starches as binder. The ten- starches at relative density 0.90. ping, especially on high-speed tableting sile strength of tablets with a hole is lower machines with short dwell times for the plasSample than those without a hole (17). Table II prestic deformation of materials. Cocoyam and concen. T ents the values of T and BFI for the starches sweet potato starches would be useful when (% w/w) (MN/m2) BFI Starch at a relative density of 0.90, which represents a tablet’s high bond strength is needed. 0.00 0.505 0.011 commercial paracetamol tablets. 2.50 0.891 0.529 The tensile strength of the paracetamol Conclusion 5.00 1.122 0.397 Sweet This article provides insight into the effects tablets increased, but the BFI decreased with potato 7.50 1.667 0.265 of the experimental starches on paracetaan increase in starch concentration. Formu10.00 1.933 0.259 mol tablet formulation’s compressional charlations containing cocoyam starch, which 2.50 0.953 0.619 acteristics and mechanical properties. The frequently exhibited the highest tensile 1.231 0.535 results indicate botanical starches could be strength, also had the highest BFI. Formu- Cocoyam 5.00 7.50 1.739 0.429 useful to produce tablets with desired melations containing cornstarch exhibited the chanical properties for specific purposes delowest T and BFI values. A low BFI is desir10.00 1.988 0.337 able for minimal lamination and capping pending on whether stronger or softer tablets 2.50 0.602 0.250 during tablet production, but the effect on are required in cases such as chewable or dis5.00 0.862 0.233 tensile strength largely depends on the in- Corn integrating tablets. 7.50 0.961 0.225 tended use of the tablets (12). Furthermore, 10.00 1.378 0.191 Acknowledgement the low Pk values for tablets containing the experimental starches is probably responsible for the tablets’ higher Part of this work was supported by a Senate research grant from T values because greater total plastic deformation creates more the University of Ibadan.
88
Pharmaceutical Technology
APRIL 2005
www.phar mtech.com
DATA AND REVIEW References 1. S. Esezobo, S. Zubair, and N. Pilpel, “Effects of Tapioca Obtained from Cassava (Manihot utilissima) on the Disintegration and Dissolution Rates of Paracetamol Tablets,” J. Pharm. Pharmacol. 41 (1), 7–10 (1989). 2. A.S. Adebayo and O.A. Itiola, “Evaluation of Breadfruit and Cocoyam Starches as Exodisintegrants in a Paracetamol Tablet Formulation,” Pharm. Pharmacol. Commun. 4 (6), 385–389 (1998). 3. O.A. Itiola, “Compressional Characteristics of Three Starches and the Mechanical Properties of Their Tablets,” Pharm. World J. 8 (3), 91–94 (1991). 4. O.A. Odeku, O.A. Itiola, and A.A. Adeniran, “Effects of Yam and Corn Starches on the Mechanical and Disintegration Properties of Paracetamol Tablets,” in Proceedings of the First International Workshop on Herbal Medicinal Products (Ibadan, Nigeria, University of Ibadan, 1998, pp. 193–200. 5. G. Alebiowu and O.A. Itiola, “Compressional Characteristics of Native and Pregelatinized Forms of Sorghum, Plantain, and Corn Starches and the Mechanical Properties of Their Tablets,” Drug Dev. Ind. Pharm. 28 (6), 663–672 (2002). 6. O.A. Odeku and O.A. Itiola, “Packing and Cohesive Properties of Three Starches,” Trop. J. Pharm. Res. (in press). 7. R.W. Heckel, “Density-Pressure Relationships in Powder Compaction,” T. Metall Soc. AIME 221, 671–675 (1961a). 8. R.W. Heckel, “An Analysis of Powder Compaction Phenomena,” T. Metall Soc. AIME 221, 1001–1008 (1961). 9. K. Kawakita and K.H. Ludde, “Some Considerations on Powder Compression Equations,” Powder Technol. 4 (2), 61–68 (1970–1971). 10. O.A. Itiola and N. Pilpel, “Tableting Characteristics of Metronidazole Formulations,” Int. J. Pharm. 31(1–2), 99–105 (1986). 11. O.A. Itiola and N. Pilpel,“Formulation Effects on the Mechanical Properties of Metronidazole Tablets,” J. Pharm. Pharmacol. 43 (3), 145–147 (1991).
90
Pharmaceutical Technology
APRIL 2005
12. O.A. Odeku and O.A. Itiola, “Evaluation of Khaya Gum as a Binder in a Paracetamol Tablet Formulation,” Pharm. Pharmacol. Commun. 4 (3), 183–188 (1998). 13. O.A. Odeku and O.A. Itiola, “Characterization of Khaya Gum as a Binder in a Paracetamol Tablet Formulation,” Drug Dev. Ind. Pharm. 28 (3), 329–337 (2002). 14. P. Humbert-Droz et al., “Densification Behaviour of Drugs Presenting Availability Problems,” Int. J. Pharm. Technol. Prod. Mfr. 4, 29–35 (1983). 15. P. Shivanand and O.L. Sprockel, “Compaction Behaviour of Cellulose Polymers,” Powder Technol. 69 (2), 177–184 (1992). 16. C. Lin and T. Cham, “Compression Behaviour and Tensile Strength of Heat-Treated Polyethylene Glycols,” Int. J. Pharm. 118 (2), 169–179 (1995). 17. E.N. Hiestand et al., “Physical Processes of tableting,” J. Pharm. Sci. 66 (4), 510–519 (1977). 18. P. Paronen and M. Juslin, “Compressional Characteristics of Four Starches,” J. Pharm. Pharmacol. 35 (10), 627–635 (1983). 19. J.T. Fell and J.M. Newton, “Determination of Tablet Stength by Diametral-Compression Test,” J. Pharm. Sci. 59 (5), 688–691 (1970). PT
Please rate this article. On the Reader Service Card, circle a number: 324 Very useful and informative 325 Somewhat useful and informative 326 Not useful or informative
Your feedback is important to us.
www.phar mtech.com