BIOINFORMATICS
Vol. 19 no. 8 2003, pages 952–955 DOI: 10.1093/bioinformatics/btg127
Computation method to identify differential allelic gene expression and novel imprinted genes Howard H. Yang, Ying Hu, Michael Edmonson, Kenneth Buetow and Maxwell P. Lee ∗ Laboratory of Population Genetics, National Cancer Institute, Gaithersburg, MD 20877, USA Received on August 23, 2002; revised on November 13, 2002; accepted on November 17, 2002
INTRODUCTION Genomic imprinting is characterized by parent-of-origindependent expression of genes resulting in allele-specific gene expression (Feinberg, 2000; Surani, 2001), Abnormal imprinting is strongly associated with several human diseases including Prader–Willi syndrome (PWS; Nicholls and Knepper, 2001), Beckwith–Wiedemann syndrome (BWS; Mannens et al., 1994) and some types of cancer (Ogawa et al., 1993; Rainier et al., 1993). Most imprinted genes have been identified by genotyping and allele-specific expression analysis targeted to candidate genes. About 50 imprinted genes have been identified in ∗ To whom correspondence should be addressed.
952
human and mouse genomes. Mono-allelic expression also plays an important role in allelic exclusion, which ensures that mono-specific antibody is produced from B cells, and in X chromosome inactivation, which ensures that gene expression is equal from male and female. The current release of human Unigene (build #153) contains 3 569 546 EST clones that are in 101 602 clusters. 14 758 of these Unigene clusters contain at least 33 EST clones. Genes with multiple ESTs can be used to deduce information about gene expression and quantitative analysis of gene expression such as the Digital Differential Display has also been achieved by the Cancer Genome Anatomy Project (Strausberg et al., 2000). Computational methods have been used to identify single nucleotide polymorphisms (SNPs) in redundant EST clones (Buetow et al., 1999; Irizarry et al., 2000; Marth et al., 1999).
METHODS SNP data set The SNP data set for modeling allele-specific gene expression is extracted from the SNP database described previously in (Buetow et al., 1999). Unigene is known to contain EST clones with variable quality. We have taken several steps to ensure that high quality of EST clones are used in our data set. The EST clones and SNPs must meet the following three criteria to be included in our data set. (1) Phred quality score of an EST clone is equal or greater than 20; (2) SNP score is equal or greater than 0.99 (Buetow et al., 1999); and (3) SNPs are mapped to Locuslink. Any transcript that has not been assembled into Unigene is not considered here. This may include imprinted anti-sense transcripts, which are usually very long and lack introns. This data set consists of 112 812 records for 19 312 unique SNPs. Table 1 is a tiny portion of this data set. This table consists of three blocks of EST clone records for three SNPs with SNP ids 604639, 605408, and 608434. The SNP 604639 is heterozygous in the two cDNA libraries whereas the genotypes of the SNP 604639 in the Published by Oxford University Press
Downloaded from bioinformatics.oxfordjournals.org by guest on July 15, 2011
ABSTRACT Motivation: Genomic imprinting plays an important role in both normal development and diseases. Abnormal imprinting is strongly associated with several human diseases including cancers. Most of the imprinted genes were discovered in the neighborhood of the known imprinted genes. This approach is difficult to extend to analyze the whole genome. We have decided to take a computational approach to systematically search the whole genome for the presence of mono-allelic expressed genes and imprinted genes in human genome. Results: A computational method was developed to identify novel imprinted or mono-allelic genes. Individuals represented in human cDNA libraries were genotyped using Bayesian statistics, and differential expression of polymorphic alleles was identified. A significant reduction in the number of libraries that expressed both alleles, measured by Z -statistics, is a strong indicator for an imprinted or a mono-allelic gene. Availability: The data sets are available at http://leelab. nci.nih.gov/leelab/jsp/IGDM/IGDM.html Contact:
[email protected]. Supplementary information: http://leelab.nci.nih.gov/ leelab/jsp/IGDM/IGDM.html
Computation identification of imprinted genes
Table 1. A tiny portion of the SNP data set to show three examples of SNPs in the data set
SNP
Lib
Base
EST Count
604639 604639 604639 604639 604639 604639 604639 604639 605408 605408 605408 605408 605408 605408 605408 605408 608434 608434 608434 608434
1042 1494 1728 1730 424 589 595 628 1730 262 278 298 367 415 452 486 250 252 262 271
A,C A C A A A,C A C G G A A G A G G G G G T
5 1 1 1 1 2 1 1 1 3 1 4 2 1 1 1 3 1 4 2
Gene
SNP sequence
NUDE1
GTTTATCATAMGCGGCCGCCT
KIAA0737
TGACCTCCCGRGGGCTCCAAC
IGF2
GCAATCGGAAKTGAGCAAAAC
4
•
1
2
3
•
0
log of average clone count per library
Data Set
• • •• • • •• • ••••• • ••••• •• •••••••• ••• • • ••••••••• ••••• •• •••••••••••••••• • •••• ••••••••••• ••••••••••• •••••••••••• ••• • • •••••••••••••••••••• •••••• •••••••••••••• • ••••••••••••••••••••••••••••••••••••••• •• • •• • • ••••••••••••••••••••••••••••••••••••••••••••••••• ••••••• ••• ••• ••••••••••••••••••••••••••••• •••••••••••••• •••• ••••••••••••• •••• • ••• • •• • • • ••••••••••••••••••••••••••••••••••••••••••••••••••••••••••••••• •••••••••••••••••••••••••••••••••••••••••••••••••••••••••••••••••••••••••••••••••••••••••••••• ••••••••••••••••••••••••••••••••••••••••••••••••••• ••••••••••••••••••••••••••••••••••••••••••••••••••••••••••••••••••••••••••••••••••••••••••••••••• •••••••••• • • • •• •• •••• • •• • ••••••••••••••••••••••••••••••••••••••••••••••••••••••••••••••••••••••••••••••••••••••••••••••••••••••••••••••••••••••••••••••••••••••••••••••••••••••••••••••••••••••••••••••••••••••••••••••••••••••••••••••••••••••••••••••••••••••••••• ••••••••••••••••••• ••••••••••••••••••••••• •••••••••••••••••••••••••••••••••••••••••••••••••••••••••••••••••••••••••••••••••••••••••••••••••••••••••••••••••••••••••••••••••• • ••• • • •• • • •• • • • • • • • • • • •••• • • • • • • • • • • • • • • • • • • • • • • • • • • • • • • • • • • • • • • • • • • • • • ••••••••••••••••••••••••••••••••••••••••••••••••••••••••••••••••••••••••••••••••••••••••••••••••••••••••••••••••••••••••••••••••••••••••••••••••••••••••••••••••••••••••••••••••••••••••••••••••••••••••••••••••••••••••••••••••••••••••••••••••••••••••••••••••••••••••••••••••••••••••••••••••••••••••••••••••••••••••••••••••••••••••••••••••••••••••••••••••••••••••••••••••••••••••••••••• ••••••••••••••••••••••••••••••••••••••••••••••••••••••••••••••••••••••••••••••••••••••••••••••••••••••••••••••••••••••••••••••••••••••••••••••••••••••••••••••••••••••••••••••••••••••••••••••••••••••••••••••••••••••••••••••••••••••••••••••••••••••••••••••••••••••••••••• •• • •••• ••••••••••• ••• • •• ••••••• • •• • ••• •••••••••••••••••••••••••••••••••••••••••••••••••••••••••••••••••••••••••••••••••••••••••••••••••••••••••••••••••••••••••••••••••••••••••••••••••••••••••••••••••••••••••••••••••••••••••••••••••••••••••••••••••••••••••••••••••••••••••••••••••••••••••••••••••••••••••••••••••••••••••••••••••••••••••••••••••••••••••••••••••••••••••••••••••••••••••••••••••••••••••••••••••••••••••••••••••••••••••••••• • • • • • • • • • • • • • • • • • • • • • • • • • •• • • • • • • •• •• • • • • ••• • • • • •• • •••••••••••••••••••••••••••••••••••••••••••••••••••••••••••••••••••••••••••••••••••••••••••••••••••••••••••••••••••••••••••••••••••••••••••••••••••••••••••••••••••••••••••••••••••••••••••••••••••••••••••••••••••••••••••••••••••••••••••••••••••••••••••••••••••••••••••••••••••••••••••••••••••••••••••••••••••••••••••••••••••••••••••••••••••••••••••••••••••••••••••••••••••••••••••••••••••••••••••••••••••••••••••••••••••••••••••••••••••••••••••••••••••••••••••••••••••••••••••••••••••••••••••••••••••••••••••••••••••••••••••••••••••••••••••••••••••••••••••••••••••••••••••••• • • • ••••• ••••••••••••••••• •••••••••••••••••••••••••••••••••••••••••••••••••••••••••••••••••••••••••••••••••••••••••••••••••••••••••••••••••••••••••••••••••••••••••••••••••••••••••••••••••••••••••••••••••••••••••••••••••••••••••••••••••••••••••••••••••••••••••••••••••••••••••••••••••••••••••••••••••••••••••••••••••••••••••••••••••••••••••••••••••••••••••••••••••••••••••••••••••••••••••••••••••••••••••••••••••••••••••••••••••••••••••••••••••••••••••••••••• ••••••••••••• • •••••••••• •• •••••••••••••••••••••••••••••••••••••••••••••••••••••••••••••••••••••••••••••••••••••••••••••••••••••••••••••••••••••••••••••••••••••••••••••••••••••••••••••••••••••••••••••••••••••••••••••••••••••••• •• •••••••••••••••••••••••••••••••••••••••••••••••••••••••••••••••••••••••••••••••• ••••••••••••••••••••••••••••••••••••••••••••••••••••••••••••••••••••••••••••••••••••••••••••••••••••••••••••••••••••••••••••••
0
5000
10000
15000
20000
SNP_id
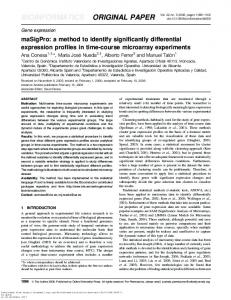
Fig. 1. This figure shows the average clone count per library distribution of the SNPs in the normal tissue data set. The SNPs are sorted by the maximum clone counts per library of those SNPs. Each dot represents an average clone count per library in logarithm scale for one SNP. There are 3651 SNPs with library sizes equal or greater than 10 and 2767 SNPs with clone counts equal or greater than 20.
other are unknown. The genotypes of the SNP 605408 and the SNP 608434 are also unknown. However, their genotypes can be inferred as described in Computation.
The SNPs 605408 and 608434 were the two examples that were selected by our method. The SNP 608434 is in the known imprinted gene IGF2. The clone count distribution of the SNPs in the normal tissue data set is shown in Figure 1.
Computation This study presents a computational method, which can identify differential allelic expressed genes and candidate imprinted genes from gene expression data in the EST database. Imprinted genes and mono-allelic genes differentially express one allele. To model allele-specific gene expression, it is assumed that each cDNA library represents an individual and all libraries (or the sum of available libraries) constitute a population. If both A and B alleles of an SNP in a gene X are represented in an EST library, the individual is heterozygous at the SNP in the gene X. If only allele A is represented in the EST library (Fig. 2, D1), the genotype for that individual could be either AA or AB. The probability that the individual is AA or AB can be inferred using Bayes’ rule (Weir, 1996). We consider the following three kinds of allele observations D for an SNP from a library: D1 D2 D3
the allele A appeared n times in the library, or the alleles A and B appeared n1 and n2 times respectively in the library, or the allele B appeared n times in the library. 953
Downloaded from bioinformatics.oxfordjournals.org by guest on July 15, 2011
605408 and 608434 are the two examples of SNPs selected from the top 1%, whereas 604639 is the example of SNP that was not selected. Lib denotes library id; Base indicates nucleotides of the SNP in the library; EST count refers to the number of EST clones in the library. Gene symbols are provided. Ten bases flanking each site of the SNPs are also provided.
H.Yang et al.
0.8 0.6 0.4 0.2 0.0
negative log10 of p-value
1.0
p-value distribution • • • • • • • •• ••• ••• •• •• Top 1% level •• ••• • •• ••• Top 10% level • • • • • • ••• ••••••• ••••••••••••••• •••••••••••••••••••• • • • • • • • • ••• •••••••••••••••••••••••••••••••••••••••••••••••••• •••••••••••••••••••••• ••••••••••••••••••••••••••••• • • • • • • • • • • • • • • • • • • • • • • • • • • •••••••••• •• •• 0
5000
10000
15000
20000
sorted SNP_id
With the uniform prior, the posterior probability of genotype AA with the observation of n EST clones containing the allele A was calculated as PAA|D1 = 1/(1 + 0.5n−1 ) and PAB|D1 = 0.5n−1 /(1 + 0.5n−1 ). Similarly, the posterior probability of genotype BB with the observation of n EST containing the allele B was calculated as PBB|D3 = 1/(1 + 0.5n−1 ) and PAB|D3 = 0.5n−1 /(1 + 0.5n−1 ). When both alleles appeared at least once in the library, PAB|D2 = 1, PAA|D2 = 0 and PBB|D2 = 0. Genotype frequencies, PAA , PAB , and PBB , were estimated from individual genotypes. The allele frequency is calculated as Q A = PAA + 0.5PAB and Q B = 1 − Q A . The expected heterozygote frequency based on the 954
Fig. 3. The p-values of SNPs in the data set are sorted and plotted in logarithm scale. The p-value of each SNP is computed from the Z statistics. The data set is the same as used in Figure 1 and described in Methods.
Hardy-Weinberg equilibrium distribution is calculated as Q AB = 2Q A Q B . PAB tends to be lower than Q AB for imprinted genes and genes displaying mono-allelic expression. This behavior can be analyzed using Z -statistics described in Figure 2. Bayes’ inference of genotypings and the computation of Z -statistics are two different procedures. The computational results from Bayes’ inference are used in computing Z -statistics.
RESULTS Normal tissue libraries were mined for SNPs producing a data set of 19 312 SNPs in 112 812 records. The difference between PAB and Q AB was calculated for each SNP using Z -statistics. The probability of differential allele-specific expression is indicated by the p-value for each SNP. The p-values are shown in Figure 3 in negative logarithm scale. Fifty of 19 312 SNPs in the data set are in known imprinted genes. The validity of the computational method was tested by determining if SNPs in imprinted genes had small p-values, i.e. within the top 1% (194 out of 19 312) of SNPs ordered according to increasing p-value. Four SNPs in imprinted genes were in the top 1% of the data set: three in IGF2 and one in PEG3. This finding is highly significant ( p-value = 0.0016 in one-sided Fisher’s exact test). Interestingly, when ESTs in tumor tissue libraries were used to populate the data set, only one of these four SNPs was in the top 1% of differentially expressed genes. This is consistent with the hypothesis that loss of imprinting (LOI) occurs during tumorigenesis. Bayes’ rule
Downloaded from bioinformatics.oxfordjournals.org by guest on July 15, 2011
Fig. 2. The procedure used for data processing and computation is shown schematically. Ovals denote data sets and Rectangles indicate computational processes. D1, D2, and D3 represent three kind of libraries containing the A allele, A and B alleles, or the B allele, respectively. A horizontal line represents an EST clone and genotype is indicated by A or B. n denotes the number of EST clones. The genotype probabilities for D2 and D3 are calculated as: PAB|D2 = 1; PAA|D2 = PBB|D2 = 0; PBB|D3 = 1/(1 + 0.5n−1 ); PAB|D3 = 0.5n−1 /(1 + 0.5n−1 ); PAA|D3 = 0.PAA, PAB , and PBB denote frequencies of genotypes whereas Q A and Q B represent population allele frequencies. Q AB is the expected heterozygote frequency and it is calculated as Q AB = 2Q A Q B . m denotes the number of libraries.
Computation identification of imprinted genes
was used to infer the individual genotype frequencies. As a comparison, we consider the following non-Bayesian rule in the inference: PAA|D1 = 1, PAB|D1 = PBB|D1 = 0, and PAB|D2 = 1, PAA|D2 = PBB|D2 = 0, and PBB|D3 = 1, PAA|D3 = PAB|D3 = 0.
DISCUSSION The computational method described here identifies genes with differential allele-specific patterns of expression based on the EST data. However, there are several possible reasons that the expected and observed heterozygote frequency could differ: (1) the SNP may be in an imprinted gene; (2) the SNP may be in a mono-allelically expressed gene; and (3) the SNP is from a population that is not in
ACKNOWLEDGEMENTS We thank anonymous reviewers for their suggestions to improve the paper. REFERENCES Buetow,K.H. et al. (1999) Reliable identification of large numbers of candidate SNPs from public EST data. Nat. Genet., 21, 323– 325. Feinberg,A.P. (2000) DNA methylation, genomic imprinting and cancer. Curr. Top. Microbiol. Immunol., 249, 87–99. Irizarry,K. et al. (2000) Genome-wide analysis of single-nucleotide polymorphisms in human expressed sequences. Nat. Genet., 26, 233–236. Mannens,M. et al. (1994) Parental imprinting of human chromosome region 11p15.3-pter involved in the Beckwith–Wiedemann syndrome and various human neoplasia. Eur. J. Hum. Genet., 2, 3–23. Marth,G.T. et al. (1999) A general approach to single-nucleotide polymorphism discovery. Nat. Genet., 23, 452–456. Nicholls,R.D. and Knepper,J.L. (2001) Genome organization, function, and imprinting in Prader–Willi and Angelman syndromes. Annu. Rev. Genomics Hum. Genet., 2, 153–175. Ogawa,O. et al. (1993) Relaxation of insulin-like growth factor II gene imprintining implicated in Wilms’ tumour. Nature, 362, 749–751. Rainier,S. et al. (1993) Relaxation of imprinted genes in human cancer. Nature, 362, 747–749. Strausberg,R.L. et al. (2000) The cancer genome anatomy project: building an annotated gene index. Trends Genet., 16, 103–106. Surani,M.A. (2001) Reprogramming of genome function through epigenetic inheritance. Nature, 414, 122–128. Weir,B.S. (1996) Genetic Data Analysis II. Sinauer, Sunderland, MA.
955
Downloaded from bioinformatics.oxfordjournals.org by guest on July 15, 2011
When we replaced the Bayes’ rule by the non-Bayesian rule, the SNPs in known imprinted genes had higher pvalues and were not in the top 1% of SNPs in the data set. Thus, the Bayes’ rule performs much better than nonBayesian rule. An alternative method for identifying imprinted genes was also developed. In this case, allele-specific gene expression is analyzed in libraries from heterozygotes. This approach identified 165 SNPs with differential allelespecific expression ( p-value < 0.05, Binomial test) and two of them were in known imprinted genes ( p-value = 0.0681 in one-sided Fisher’s exact test). Thus, this alternative method performs less well than the former method, although it may seem more intuitive. To examine tissue specific imprinting, we divided the data set into 22 tissue specific subsets and searched for SNPs in the imprinted genes. However, we can not reliably compute Z -statistics, since the SNP counts, the EST counts, and the EST counts per library in these tissuedivided subsets are small. Nevertheless, if we set the thresholds of 7000 for the SNP counts, 11 000 for the EST clone counts, and 1.8 for the EST clone counts per library for the specified SNP, we have three tissues with all three indices greater than the corresponding thresholds. These are kidney, heart, and placenta. From placenta, we found two SNPs corresponding to the two known imprinted genes PLAGL1 and IGF2 in the top 1% of selected SNPs. The one-side Fisher exact test shows that the two SNPs found are significant with p-value 0.026. One SNP in the known imprinted gene, p57KIP2, is selected from heart, albeit with p-value 0.148. None was found from kidney. We also examine the allelic expression of genes on the X chromosome from a subset of 16 libraries from males. Four out of 181 SNPs were selected in the top 1% with the p-value 0.108.
Hardy–Weinberg equilibrium. The performance of our computation method for imprinted genes appears pretty good with the p-value 0.0016 using the pooled libraries. The performance of the computation method for imprinted genes using tissue-specific libraries and for genes on the X chromosome is marginal. This is most likely due to smaller library size and lower EST clone numbers in these tissue-specific data sets. The performance will improve with more EST clones in Unigene. High-throughput assays are currently being developed to systematically validate the 194 SNPs identified as candidate differential allelic expressed genes and imprinted genes. Our initial validation experiment demonstrated that two out of 18 genes selected from the top 1% showed mono-allelic gene expression in fetal kidney and fetal liver using MALDI-TOF . Thus, our computational result and experimental validation demonstrates the potential utility of this computational method in identifying differential allelic gene expression and novel imprinted genes.