Projectile location for the computation of the fragment velocities. Figure 1: 35 .... The type of explosive was quoted to be Hexal P30, ..... RW Gurney, 1943, Initial Velocities of Fragments of Bombs, Shells and Grenades, BRL-Report 405, Army.
South African Ballistics Organisation Conference, Pretoria, 29 September 2014 – 1 October 2014
Computation of fragment velocities and projection angles of an anti-aircraft round IM Snyman, FJ Mostert Landward Sciences, Defence Peace Safety and Security, CSIR
ABSTRACT: This paper presents the calculation of the terminal ballistic signature of the 35 mm HEI from two viewpoints. The first viewpoint calculates fragment velocities and projection angles by the axial symmetric hydro code ANSYS AUTODYN. The second viewpoint obtains the fragment velocities by the Gurney method and the projection angles are calculated from the well-known Taylor angle formula.
1
INTRODUCTION
In recent years, the requirement of low collateral damage from a weapon system became more important as deployed forces face urban scenarios that contain innocent civilians. It is required that the civilian population be safeguarded as far as possible. This requirement also applies to anti-aircraft guns deployed on an airport within an urban environment. To this effect, we estimate the collateral damage potential of anti-aircraft 35 mm High Explosive Incendiary (HEI) warheads in encounters where these rounds self-destruct or do not detonate at all during its dynamic trajectory. In order to be able to compute a first order estimate of the destructive potential of these munitions within various application scenarios, we require a munitions terminal ballistic signature to serve as input to a higher-level simulation procedure. This paper shows how the terminal ballistic signature is calculated from two viewpoints. The first viewpoint calculates velocities and projection angles by the axial symmetric hydrocode ANSYS AUTODYN. ANSYS AUTODYN solves an initial and boundary value problem consisting of the conservation equations for mass, momentum and energy. The equation of state relates volume and pressure and is solved simultaneously with the energy conservation equation for the pressure. A burn model describes the detonation behaviour of the explosive, using the detonation velocity and Chapman-Jouget pressure and energy. The strength model relates the pressure, volumetric strain and stress in the steel and aluminium materials. The second viewpoint obtains fragment velocities by the Gurney method (Gurney 1943). The projection angles are calculated from the well-known Taylor angle formula. The approach of combining two viewpoints with very limited experimental data is necessitated by the lack of available design information about the warhead, the very complex and dynamic behaviour of materials under extreme conditions, with the objective of generating first order estimates within a constrained task with limited resources. In the following section, the statement of the problem is given after which the ANSYS AUTODYN computational model and results are shown in Section 3. The Gurney approach is discussed in Section 4. The paper is concluded with a discussion and references.
2
PROBLEM STATEMENT
The statement of the problem addressed below is to estimate the terminal ballistic signature of an antiaircraft 35 mm HEI round. The statement is simplified to some extent so that the data can be provided within the framework of the funds available. The problem addressed in this paper consists of •
Estimating the fragment velocities of the 35 mm HEI warhead as a stationary object, detonated from the fuse in a direction towards the tail end
•
Estimating the projection angles of the fragments
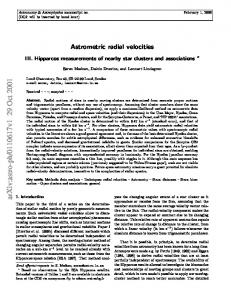
Because the warhead is assumed to be stationary for this analysis, the trajectory velocity and spin of the warhead can be added to the fragment velocities using vectors. Figure 1 shows the outline of a 35 mm HEI projectile used in the computations below.
1
South African Ballistics Organisation Conference, Pretoria, 29 September 2014 – 1 October 2014
Projectile location for the computation of the fragment velocities Figure 1: 35 mm HEI projectile
3
ANSYS AUTODYN COMPUTATIONAL MODEL
The velocity of the larger fragments is generally slower than the smaller fragments, i.e. the velocity distribution in the fragment distribution is not uniform. Due to the complexity of the fragmentation process of the shell, the axial symmetric computational model in ANSYS AUTODYN followed a pre-fragmented approach to simplify the model. The “pre-fragmented” shell consists of cylindrical rings that will separate and expand at a certain velocity.
3.1
Model Overview
Table 1 shows the position of the cylindrical rings with respect to the reference (0, 0). The tail end is from the reference point up to the first part. The first part starts at the last points on the tail end and ends at the beginning of part 2. The calculated mass of each cylinder is also shown. Table 1: The position and characteristics of the cylindrical rings
(mm)
Radial Inside (mm)
Radial Outside (mm)
Reference
0.0
0.0
15.8
Tail
10.1
0.0
15.8
1.0
10.1
10.7
16.4
2.0
20.0
10.7
17.0
3.0
30.0
10.7
17.0
4.0
41.5
10.7
17.0
5.0 6.0 7.0 8.0
50.0 59.0 68.0 77.4
11.8 12.8 13.8 14.8
17.0 17.0 17.0 17.0
9.0
85.6
14.6
16.9
10.0
94.7
14.0
16.4
11.0
107.0
13.3
15.6
12.0
118.4
12.0
14.4
13.0
128.5
10.7
13.3
13 end
138.3
10.7
12.0
Fuse
138.3
0
10.7
Fuse end
150
0
10.7
Number
Axial
Mass (g)
65 40 43 49 34 30 25 19 14 16 21 18 16 11 20
Solving a mathematical problem always require assumptions to facilitate the solution. The assumptions for the computational model are the following: •
Due to constrained project resources, an axial symmetry approach is followed, implying that the fragments are cylindrical rings about the symmetry axis.
•
The velocity and angle of initial fragment movement relate to the expansion of the ring. The warhead geometry is simplified substantially by smoothing the surface of the projectile behind the driving band. 2
South African Ballistics Organisation Conference, Pretoria, 29 September 2014 – 1 October 2014
•
The shell material of the projectile is homogenous and anisotropic, which fracture subject to a higher failure stress. To overcome this material limitation, separate rings were used that act as a prefragmented shell to some extent.
•
The Jones-Wilkens-Lee (JWL) equation of state parameters for HEXAL P30 is not available, so the parameters for H-6 are used. The explosive composition H-6 has similar projection power as Hexal P30 according to Langen and Barth, 1979. See also Section 4 below.
•
To facilitate the computation (especially the elapsed time of the runs), a rectangular aluminium solid models the mass of the fuse.
3.2
Model Set-up
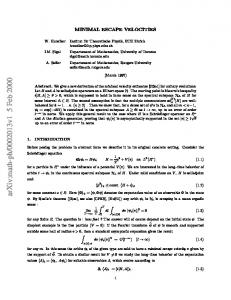
ANSYS AUTODYN calculates the velocities and projection angles. The Euler multi-material solver models the behaviour of the explosive charge with a mesh resolution of one millimetre. The explosive gas escapes across the boundaries. The Lagrange solver models the shell body and the fuse with resolution of one millimetre. The interaction algorithm controls the interaction between the Euler and Lagrange solvers. Figure 2 shows the axial symmetric mesh of the computational model.
Figure 2: Computational model used for calculating the fragment velocities Table 2 shows the material models used by the computational model. The parameter sets are from the internal Material Library (collected from open literature). Table 2: Material models and parameters used by the computation Material Explosive Shell of body Fuse of body
Parameter set H-6 Steel 4340 Aluminium
Equation of state JWL Shock Shock
Strength model Johnson-Cook Johnson-Cook
The velocity of the fragments stabilises between 40 to 50 microseconds after detonation. The end time of the computation is therefore 50 microseconds.
3.3
Computational results
The computational model took 45 minutes on a 3.2 GHz dual processor DELL Optiplex 780 to complete. Figure 3 shows four snapshots of the computational analysis. Due to the pre-fragmented shell, the explosive gas escapes early from the ogive section. At 20 microseconds, the detonation is completed and the explosive gas is interacting with the shell along the entire length of the warhead. The expansion of the gas by-products and the fragments are clearly visible at 30 and 40 microseconds. 3
South African Ballistics Organisation Conference, Pretoria, 29 September 2014 – 1 October 2014
Time 10 microseconds
Time 20 microseconds
Time 30 microseconds
Time 40 microseconds
Figure 3: Results of the computational analysis at 10 microsecond intervals The thinner sections of the shell are travelling at a higher velocity than the thicker sections towards the tail end. The tail and fuse are the largest fragments and have low velocity. Figure 4 shows the computational result at 50 microseconds, overlaid with the set-up before detonation. The direction of the fragment propagation is positive in the direction of detonation and negative in the opposite direction (see annotation in Figure 4). Note that the fragments at the front section are travelling in the opposite direction of the detonation. The absolute velocities and angles are shown. The velocity of the fuse is misleading, as it will break up in small fragments due to the nature of a typical fuse design. Only the mass of the fuse is important in this analysis as it assists in confining the detonation to some extent.
Figure 4: Computational result at 50 microseconds overlay with set-up
4
South African Ballistics Organisation Conference, Pretoria, 29 September 2014 – 1 October 2014
Table 3 shows the computational results, namely the fragment velocities and projection angles. The position is the centre of the fragment in the axial direction and is only an indication of the position relative to one another. The absolute velocity is obtained from the axial and radial velocities, namely 2 2 VAbsolute = VAxial + VRadial .
The projected fragment angle is the angle between the absolute velocity vector and the vertical. Table 3: Computational results
Part
Position
Velocity Radial Absolute (m/s) (m/s) 772 778 761 764
Projection Angle
Part-1 Part-2
(mm) 15 25
Axial (m/s) -89 -64
Part-3 Part-4 Part-5 Part-6 Part-7 Part-8
36 46 55 64 73 82
-69 -150 -171 -203 -224 -89
765 818 967 1108 1327 1581
768 832 982 1127 1346 1584
5 10 10 10 10 3
Part-9 Part-10 Part-11 Part-12 Part-13
90 101 113 123 133
12 8 164 319 425
1514 1452 1341 1030 472
1514 1452 1351 1078 635
-1 0 -7 -17 -42
(°) 7 5
Figure 5 gives a graphical representation of the fragment velocities and the projection angles of part 1 to 13. On the horizontal axis, to the left is the tail and to the right is the fuse. On the left vertical axis is the absolute velocity and on the right hand side is the projection angle in degrees. The straight lines between the calculated points representing the cylinders indicate linear interpolation.
Figure 5: Absolute velocities and projection angles of the fragments
5
South African Ballistics Organisation Conference, Pretoria, 29 September 2014 – 1 October 2014
4
ANALYTICAL PREDICTION OF THE FRAGMENT VELOCITY AND ANGLE DISTRIBUTION OF A 35 MM ROUND
A drawing of the geometry and an outline of the general material characteristics of a 35 mm anti-aircraft shell was supplied and the dimensions in Figure 1 were used. The type of explosive was quoted to be Hexal P30, a 70/30 mix of RDX and aluminium. The detonative properties of this explosive could not be found in open literature.
4.1
Methodology and Assumptions
In the analytical approach, the fragment mass distribution will not be addressed. This could have been deduced from the Mott distribution (Tanapornraweekit and Kulsirikasem, 2011): 1
N(m ) =
M0 2Mk2
−
e
m2 Mk
.
(1)
In equation 1 the number of fragments of a certain mass, m, is given by N(m) and the other constants (determined by experimentation and pit tests) is explained by Tanapornraweekit and Kulsirikasem, 2011. However, the fact that a soft recovery fragment distribution is given, implies that this can be used directly, since the smaller fragments in the Mott distribution is of lesser significance. The methodology then focusses only on the calculation of the fragment velocities. This is done as a function of the axial distance along the symmetry axis of the shell as is shown in Figure 1. An important assumption, using the Gurney approach, is that only the radial thickness of the explosive at a specific axial position contributes to the velocity of the casing. The detonation of the shell is assumed to originate at the fuse end in Figure 1. Since the detonation parameters of Hexal is not known, the parameters of another similar aluminised explosive, H-6, was used. H6 contains a little less aluminium (25%) but the 75% energetic material is made up by 45% RDX and 30% TNT. It is assumed that the increase of 5% energetic content in H-6 compared to Hexal is balanced out by the fact that TNT is less energetic than RDX. The detonation velocity and Gurney energy of H-6 was obtained from Koch et al, 2002 to be 7900 m/s and 2580 m/s respectively. It is also assumed that the Gurney, 1943, approximation to the calculation of fragment velocities is valid. The Gurney equation for a solid cylindrical section (of infinite length) is given by
M Vf = 2E + 0.5 C
− 21
,
(2)
where Vf is the fragment velocity, 2E is the Gurney energy and M/C is the charge to metal mass ratio. The charge to metal mass ratio is calculated from the densities and geometries of the materials in the shell. The correction to the Gurney velocity due to edge relaxation of the detonation products is calculated by the method of Hennequin, 1986:
M Vf = 2E + 0.5 CF x
− 21
,
(3)
where Fx is a relatively complex function of the length-to-diameter ratio, charge to mass ratio, geometry and edge confinement of the shell or warhead. The constants in (3) are from Hennequin, 1986, despite differences in L/D and M/C values. The projection angles of the fragments were calculated from the well-known Taylor angle formula: sin α =
Vf cos i , 2D
(4)
where α is the fragment projection angle with respect to a vector normal to the detonation direction, D is the detonation velocity and i is the angle between the detonation front and the normal to the explosive metal interface. These angles need also to be corrected for relaxation edge effects due to venting, and for this purpose, the approach of Kȍnig 1987 was used. This approach uses the first derivative of the Fx function of Hennequin, 1986, as the primary parameter in the correction function. A Python program was written to incorporate all the functions and the geometry data of the shell, material density of steel and H-6 and explosive parameters for H-6 were used as input. The output is in the form of a 6
South African Ballistics Organisation Conference, Pretoria, 29 September 2014 – 1 October 2014
table of the parameters as a function of the axial coordinates along the shell and graphs of velocities and angles.
4.2
Computational Results
The calculated results for the 13 segments (excluding the tail end and the fuse) of the shell are shown in Table 4, Figure 6 and Figure 7. The data in Table 4 contains the axial position, calculated charge to mass ratio (M/C), velocity prediction straight off the Gurney equation, the velocity corrected for edge effects, the Taylor angle and the projection angle corrected for edge effects. A negative angle implies an angle off the normal on the symmetry axis in the opposite direction to the detonation direction. Table 4: Calculated parameters for the 35 mm shell Part
X(mm)
M/C
Fx
dFx/dx
Part-1 Part-2 Part-3 Part-4 Part-5 Part-6 Part-7 Part-8 Part-9 Part-10 Part-11 Part-12 Part-13
10.1 20.0 30.0 41.5 50.0 59.5 68.0 77.4 85.6 94.7 107.0 118.4 128.5
6.4 7.2 7.2 7.2 5.1 1.5 1.5 1.5 1.6 1.7 1.8 2.0 2.5
0.417 0.577 0.693 0.795 0.854 0.907 0.942 0.969 0.981 0.981 0.952 0.883 0.757
0.207 0.162 0.116 0.089 0.070 0.055 0.042 0.028 0.015 0.000 -0.023 -0.061 -0.125
Gurney Vf (m/s) 949 898 898 898 1058 1229 1452 1752 1713 1669 1654 1566 1433
Corrected Vf (m/s) 626 691 755 806 984 1417 1417 1731 1700 1656 1622 1488 1273
Uncorrected
Taylor o Angle( ) 3.4 3.3 3.2 3.1 3.5 3.9 4.0 3.9 2.2 0.4 -1.3 -3.3 -4.1
Corrected o Angle( ) 6.8 6.1 5.2 4.6 4.5 4.6 4.4 4.2 2.4 0.4 -1.4 -3.3 -4.4
Corrected
2 000
Fragment Velocity (m/s)
1 800 1 600 1 400 1 200 1 000 800 600 400 200 0 0
20
40
60
80
100
120
140
Distance along the symmetry axis (mm) Figure 6: Predicted Fragment velocities along the symmetry axis of the 35 mm shell
7
South African Ballistics Organisation Conference, Pretoria, 29 September 2014 – 1 October 2014
Uncorrected
Corrected
8.0
Angle (degrees)
6.0 4.0 2.0 0.0 0
20
40
60
80
100
120
140
-2.0 -4.0 -6.0
Distance along the symmetry axis (mm)
Figure 7: Predicted projection angles along the symmetry axis of the 35 mm shell
5
Discussion
There could be some criticism on the choice of the Gurney energy of H-6 for the calculation of Hexal P30 properties. However, if there is erred in this approach, it will be towards the high end as can be noted from Langen and Barth, 1979. The slower velocity obtained in the first part of the warhead (lower axial coordinates) is due to the relatively thick casing in that region and the abrupt change in the velocity corresponds to the sudden change in casing thickness in the middle of the warhead. It is also clear from the experimental measurements that the larger fragments (originating from the thicker part of the casing) should be the slower fragments. This statement is because there is a sharp decrease of average velocity over a very short distance interval. The velocity correction for edge effects in the lower axial coordinate part of the warhead should be mostly ignored. This is due to the thick bulkhead on that end of the warhead that should inhibit detonation gas relaxation at that end long after the casing on the circumference has ruptured. The prediction of the fragment projection angles will be relatively good in the centre of the warhead but inaccurate at the edges of the warhead. Firstly, the fuse was not accurately modelled in the analytical approach and secondly, the deformation of the relatively thick bulkhead at the opposite end from the detonation will have a strong bearing on the fragment angles. If these angles were used in further analysis, it would be better to use the corrected angle distribution since it gives the worst-case scenario.
6
CONCLUSION
The calculation of the fragment velocities by the two methodologies yields values that suggest a similar trend. The first three columns in Table 5 compare the projection velocities of the thirteen parts. Parts 3 to 9 have similar velocities. ANSYS AUTODYN takes care of the gas expansion (end effects) over the extended period and a better approximation of the fragment velocity is obtained. The same argument applies to the parts closer to the tail and the fuse. Nevertheless, the trend of the results is similar. The calculation of the fragment projection angles by the two methodologies yields values that suggest a similar trend, although the size of the angles differs substantially (see the last three columns in Table 5). This is because the correction factors on the projection angles in the analytical approach are extremely sensitive to the exact failure mode on the warhead, and the coefficients have not been adequately quantified for this warhead.
8
South African Ballistics Organisation Conference, Pretoria, 29 September 2014 – 1 October 2014
Table 5: Comparison of fragment velocities and projection angles between the two methodologies
Part
Position
Velocities
Projection angles
AUTODYN
Gurney
Difference
AUTODYN
Gurney
Difference
(mm)
(m/s)
(m/s)
(%)
(°)
(°)
(%)
Part-1
15
778
626
22%
7
6.8
0%
Part-2
25
764
691
10%
5
6.1
-19%
Part-3
36
768
755
2%
5
5.2
4%
Part-4
46
832
806
3%
10
4.6
78%
Part-5
55
982
984
0%
10
4.5
77%
Part-6
64
1127
1177
-40%
10
6
54%
Part-7
73
1346
1417
-24%
10
5.2
60%
Part-8
82
1584
1731
-9%
3
4.2
-25%
Part-9
90
1514
1700
-12%
1
2.4
-105%
Part-10
101
1452
1656
-13%
0
-0.4
2120%
Part-11
113
1351
1622
-18%
-7
-1.4
133%
Part-12
123
1078
1488
-32%
-17
-3.3
136%
Part-13
133
635
1273
-67%
-42
-4.4
162%
The results of the ANSYS AUTODYN computation take into account the accumulation effect of the blast generated by the detonating warhead on the fragments. The effect of the blast on its own is not captured because it is assumed that the warhead will detonate at such a height that is larger than the safety region for the explosive mass in the warhead. However, this aspect must be evaluated further if necessary. Changing the geometry of the rings (by increasing the number of rings for example) will affect the projection velocity and angle to a minor extent, but not the trend as predicted by both methodologies. In conclusion, it should be noted that the formation of fragments of a solid shell is not exact when compared to a prefragmented shell presented here. Within the framework provided by the project requirements and subsequent assumptions, the results of the ANSYS AUTODYN computation will be adequate to estimate ground impact regions and address first order operational safety and lethality concerns (although it is not an extensive study).
7
REFERENCES
RW Gurney, 1943, Initial Velocities of Fragments of Bombs, Shells and Grenades, BRL-Report 405, Army Ballistic Research Laboratory, Aberdeen Proving Ground, 1943 E Hennequin, 1986, Influence of the Edge Effects on the Initial Velocity of Fragments from a Warhead, Proceedings of the 9th International Symposium on Ballistics, Shrivenham, UK A Koch, N Arnold, M Esterman, 2002, A Simple Relation between the Detonation Velocity of an Explosive and it’s Gurney Energy, Propellants, Explosives and Pyrotechnics, 27, pp365-368 PJ König, 1987, A correction for ejection angles of fragments from cylindrical warheads, Propellants, Explosives and Pyrotechnics 12 (5), pp154 – 157, October 1987 P Langen and P Barth, 1979, Investigation of the Explosive Properties of HMX/Al 70/30, Propellants, Explosives and Pyrotechnics 4 (6), pp129-131, December 1979 G Tanapornraweekit and W Kulsirikasem, 2011, Effect of Material Properties of Warhead Casing on the Natural Fragmentation Performance of High Explosive (HE) Warhead, World Academy of Science, Engineering and Technology 59
9