for three typical cellular handset antennas and the re- sults are verified with propagation ... one user of a mobile phone to another [2], indicating that the amount of ..... persons,â in 48th Vehicular Technology Conference,. VTC '98, pp. 505-509 ...
COMPUTATION OF MEAN EFFECTIVE GAIN FROM 3D MEASUREMENTS Jesper D. Nielsen
Gert E Pedersen
Kim Olesen
IstvAn Z . KovAcs
Center for PersonKommunikation, Aalborg University Fredrik Bajers Vej 7A-6,9220 Aalborg 0,Denmark Fax:+4598151583 e-mail: jni@cpk. auc.dk Abstract - Performance evaluation of antennas used in the a mobile radio channel is a non-trivial task because of the multipath propagation inherent to this type of channel. A useful measure of the performance of a given antenna is the mean effective gain (MEG) which is the mean received power relative to some reference. In this paper computation of the MEG is investigated based on measurements of the 3D signal distribution in an indoor environment, where the transmitter is placed outside, as in a typical urban micro cell. A main advantage of the method used is that performance testing of different antenna designs in an environment can be carried out with a single propagation measurement and measurements of the antenna radiation patterns. In the paper MEG results are given for different receiver locations in the building for three typical cellular handset antennas and the results are verified with propagation measurements made directly with the antennas.
space and knowledge of the antenna radiation pattern. This has the advantage of allowing the computation of the MEG for a specific antenna without propagation measurements once the power distribution in the environment is known. The current paper presents MEG results for today's typical handset antennas based on measurements of the 3D signal distribution inside an office building located in a micro cell environment. The MEG results for three different antennas are compared to power measurements made directly with the three antennas.
11. MEASUREMENTS The investigations were carried out using a dual channel correlation sounder for measuring the complex channel impulse responses observed on the down-link between a base station and a mobile user in an urban environment. A center frequency of 1.89 GHz was used and the sounder had a bandwidth of approximately 20 MHz. The sounder has an instantaneous dynamic range of approximately 30 dB and an overall dynamic range of 80 dB.
I. INTRODUCTION It is widely recognized that the mobile radio channel is an important issue in wireless transmission systems, such as a cellular system. A main cause of the problems is the multipath propagation that takes place in the channel generally making the channel both time-dispersive as well as time-varying [l]. A major concern in system design is the amount of power that a receiver antenna collects from the propagation environment. It has been shown previously that the power received for the same multipath conditions can vary up to 10 dB from one user of a mobile phone to another [2], indicating that the amount of received power is sensitive to what the (effective) antenna pattern looks like. The MEG is a useful measure for evaluating the performance of an antenna in a scattering environment. The MEG is the power received by the antenna with respect to some reference [3]. In [4] it is shown how the MEG can be computed from measurements of the power distribution in
0-7803-5565-2/99/$10.0001999 IEEE
787
The measurements were performed in an urban environment in the city of Aalborg with the transmitter on the roof of a twelve-story building which is higher than most of the surrounding buildings. The receiver was located approximately 700 m away inside a four-story office building and uses a dual polarized narrow-beam horn antenna (beamwidth about 30") mounted on a positioning device controlled by step motors. The device, henceforth referred to as the pedestal, allows steering the horn antenna direction into a desired combination of azimuth and elevation angle. The direction of the horn antenna is controlled by an acquisition program collecting the measurements. For each position of the receiver a series of impulse response (IR) measurements was obtained with
the antenna pointing in 72 x 15 directions, Le., all combinations of the azimuth angles 0,5", lo", . . . ,355' and the elevation angles 40", 45", 50", . . . ,110", where the
the solid angle R and delay r. As (fl, r ) may be viewed as a directional IR for the 8-polarization, and similarly A4(R, T) for the $-polarization. Denoting the expectation operator by E the total received power is given by
directions are given in usual spherical coordinates. IRs for both the 8- and the $-polarizations were measured simultaneously. Each series of such measurements, subsequently referred to as a record of measurements, characterizes in 3D the actually received signals as seen by any antenna located at the same position. For these measurements it is assumed that no signals arrive from directions outside the measured set of directions and furthermore that the channel is essentially constant during the measurement duration of about 12 min. On each floor of the building three records of measurements were obtained inside the same room, where the measurement locations were separated by approximately 1.5 m.
(e),
PreC =
/
& ( l h ( ~ )d~ I ~=)
f IEe(R)12Qo(f12)
+ I ~ % ( R > l ~ Q d fdfl l)
(2)
) ~ ~and ) similarly for where Q~(02)= & ( ( A ~ ( R , T dT the $-polarization. In arriving at (2) it was used that
&[Ae(a, ~ ) A i ( f l 'T)] , = 1 [IAo(f4 T)l2]S(fl - fl') and similarly for the $-polarization. The cross-terms €[A~(R,r)A;(fl',r)] = 0. These assumptions can be verified given that the phases of are independent for different angles and furthermore independent of the amplitude. A power density function can be defined as
In each room where the pedestal measurements took place, a number of measurements were also made with a commercially available GSM- 1800handset. The handset has been modified to include a back mounted patch antenna in addition to the build-in helixlwhip antenna. The patch antenna was designed for minimum radiation towards the user's head. The antennas are connected to the sounder via cables, and two antennas are measured at a time. The patch is used twice and denoted as either 'Patch(W)' or 'Patch(H)' depending on which antenna it is measured together with. The handset measurements were made by carrying the handset fixed with a tilt of 54" from vertical to a wooden stick, imitating free space conditions (the person carrying was not near the handheld). The handset was carried along a square path of some 2 m by 4 m around the three positions where the pedestal measurements were made. Approximately lo3 IR measurements were made while the handset was moved, corresponding to about 2 rounds.
Pe(fl) = Q~(fl)/c~ CO=
f Qe(fl)
where P+(fl)and Cd are defined similarly. C+ and Ce represent the power available in the environment for the two polarizations, and hence a measure of the effectiveness of the antenna is
1
+ IEo(R)I2pm(fl)1+x
dfl
(3)
where x = Co/C$ is the cross polarization ratio (XPR). The G quantity is named the MEG.
On all levels the rooms in which the measurements were made had windows towards the transmitter, except on the first floor where the windows were in the opposite direction. All the measurements were made in a non-line-ofsight situations.
IV. MEASUREMENT PROCESSING The MEG computations are based on the pedestal measurements using the horn antenna. The horn antenna has two outputs, one for each polarization, with essentially no cross-coupling, and hence the output of one port can be written as [c$ (l)]
111. MEAN EFFECTIVE GAIN The received signal can be modeled as a linear convolution of the transmitted signal with a complex IR h ( r ) assumed to be time-invariant. Using that the signal received by an antenna is a weighted integration of the signal distribution in space [ 11, it is straightforwardto verify that the IR can be written as
v(A; T) =
I
E ( h ;R)A(R, T ) dR
(4)
where v(A; T ) is the IR measured in the direction A = (A, p ) , E(A, R) is the electric field pattern of the horn pointing in the A direction and A is the angular IR, both for either the 8- or the $-polarization. Applying the same assumptions as used for arriving at (2) the total expected power at one of the antenna ports is
where Eo and E4 are the complex electric field components of the antenna, and As and A4 describe the signal distribution for the two polarizations as a function of
&'(A) =
/
&(Jv(A;7)12) d r =
f IE(A;fl)I2Q(R) do (5)
788
where Q is defined as above for one of the polarizations. The power IA(R, . ) I 2 is not expected to change significantly within a local area and therefore Q ( 0 ) N J IA(R, . ) I 2 d ~i.e., , Q(R) can be computed from a single pedestal measurement. Note that this changes the meaning of 'mean' in MEG, as defined by [4]. The MEG values are computed using (3), where Eo/$ is the measured handset antenna pattern.
the path. For each of the IRs the received power is computed and the mean value of the instantaneous power values is then used as the power for the current antenna/position combination. For both pedestal and handset measurements back-to-back measurements of the measurement system are used to correct differences in branch power due to imperfections in the measurement system.
Although the horn antenna used for the pedestal measurements has a narrow beamwidth the measurements obtained with sampling intervals of only 5" in both azimuth and elevation angle cannot be considered independent. Eq. 5 can be approximated as
V. RESULTS
where A, and A, are the angular sample intervals. Thus the measured Q' in direction A may be seen as the output of a 2D linear filter, where the filter IR is the determined by the horn antenna pattern. Since the channel is constant during a pedestal measurement Q can be obtained from the horn antenna output by performing a deconvolution of the antenna pattern. The measurements of Q' can be written as a matrix equation,
where y is a column vector of the &'(A, p ) values for the different measurement directions, B is a matrix containing the measured horn antenna pattern for all directions, and e is a noise vector. x is a column vector with the desired samples of Q.From this model it is seen that Q can be found by solving the matrix equation in (6) for 5 . In general the B matrix may be singular and therefore Tikhonov regularization is used to obtain useful results [5]. In this method the solution 2 is found as (7)
where ~ i ' sare the N singular values of B , ui and vi the corresponding singular vectors, and a = a,a, is a regularization parameter. An optimum value of a, is chosen according to the principle of generalized crossvalidation [5]. a, # 1 is used to investigate the sensitivity to the a parameter. Due to noise, model inaccuracies etc., the deconvolution may result in negative 5 elements. Since the 2 elements represent power quantities this is non-physical. In this work the negative values are simply truncated to zero. From each handset record about lo3 IR measurements are obtained corresponding to different positions along
789
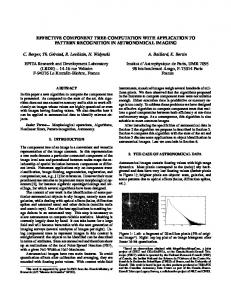
Fig. 1-2 shows MEG curves computed from the pedestal measurements and the measured handset antenna patterns by rotating each pattern in azimuth and for each 5" rotation (3) is evaluated. No deconvolution of the horn antenna was used for these plots. Each polar plot contains MEG curves for one antenna on all floors, where three curves are shown for each floor, corresponding to the shifted pedestal measurements. As expected, the changes in MEG for the different positions on the same floor are small. Furthermore, it is noticed that the curves for Patch(W) and Patch(H) are very similar. The different shapes of the MEG curves are a result of a combination of the 3D power distribution and the antenna pattern. On all the floors the direction for most received power is towards the windows, which is in the same direction for all floors except on the lst, where it is in the opposite direction. This is clearly visible on the MEG curves. The variation in MEG over azimuth angle is generally quite small, say 2-3 dB, which may be explained by the relatively small directivity of the antennas. The helix is the one closest to being omni-directional in azimuth as noticed especially for the ground floor measurements. On the other hand, in the 0-polarization the patch antenna is quite directional with a min/max ratio of about 10 dB at I3 = 90°, but this is to some degree compensated for by the more omni-directional, and often larger, gain in the 4-polarization. In Tab. 1 the mean power obtained form the handset measurements is shown relative to the power of the Patch(W) antenna. Similarly, Tab. 2 contains the mean values for the MEG results, relative to the values for the Patch(W) antenna.
Floor
Patch(W)
2nd 3rd
0.0 0.0
Whip
2.8 1.3
Patch(H)
0.0 -0.6
Helix
3.3 1.6
Table 1: Mean received power in dB for handset measurements, normalized to the mean power for Patch(W).
The mean MEG is computed as first the mean over different azimuth angles and then a mean value is computed from the mean values obtained at the three positions on each floor. Clearly, the numbers in Tab. 1 and Tab. 2 do not match. However, the difference, shown in Tab. 3, reveals a structure with a nearly constant offset for each floor. In this light the handset antennas were examined and it was concluded that the patch antenna has changed in between the handset measurements and the antenna pattern measurements. This is a likely cause to the offset.
Patch(W). No deconvolution. ''-5
dB
0
Patch(H). No deconvolution. 240
I /
\
''-5
dR
300
270 Whip No deconvolution
0
180
270
240
I
\
/
Helix. No deconvolution. 90 -5 dB
300
270
Figure 1: MEG values for Patch(W) and Whip. No deconvolution was used.
Floor Gnd
I
I
Patch(W) 0.0
I
I
Whip 0.3
I
I
Patch(H) -0.2
I Helix I
1.2
240
1I /
300
270
Table 2: Mean pedestal MEG values normalized to Patch(W). All the values are in dB and no deconvolution is used.
Figure 2: MEG values for Patch(H) and Helix. No deconvolution was used.
790
2nd 3rd
0.0 0.0
3.3
0.3
3.2 1.8
Table 3: Offset in dB of the values in Tab. 2 from the values in Tab. 1.
antennas and the received power differences for the antennas were compared to the MEG differences. There seems to be a good agreement, but strictly affirmative conclusions cannot be drawn because of problems with one of the antennas. Furthermore, deconvolution of the horn antenna used for the 3D measurements was tested and found not to be necessary for these antennas.
ACKNOWLEDGMENTS To investigate the influence of horn antenna pattern on the 3D measurements, deconvolution has been tested. Tab. 4-5 shows the results, that can be compared to Tab. 2 where no deconvolution was used. Deconvolution only plays a minor role most likely because of the small directivity of the handset antennas masking the directional resolution of the 3D measurements.
2nd 3rd
0.6
Patch(W)
Whip
Patch(H) -0.2 -0.2
1 2: 1 1 1 1 0.0 0.0
0.6
-0.2
-0.6
-0.2
REFERENCES (1) W. C. Jakes, Microwave Mobile Communications. IEEE Press, 1974. (2) G. E Pedersen, J. 0. Nielsen, K. Olesen, and I. Z. Kovacs, “Measured variation in performance of handheld antennas for a large number of test persons,” in 48th Vehicular Technology Conference, VTC ‘98,pp. 505-509, IEEE, May 1998.
Table 4: Mean MEG values normalized to Patch(W). All the values are in dB and deconvolution with a, = 1 is used.
Floor Gnd 1st
The work presented in this paper has been sponsored by TeleDanmark. The authors are grateful for the possibility to publish this paper.
J. B. Andersen and E Hansen, “Antennas for VHF/UHF personal radio: A theoretical and experimental study of characteristics and performance,” IEEE Transactionson Vehicular Technology,vol. 26, pp. 349-357, NOV.1977. T. Taga, “Analysis for mean effective gain of mobile antennas in land mobile radio environments,” IEEE Transactionson Vehicular Technology,vol. 39, pp. 117-131, May 1990.
Helix 1.5 2.1 -0.3 0.2
P. C. Hansen, “Regularization tools, a Matlab package for analysis and solution of discrete ill-posed problems,” tech. rep., Department of Mathematical Modelling, Technical University of Denmark, DK-2800 Lyngby, Denmark, 1992. http://www.imm.dtu.dk/”pch.
Table 5: Mean MEG values normalized to Patch(W). All the values are in dB and deconvolution with aT = 5 is used.
VI. CONCLUSION 3D wide-band measurements of the received signals in an indoor office environment have been obtained, where the transmitter was placed about 700 m away, mimicking an urban micro cell scenario. From the 3D measurements and measurements of three handset antenna radiation patterns MEG values were computed for different azimuth rotations of the antennas on four floors of the measured building. The antennas are typical for today’s handsets: a whip, a helix, and a patch antenna. Measurements were also conducted directly with the handset
79 1