six frontal plane leads ( Standard leads I, II, III , AVR, AVL and AVF). The R-R interval of each ECG wave is detected by square derivative technique.
Computation of QRS Vector of ECG Signal for Observation of It’s Clinical Significance S. Mitra1 , M. Mitra2 , and B.B. Chaudhuri1 1
2
Computer Vision and Pattern Recognition Unit,Indian Statistical Institute, Kolkata, India Department of Applied Physics, Faculty of Technology, University of Calcutta, Kolkata, India {sucharita r,bbc}@isical.ac.in, {mmaphy}@caluniv.ac.in
Abstract. An automated approach for computation of the frontal plane QRS vector and an important observation of its clinical significance is described in this paper. Frontal plane QRS vector is computed from the six frontal plane leads ( Standard leads I, II, III , AVR, AVL and AVF). The R-R interval of each ECG wave is detected by square derivative technique. The baseline or isoelectric level of every ECG wave is determined. After that the net positive or net negative deflection (NQD) of QRS complex is detected. Net positive or net negative deflection in any lead is obtained by subtracting the smaller deflection (+ve or –ve) from the larger deflection (-ve or +ve). An algorithm is developed for computation of the exact angle,amplitude and direction of the frontal plane QRS vector from maximum and minimum NQD. In the present work, the PTB diagnostic ECG database of normal and Myocardial Infarction (MI) subjects is used for computation of the QRS vector. An interesting clinical observation that, the rotation of QRS axis for MI data may significantly detect the region of the infarcted cardiac wall, is reported in this paper. Keywords: ECG, software, QRS vector, NQD, baseline.
1
Introduction
The electrocardiogram (ECG) represents a graph of variation of electric potential generated by the heart and recorded at the body surface. Clinically, the frontal plane QRS vector represents the average direction of ventricular activation in the frontal plane. So, magnitude and direction of QRS vector is an important aid for accurate and deductive evaluation of the Electrocardiogram. It is important to realize that two components are important in determining the appearance of the QRS complex in any given lead: the direction of electrical forces relative to the lead, and the magnitude of forces. If the cardiac vector is parallel to a particular lead, it will make greatest impression on that lead. So electrocardiograph will record maximum deflection. If the cardiac vector is directed towards the positive pole of that lead, the deflection will be positive. A. Ghosh, R.K. De, and S.K. Pal (Eds.): PReMI 2007, LNCS 4815, pp. 439–446, 2007. c Springer-Verlag Berlin Heidelberg 2007 �
440
S. Mitra, M. Mitra, and B.B. Chaudhuri
Minimal deflections will be formed when cardiac vector is perpendicular to the lead. Cardiac vector is used for identifying myocardial ischaemia during carotid endarterectomy[3] and also to locate major anatomical position of the injured region in the heart ventricles for various localizations of the lesion[4]. On the other hand, detection of R-R interval is essential for the task of ECG analysis. A great amount of research effort has been devoted in the development and evaluation of automated QRS detectors [5]. Two types of QRS detectors have been developed. There are two parts in these detectors. One is the processor and the other is the decision rule[6]. The processor performs linear filtering and non-linear transformation. It produces a noise-suppressed signal in which the QRS complexes are enhanced. The decision rule detects or classifies whether the enhanced parts are QRS complexes or not. Hidden Markov models [7] and other pattern recognition approaches are also used for detection of QRS complexes [8, 9]. In another scheme, simple morphological operator is used for detection of the same complexes[10]. In this approach the operator (openings and closings) works as peak-valley extractor. Different wavelet functions are also used for QRS complex detection in ECG. It has been noted that wavelet functions that support symmetry and compactness provide better results [11]. In another scheme a QRS complex detector based on the dyadic wavelet transform (DWT), which is robust to time varying QRS complex morphology and to noise, has also been developed [12]. Another approach for QRS detection is an adaptive matched filtering algorithm based upon an artificial neural network (ANN). An ANN adaptive whitening filter is used to model the lower frequencies of the ECG signals which are inherently non linear and non-stationary. The residual signal which contained mostly high frequency QRS complex energy was then passed through a linear matched filter to detect the location of the QRS complex [13]. In the present work, a software-based approach for detection of frontal plane QRS vector for both normal and pathological subjects is proposed. Some interesting clinical properties are observed, which are stated in the paper.
2
Methodology
For computation of frontal plane cardiac axis the following steps are involved: 2.1
Determination of R-R Interval of ECG Wave
Proper detection of the R-R interval between two consecutive ECG waves is very important for various applications. In the present work,differentiation technique is used to get second order derivative of ECG wave by using 5-point Lagrangian interpolation formula for differentiation [1]. The formula is given below: 1 h4 (f−2 − 8f−1 + 8f1 − f2 ) + f v (ξ) (1) 12h 30 Here ξ lies between the extreme values of the abscissas involved in the formula. After squaring the values of second order derivative, a square-derivative curve f0� =
Computation of QRS Vector of ECG Signal
441
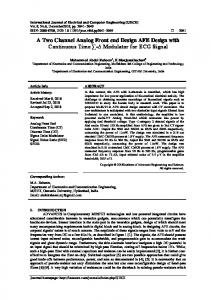
Fig. 1. R-R Interval Detection
having only high positive peaks of small width at the QRS complex region can be obtained (fig. 1). A small window of length (say W) was taken to detect the area of this curve and we obtained maximum area at those peak regions. The local maxima of these peak regions are considered as R-peak. An experiment with considerable number of test samples was done for choosing of appropriate value of W and was set at ∼0.07sec. The system was tested for both noise free and noisy signals. The levels of all types of noise were increased from 10% to 30% and we achieved 99.8% to 98.1% accuracy in the detection of QRS complexes. The performance comparison of this method with other existing methods is given in [15]. 2.2
Detection of Base Line or Isoline
In order to accurately detect the net QRS deflection, isoelectric line must be correctly identified. Most methods are based upon the assumption that the isoelectric level of the signal lies in the region ∼80 ms left of the R-peak, where the first derivative becomes minimum. In particular, let y1 , y2 , ..., yn be the samples of a beat, y�1 , y�2 , ..., y�n−1 be their first differences and yr the sample where the Rpeak occurs. The isoelectric level samples yb are then defined if either of the two following criteria is satisfied:
442
S. Mitra, M. Mitra, and B.B. Chaudhuri
|y�r−j−int(0.08f ) | = 0, j = 1, 2, . . . ., 0.01f or |y�r−j−int(0.08f ) | ≤ |y�r−i−int(0.08f ) |, i, j = 1, 2, . . . ., 0.02f
(2)
where f is the sampling frequency. After the isoelectric level is found, and after comparing the current beat with the previous corrected one (ypbp ), it is easy to align the current beat with the previous one, using the declination of the line connecting the isoelectric levels of the two beats. If we define, γ =
yb − ybpp
(3)
nb
where nb is the number of samples between the two baseline points, the alignment procedure becomes: yb
→
y pbp + γ
ybpp
(4)
Other baseline correction techniques rely on adaptive filtering of the ECG beat and provide reliable results as well, however the QRS wave shape is corrupted by the use of such techniques [2]. 2.3
Computation of Net QRS Deflection (NQD) in a Lead
After detection of baseline, the location of Q wave is determined by searching the first transition from inclination to declination or vice versa from the R point. After getting q point the net QRS deflection can be computed from the following equation: N QD = (Qpt − avg− bpt) + (Rpt − avg− bpt)(4)
(5)
Where, Qpt = Q point, Rpt = R point, avg-bpt = Average baseline point 2.4
Detection of Frontal Plane Cardiac Axis
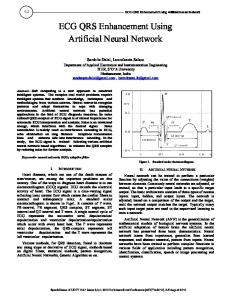
An algorithm is developed for detection of cardiac axis on the basis of the following rules. (1) Look for a limb lead with NQD close to zero. This could be either a lead with very little recognizable deflection in either direction, or equally large positive and negative deflections, such that the sum of positive and negative deflections is close to zero. The mean electrical axis will then be either perpendicular or 2700 out of phase to this lead depending on the sign (+ve or –ve) of NQD at that lead. For example, if lead I has close to zero net amplitude, the axis would be either +90◦ or -90◦ (fig. 2). Then, look at any of the inferior leads: II, III, or AVF. If these leads register a predominantly positive deflection, the QRS axis will be closer to +90◦ . If the inferior leads (II, III, AVF ) are predominantly negative, the axis is closer to -90◦ . (2) Sometimes, no ECG lead can be identified which appears to have zero netamplitude i.e, NQD �=0 in every lead. In this case, decide which lead(s)have
Computation of QRS Vector of ECG Signal
443
Fig. 2. Angle of different limb leads from the frontal plane
the largest positive or negative deflections. The QRS axis will be close to the direction of this lead. The algorithm for detection of the angle and the amplitude of the QRS vector is as follows: 1. Find the maximum and minimum NQD for all the six limb leads. Let them be MAX and MIN, respectively. 2. Calculate the angle of the lead having maximum NQD from the lead I. Let the angle be θ1. 3. Calculate θ2 = |tan−1 (M IN /M AX)|, where θ2 is the angle of the QRS vector from the lead containing minimum NQD. 4. Calculate the angle of the lead having minimum NQD from the lead I. Let the angle be θ3. 5. If θ3 is clockwise rotated from θ1 then θ = θ1 + θ2, where θ is the angle of QRS axis from lead I. 6. Otherwise, if θ3 is anti-clockwise rotated from θ1 then θ = θ1 – θ2.
3
Result
Our observation is being continued on 50 normal and 50 diseased subjects having myocardial infraction (MI) of PTB diagnostic ECG database available in
Fig. 3. Normal distribution of QRS axis
444
S. Mitra, M. Mitra, and B.B. Chaudhuri
Fig. 4. Abnormal distribution of QRS axis
Fig. 5. The separation of Myocardial wall along with the electrical axis of heart
physionet. The net QRS height along with the angle of direction of QRS vector for all the six limb leads for normal and MI subjects are given in table 1 and 2. Fig. 3 shows that the normal distribution of QRS axis ranges between 300 –600 in nearly 84% cases whereas in fig. 4 it is observed that the abnormal distribution of QRS axis varies within a wider range and also it detects the location of the infarcted regions specially inferior and lateral walls between the 4 Myocardial walls (anterior, inferior, lateral and septal) as the frontal plane leads cover these two walls of the myocardium. These 4 walls there are also divided into another 4 regions named antero-septal (AS), antero-lateral (AL), infero-septal (IS)and infero-lateral (IL) and infarction at AL and IL can also be detected from the rotation of the QRS vectors. The antero-lateral surface of the left ventricle is oriented towards lead AVL and positive pole of standard lead I. On the other hand, according to the basic principle, the initial QRS vector is directed away
Computation of QRS Vector of ECG Signal
445
Table 1. A portion of detected NQD and angle of QRS vector for Normal Subjects Patient ID. s0461 s0462 s0463 s0464 s0466 s0467 s0469 S0470 s0474 s0478
re re re re re re re re re re
L1 0.73990 0.38046 0.39290 0.451 0.72590 0.42207 0.8292 0.8815 0.65472 0.5584
Net QRS Deflection (NQD) L2 L3 AVR AVL 0.398598 -0.25546 -0.5354 0.567818 0.9155 0.7445 -0.68522 0.134846 0.882308 0.547 -0.68593 0.216833 0.937385 0.545833 -0.69027 0.221727 0.675692 0.151286 -0.7732 0.4868 0.282833 -0.34071 -0.29127 0.4014 1.66623 1.1145 -1.1342 0.210001 1.705454 1.047833 -1.170154 0.238909 0.835545 0.291833 -0.7794 0.228455 1.254 0.806143 -0.906334 0.230167
AVF -0.09567 0.682308 0.709231 0.689615 0.4558 0.156636 1.371286 1.40409 0.511833 0.9052
θ1
θ2
θ3
θ
-360 -300 -300 -300 -330 -360 -300 -300 -300 -300
7.36712 8.37895 13.80716 13.30799 11.07073 20.36023 7.18330 7.97438 15.29203 10.40063
-90 -30 -30 -30 -240 -270 -30 -30 -30 -30
-7.3671 51.6210 46.1928 46.6920 41.0707 20.3602 52.8167 52.0256 44.7079 49.5993
Table 2. A portion of detected NQD and angle of QRS vector for MI Subjects Patient ID. s0015 s0016 s0017 s0054 s0050 s0059 s0060 s0039 s0037 s0043
lre lre lre lre lre lre lre lre lre lre
L1 -0.0411 0.0611 0.3046 0.50175 0.4056 0.556 0.556 0.2884 -0.2466 -0.1474
Net L2 0.3284 0.3284 -1.2153 -0.3998 -0.2722 -0.3438 -0.3438 -0.0905 0.61388 0.6128
QRS Deflection L3 AVR 0.3421 -0.314636 0.3421 -0.267 -1.1342 0.568545 -0.6950 0.556091 -0.408 -0.3715 -0.6003 0.500455 -0.6183 0.500455 -0.536 0.011667 0.77 -0.2406 0.6434 -0.306455
(NQD) AVL -0.1552 -0.1552 0.773 0.942833 0.304615 0.58 0.612 0.320364 -0.474833 -0.351834
AVF 0.275143 0.275143 -1.006727 -0.479889 -0.476143 -0.352091 -0.300364 -0.428273 0.668 0.614154
θ1 -240 -240 -120 -30 -90 -60 -60 -60 -240 -240
θ2 6.8628 10.1262 14.06988 22.97888 29.75553 29.8013 25.90875 1.246945 17.35228 12.90350
θ3 -180 -360 -360 -120 -120 -120 -90 -150 -330 -180
θ 126.8628 109.8737 -105.93 -52.9788 -119.755 -89.8013 -85.908 -61.2469 102.6477 132.9035
from the necrosis within the infarcted region. So, for the inferior wall, it is directed upwards and to the left i.e. towards lead AVL or positive pole of lead I [16]. Following these principles the rules are developed to detect the infarcted regions accordingto the MIN, MAX and θ. RULE 1: For Antero-lateral MI θ will be in RAD region [fig. 5]. RULE 2: For Inferior / Infero-lateral MI θ will be in LAD or EXT region [fig. 5].
4
Conclusion
A computerized approach for accurate computation of QRS vector of ECG signals is described in this paper. For this purpose the accurate detection of both baseline and NQD is necessary. Hence, modules for computation of those are been developed. Finally, depending on the rules of cardiac axis determination by searching the minimum and maximum NQD, an algorithm is developed for computation of the angle, amplitude and direction of the frontal plane QRS vector for both normal and diseased subjects to find out the clinical significance of this vector in cardiac disease identification. Still we use two types of data set (normal and MI) and achieved interesting result and also expect that the resultant cardiac vector of frontal and horizontal plane axis will play significant role in disease identification.
446
S. Mitra, M. Mitra, and B.B. Chaudhuri
Acknowledgments. The part of the work is funded by Department of Biotechnology (DBT),Govt. of India.
References 1. Hildebrand, F.B.: Introduction To Numerical Analysis, TMH edn., pp. 82–84. Tata Mcgraw-Hill Publishing Company Ltd 2. Maglaveras, N., Stamkopoulos, T., Diamantaras, K., Pappas, C., Strintzis, M.: ECG pattern recognition and classification using non-linear transformations and neural networks: a review. International Journal of Medical Informatics 82, 191–208 (1998) 3. Kawahito, S., Kitahata, H., Tanaka, K., Nozaki, J., Oshita, S.: Dynamic QRScomplex and ST-segment monitoring by continuous vectorcardiography during carotid endarterectomy. British Journal of Anaesthesia 90(2), 142–147 (2003) 4. Aidu, E.A.I., Trunov, V.G., Titomir, L.I., Szathmary, V., Tyˇsler, M.: Noninvasive Location of Acute Ischemic Lesion in the Heart Ventricles Using a Few-lead System: Study on a Realistic Mathematical Model. Measurement Science Rreview 3(2), 33– 36 (2003) 5. Friensen, G.M., Jannett, T.C., Jadallah, M.A., Yates, S.L,, Quint, S.R, Nagle, H.T: A comparison of the noise sensitivity of nine QRS detection algorithms. IEEE Trans. Biomed. Eng. BME-37, 85–89 (1990) 6. Pahlm, O., Sommo, L.: Software QRS detection in ambulatory monitoring – A review. Med. Biomed. Eng. Comput., 22, 289–297 (1984) 7. Coast, D.A., Stem, R.M., Cano, G.G., Briller, S.A.: An approach to cardiac arrhythmia analysis using hidden Markov models. IEEE Trans. Biomed. Eng. BME37, 826–836 (1990) 8. Trahanias, P.E., Skordalakis, E.: Bottom-up approach to ECG pattern recognition problem. Med. Biomed. Eng. Comput. 27, 221–229 (1989) 9. Trahanias, P.E., Skordalakis, E.: Syntactic pattern recognition of the ECG. IEEE Trans. Pattern Anal. Mach. Intell. PAMI-12, 648–657 (1990) 10. Trahanias, P.E.: An approach to QRS complex detection using mathematical morphology. IEEE Trans. Biomed. Eng. BME-40, 201–205 (1993) 11. Dinh, H.A., Kumar, D.K., Pah, N.D., Burton, P.: Wavelets for QRS detection. Australas Phys. Eng. Sci. Med. 24, 207–211 (2001) 12. Kadamb, S., Murray, R., Boudreaux-Bartels, G.F.: Wavelet transform-based QRS complex detector. IEEE Trans Biomed Eng. 46, 838–848 (1999) 13. Yu, X., Xu, X.: QRS detection based on neural-network. Journal of Biomed. Eng. 17, 59–62 (2000) 14. Chung, E.K.: Pocket Guide to ECG Diagonosis, pp. 17–21. Oxford University Press, Mumbai (1997) 15. Mitra, S., Mitra, M.: Detection of QRS Complex of ECG Signals from SquareDerivative Curve. AMSE journal (Advances in Modeling), France, modeling C 65(2), 15–28 (2004) 16. Schamroth, L.: An Introduction to Electrocardiography, 7th edn., pp. 142–155. Blackwell Science