adopts a combination of macro- and micro-models which allow for a system level ... T. R. Arabi and T. A. Schreyer are with the Intel Corporation. Publisher Item ...
64
IEEE TRANSACTIONS ON COMPONENTS, PACKAGING, AND MANUFACTURING TECHNOLOGY—PART A, VOL. 20, NO. 1, MARCH 1997
Computation of Switching Noise in Printed Circuit Boards Jong-Gwan Yook, Student Member, IEEE, V. Chandramouli, Student Member, IEEE, Linda P. B. Katehi, Fellow, IEEE, Karem A. Sakallah, Senior Member, IEEE, Tawfik R. Arabi, and Tim A. Schreyer Abstract—Simultaneous switching noise (SSN) is a phenomenon with adverse and severe effects when a large number of high speed chip drivers switch simultaneously causing a large amount of current to be injected into the power distribution grid. The effects of SSN are manifested in a variety of transient and permanent system malfunctions including the appearance of undesirable glitches on what should otherwise be quiet signal lines and the flipping of state bits in registers and memories. Current approaches for dealing with SSN are largely ad hoc, relying primarily on the ability of expert designers to postulate worst-case scenarios for the occurrence of SSN-related errors and to analyze these scenarios using pessimistic estimates of packaging parasitics. This paper takes a first step toward evolving a systematic methodology for modeling and analysis of SSN in printed circuit boards (PCB’s). The presented methodology adopts a combination of macro- and micro-models which allow for a system level treatment of the problem without losing the necessary detailed descriptions of the power/ground planes, the signal traces and the vertical interconnections through vias or plated holes. This approach has been applied to a variety of PCB structures and has allowed for an effective characterization of switching noise and a comprehensive understanding of its effects on PCB performance. Index Terms—Circuit simulation, decoupling capacitors, electromagnetic modeling, ground bounce, printed circuit board, tiling, simultaneous switching noise.
I. INTRODUCTION
I
NDUCTIVELY induced voltage fluctuations in the power and ground lines of digital systems are a source of performance degradation and may pose serious reliability problems. Variously termed simultaneous switching noise (SSN), inductive noise, delta-I noise, and ground bounce, this phenomenon is most severe when a large number of high frequency chip drivers switch simultaneously, and cause a large amount of current to be injected into the power distribution network. The adverse effects of SSN are manifested in a variety of transient and permanent system malfunctions, including the appearance of undesirable glitches on what should otherwise be quiet signal lines and the flipping of state bits in registers and memories. Because of their unpredictability, SSN-related bugs have been reported to be among the most difficult to track down and correct [1]. Manuscript received April 1, 1996; revised November 21, 1996. This work was funded in part by a Grant from the Intel Corporation. J.-G. Yook, V. Chandramouli, L. P. B. Katehi, and K. A. Sakallah are with the Department of Electrical Engineering and Computer Science, The University of Michigan, Ann Arbor, MI 48109-2122 USA. T. R. Arabi and T. A. Schreyer are with the Intel Corporation. Publisher Item Identifier S 1070-9886(97)01830-1.
While the fundamental mechanism underlying SSN, namely current switching, has been widely recognized for many years [2]–[6], the computer-aided design tool kits available to a digital system designer today still lack adequate SSN modeling, analysis, and design capabilities. This lack of modeling tools can be partially attributed to the complexity of the electromagnetic (EM) modeling required to obtain accurate estimates of the inductive parasitics responsible for SSN, coupled with the need for system-wide global analysis of this effect. Current approaches for dealing with SSN are largely ad hoc, relying primarily on the ability of expert designers to postulate worst-case scenarios for the occurrence of SSNrelated errors and to analyze these scenarios using pessimistic estimates of packaging parasitics. The goal of this study is to take a first step toward evolving a systematic methodology for modeling and analysis of SSN in printed circuit boards (PCB’s). In this methodology, the seemingly contradictory goals of modeling accuracy and global analysis efficiency are reconciled through a divideand-conquer process, namely micro- and macro-modeling. Accuracy is insured by performing detailed EM field analysis on appropriately chosen small sections of the PCB, referred to as “tiles,” to create lumped electrical equivalent circuit models. PCB tile models are subsequently combined with models for chip current drivers and package leads to produce an electrical simulation model for the PCB power distribution subsystem. A circuit simulator such as simulation program with integrated circuit emphasis (SPICE) [7] is then used to exercise this model under a variety of current excitation conditions to yield noise maps that indicate the variation in power and ground potential as a function of location on the PCB. It is instructive to note that this approach is similar, at least in spirit, to the approach routinely employed in modeling and simulation of very large scale integrated (VLSI) chips. Accurate circuit simulation of VLSI chips containing tens of thousands of transistors is made possible by separating the detailed physical models of three-dimensional (3-D) transistor structures from the global chip-wide electrical analysis. Device modeling involves creating lumped electrical equivalent circuits that are obtained by solving the partial differential semiconductor equations governing the movement of charge carriers within the semiconducting material. These equivalent circuits, appropriately parameterized by material, geometrical and environmental factors, are then combined to produce a complete electrical model for a chip that is amenable to analysis by fast circuit simulators.
1070–9886/97$10.00 1997 IEEE
YOOK et al.: COMPUTATION OF SWITCHING NOISE
Fig. 1. Traditional way of modeling the inductances of the PCB’s and package bonding wires.
The rest of this paper is organized in four sections. Section II reviews current approaches to the modeling and analysis of SSN and motivates our approach to the problem. The tiling procedure central to our method is described in Section III along with the equivalent circuits for three different tile types. In Section IV, several simulation results including validation data are presented for a number of different PCB configurations that are aimed at enhancing the understanding of the SSN phenomena. The contributions of this work and directions for future work are summarized in Section V. II. PROBLEM STATEMENT AND PREVIOUS WORK A simplified model of the current path through a PCBmounted integrated circuit (IC) chip is shown in Fig. 1 [2]–[4], [8]. Current enters the PCB through a metal connector from an external power supply (denoted as ) and flows through the conducting material of the board’s power plane, the chip’s package leads, and bonding wires to a pad (point A) connected to the chip’s internal power distribution network. Current then flows through one or more output pad drivers C and returns through a pad (point B), bonding wires and package leads, to the board’s ground plane and ground connector to the external power supply. In this simplified model, lumped inductances are used to represent the PCB power and ground planes (labeled ) and the package leads ( ). It is also assumed that the internal chip power distribution network is mostly resistive and does not significantly contribute to the overall inductance responsible for SSN. Techniques for efficient design of chip power distribution are discussed in [9]. When a pad driver C changes state to charge or discharge its load capacitance, the resulting current surge through the power distribution network produces inductive voltage drops and in turn lowers the potential at point A below and raises Such glitching, or noise, the potential at point B above in what should otherwise be quiescent power and ground rails leads to harmful effects on the chip circuitry, such as increased
65
driver delay and loss of signal integrity [2], [3]. The increase in driver delay is directly attributable to the temporary lowering (raising) of potential at point A (point B) causing a reduction in the current drive available for charging (discharging) the load capacitance to The second effect is more insidious, as it may lead to logic errors. Since the power and ground lines establish the reference levels for all other signals, fluctuations in these levels may be misinterpreted as logic transitions in data and clock lines. If these transitions are inadvertently latched, the circuit may end up in an incorrect logic state. For example, a dip in potential at point A may be seen as a spurious glitch at the output of the quiet driver D that flips the state of latch E. These problems are compounded when a large number of output drivers switch simultaneously on a PCB with many chips. Much of the previous work on SSN can be characterized as seeking (1) the determination of an aggregate effective inductance that accounts for the power and ground leads, the board itself, and the mutual inductances between the chip packaging and the PCB, and (2) the development of design guidelines to reduce SSN effects. Some of the early work in this area was done in [3], where a detailed electrical model of the package is simulated using ASTAP [10] and a gross value of is determined using (1) where is the noise magnitude, is the number of simultaneously switching drivers and is the rate of change of driver current. In this approach, only a single chip is considered and the computed is used to represent the noise effects. In a similar manner, Rainal [5] gives detailed formulas for calculating the self and mutual inductances, assuming that the pin inductances are the principal sources of switching noise on a chip. Using detailed electrical models of the package and the noise tolerance level of a logic family, Katopis [4] applies statistical design rules to determine the maximum number of drivers that may switch simultaneously. Furthermore, EDN’s Advanced complementary metal-oxide-semiconductor (CMOS) logic ground bounce tests [11] conclude that centrally placed ground pins or surface mounted packages reduce the ground bounce effects. In all these treatments, the parasitic inductance of the PCB is ignored and the lead inductances of the package pins are considered to be the primary contributors to SSN. Recently, however, several attempts have been made to account for the effect of the PCB power and ground plane inductances. Specifically, the current distribution on the power and ground planes is computed by solving the field equations using source and sink points. In [12], the switching noise due to inductances in the board as well as the vias is computed using an appropriate SPICE model. The board is assumed to have four layers: signal, power, ground, and reference layer for the measurements. The model is created by appropriately discretizing the power and ground planes and finding the equivalent circuit for each mesh. More recent work [6] has shown that the induced noise voltage is, in fact, sub-linear in the number of switching
66
IEEE TRANSACTIONS ON COMPONENTS, PACKAGING, AND MANUFACTURING TECHNOLOGY—PART A, VOL. 20, NO. 1, MARCH 1997
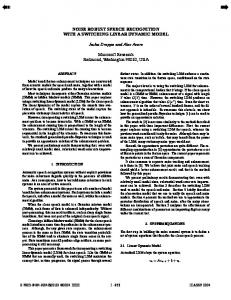
Fig. 2. Modeling of simultaneous switching noise (SSN) and simulation methodology.
drivers. This phenomenon is due to the fact that the ground bounce acts as a form of negative feedback, reducing the drive is calculated by of the CMOS transistors. In this work placing centralized point sources and distributed sinks on the power planes. The static field equations are then solved for the is computed in a modified form of power planes, and the (1) to take into account the negative feedback effect. The level 1 SPICE model of the CMOS transistors used in deriving the noise equations limits the accuracy of the model when it is applied to sub-micron technologies. Moreover, the computed value of varies with location when many chips are placed on a PCB. A detailed EM analysis of the interconnect structure in a computer package is performed in [13], [14] using the finite difference time domain (FDTD) and transmission line matrix (TLM) methods. While accurate, these approaches become computationally infeasible for realistic systems where a PCB may contain several hundred IC’s with multiple layers of power, signal, and ground planes. An accurate SSN simulator must consider the inductances due to both the PCB and the pins themselves. The technique developed during the study presented in this paper uses a combination of both macroscopic and microscopic modeling
approaches, as illustrated in Fig. 2. The micro-modeling provides an accurate electrical representation of the board as an interconnection of -port networks. These networks are threedimensional (3-D) ladders of RLC elements and represent the electrical equivalents of subsections, tiles, of the board. The tile equivalent circuits are defined according to the expected electric field signatures inside the board, and high accuracy is achieved by taking into account the dynamic nature of the electromagnetic fields. Depending on the substructure, these models may be based on quasistatic or full-wave solutions. The resulting board equivalent circuit is augmented with models for chip current drivers and simulated using HSPICE [15]. The macroscopic model considers the SSN at the system level and accounts for its variations across the PCB due to the flow of current along the conducting paths on all planes. A noise map of the power and ground planes is obtained as a result of the macro-modeling and the regions where the effect of noise is maximum are identified for the possible insertion of bypass capacitors. While the hybrid approach developed in this study is similar to [12], it has the advantage of combining the accuracy of a full-wave field simulator with the large-scale capacity of
YOOK et al.: COMPUTATION OF SWITCHING NOISE
SPICE electrical simulation, and can be easily generalized to handle any number of power, ground and signal layers. Moreover, since the equivalent circuits resulting from the fullwave analysis consist of lumped and elements, we can potentially use the AWE-based simulators which are three to four times faster than SPICE [16], provided that the drivers are linearized appropriately. In the following sections, detailed descriptions of the micromodeling approach will be presented, while relatively short discussion is devoted to the macro-modeling in view of its well-founded feature. III. PCB TILES AND THEIR LUMPED EQUIVALENT CIRCUITS In this section, the hybrid modeling methodology is presented starting with the tiling procedure and concluding with a summary of the primitive equivalent circuits structures which are the main building blocks of the PCB geometry.
67
Throughout the present study it has been assumed that the connectors are attached to one side of the PCB to maintain constant potentials on power and ground planes. For PCB’s having multiple power/ground planes, as commonly encountered in high-speed digital circuits, the equivalent circuits for each tile can be stacked vertically to model the 3-D nature of the geometry. As a result, the tiling approach has no inherent limitations in terms of number of layers, except an increased computational burden. The information from all of these equivalent circuits are recorded in an HSPICE input file, and then circuit simulation is performed in time or frequency domain. From the time domain circuit simulation, the potential distributions on the power and ground planes are obtained, and from these potential distributions the switching noises can be estimated. The input impedance at the driving port can be also easily computed from the voltage and current information at a given electrical node. B. Equivalent Circuits
A. Tiling Procedure The board is partitioned into a set of tiles, primitive structures, using a systematic discretization, or so-called tiling, procedure. In this procedure, grid points (nodes) are introduced for all the physical details of the structure. These physical nodes correspond to crossings and bends of traces, via connections to planes, corners of the PCB’s, connections to connectors and drivers, apertures on the planes, connections to loads, decoupling capacitors, etc. These nodes exist on all planes of the PCB and may vary in number from plane to plane. The intent of the tiling approach is to construct a 3-D grid that preserves all the geometrical details of the PCB. The resulting tiles are rectangular and nonuniform, and their grid points provide the electrical nodes for the 3-D SPICE model which is generated at the end of the tiling process. It is important to notice that the interactions between the neighboring tiles are fully accounted for by electrically connecting them together. Any spurious coupling between them, which is a second order effect, however, is not considered here, unless the tile equivalent circuit reflects it. As a result, to minimize the error due to the tiling approach, all the closely coupled geometries have to be modeled together to yield an appropriate tile and this can be accomplished by applying the finite element method (FEM) whenever necessary. A simple example of the tiling procedure is shown in Fig. 3. During the tiling procedure three different types of tiles can be defined according to their shape: interior, edge, and corner tiles. The interior tile has a cross-shaped lumped equivalent circuit having four branches (or ports), and this tile can be also used to represent the edge and corner tiles by appropriately terminating one or two branches. On the other hand, tiles can be classified into three different primitive structures according to their functionality, as illustrated in Fig. 3: power/ground plane tiles, power/signal/ground tiles and power/ground pin tiles. The equivalent circuits for these primitives are derived by using appropriate electromagnetic simulation tools, as will be discussed below. In addition, the equivalent circuit representations for the input current and voltage sources as well as connectors are considered.
As mentioned above, variety of modeling approaches are followed in order to identify the equivalent circuits for the primitives defined during the tiling procedure and descriptions of these approaches are given below. 1) Power/Ground Plane Tiles A power/ground plane primitive is considered as a section of a parallel plate waveguide. From microwave circuit theory, the equivalent circuit for such a structure can be represented as a 4-port network as shown in Fig. 3. Under the assumption that the parallel plate waveguide supports only a TEM wave, while evanescent higher order modes are weakly excited or can be practically considered nonexistent, the equivalent circuits can be easily computed using the ideal transmission line theory. The above underlying assumptions are, in general, valid for clock frequencies up to GHz range. Furthermore, to take into account the floating potentials on the power and ground planes, a special form of an equivalent circuit is devised as shown in the figure. Since an arbitrary surface current can be decomposed into two orthogonal components, the parallel plate waveguide is decomposed into two orthogonal 2-port transmission lines corresponding to each direction of the current, and as a result 4-port cross shaped equivalent network is obtained. For the 4-port network, the appropriate equivalent inductances and for two orthogonal directions and capacitances are derived from the 2-port ideal transmission line as (2) (3)
(4) and and and where are the number of tiles in and direction, respectively, are the and dimensions of the th tile as shown in Fig. 3.
68
IEEE TRANSACTIONS ON COMPONENTS, PACKAGING, AND MANUFACTURING TECHNOLOGY—PART A, VOL. 20, NO. 1, MARCH 1997
Fig. 3. Equivalent circuits for three different tiles, namely power/ground tile, power/ground pin tile, and power/signal/ground tile.
As can be recognized from the above expressions, the inductance and capacitance become frequency independent as both the size of each tile and the distance between the power and ground planes become relatively small compared to the smallest wavelength of interest in the propagation signals. As frequency increases, however, the inductance and capacitance values may vary accordingly, thus giving rise to high-frequency effects. For the examples presented in this study, we assumed that the inductances and capacitances in all equivalent circuits are independent of frequency. 2) Power/Signal/Ground Tiles The signal line located between two conducting planes is modeled as a stripline as illustrated in Fig. 3. Similar to the power/ground plane tile, the equivalent circuit for a signal line is developed to take into account the effect of the signal line on the potential fluctuations at the power and ground planes by using the series inductances and shunt capacitances as shown in the figure. Derivation of the equivalent circuit is completed in two steps. First, the characteristic impedance of the stripline is evaluated from the empirical formula [17] which includes the effect of the fringing fields. Second, an equivalent T-network is constructed and width as shown for a stripline of length in the bottom of the figure, and the values of capacitance and inductance in the equivalent circuit are determined after taking a similar procedure as in the previous subsection. The values of the inductances and capacitances for this primitive can be calculated as follows: (9)
Furthermore, and are the thickness and relative dielectric constant of the dielectric material separating the conducting is the propagation constant at the layers of the PCB and frequency of equivalent circuit extraction. In addition to the inductive and capacitive elements, resistive elements are also added to take into account the effect of the ohmic losses and to prevent pure inductive loops in the equivalent circuits. The value of the resistive element can be calculated as (5) where is the conductivity of the material. Under the assumption that the electrical dimensions of the tile are much smaller than the wavelength at the operating and the above frequency, that is, equations can be reduced to a more compact form using the small argument approximation of the trigonometric functions (6) (7) (8) where
is the speed of light in free space.
(10) where (11)
if if (12) After the equivalent circuit components are determined, those elements are inserted into the equivalent circuit network of the is connected to power/ground planes: that is, and to as shown in Fig 3. By doing this, the interaction between the signal line and the power/ground plane can be fully incorporated into the equivalent circuit for this tile. and capacitance In general, the equivalent inductance are functions of frequency. However, if the length of the power/signal/ground tile is much smaller than that of the wavelength corresponding to the clock frequency, that is the values of the circuit components become
YOOK et al.: COMPUTATION OF SWITCHING NOISE
69
Fig. 4. PCB and driver configurations used in this paper. The pin “P” and “G” are connected to the power and ground plane, respectively.
frequency independent. Consequently, the above equations are simplified to the following: (13) (14) is the characteristic impedance of the signal line. where 3) Power/Ground Pin Tiles To model the power and ground pins connected to a current source or driver, as shown in Fig. 3, a simple equivalent circuit is employed. The power pin, directly connected to the power plane, is modeled as a vertical inductance element, while the ground pin, which is connected to the ground plane through a via hole on the power plane, is replaced by two inductances, one for the line above the power plane and one for the line below. Furthermore, to increase the accuracy of the model, one capacitor is added between the ground pin and the power plane, as shown in the figure. This capacitor represents the parasitic capacitive effect between the pin and the opening in the power plane. The appropriate inductance and capacitance values are computed for a given geometry from an electromagnetic field simulator, the FEM [18], [19]. The FEM is based on tetrahedral edge basis functions and provides a highly accurate model of the fields including their dynamic effects. The values of the inductance and capacitance in the equivalent circuit are extracted by matching the -parameters derived from the FEM to those of the equivalent circuit representing the power/ground pin tiles. A similar of equivalent circuit could be derived from a simplified analysis as presented in [20]. It has been found that the inductance of the pin is a function of the length and diameter of each pin, and in many practical cases, the inductance can be considered as frequency independent. The amount of the capacitive effect between the pin and the via hole in the power plane is mainly determined by both the diameters of the pin and surrounding hole. Note that as the diameter of the vertical via or pin increases, the inductance of the structure decreases due to the increased width of the current path.
IV. SIMULATION RESULTS The modeling and simulation methodology described above has been used to analyze SSN for a number of configurations of PCB whose physical characteristics are shown in Fig. 4. These configurations differ in the locations of the connectors, the number and placement of the current sources and sinks, the amount of current injected by each driver, and the size and location of decoupling capacitors. The effect of a signal trace has been also modeled as a stripline in one of the experiments. Using the procedure outlined in Fig. 2, PCB configurations are tiled and simulated in the time domain using HSPICE. Transient simulation results, in the form of voltage waveforms at the power and ground grid points, have been subsequently converted to produce 3-D noise maps. In these maps, the maximum drop in voltage at each grid point on the power plane and the maximum increase in voltage at each grid point on the ground plane have been plotted, unless otherwise specified. In general, depending on physical importance several different types of noise maps can be generated, such as average, RMS, peak-to-peak, maximum, or minimum values on the power and ground planes. A. Validation For validation, a single transmission line (signal trace) terminated with vertical via hole is simulated using both the proposed hybrid approach and full-wave FEM. To discretize the microstrip type structure, the power/ground plane tiles are employed for the conducting surfaces, however, the nonconducting surface on top of the substrate is modeled by removing the electrical nodes in the tile equivalent circuit. The schematic of the geometry is illustrated in Fig. 5(a) and along the center line of the signal trace on the ground plane, the potential distributions are computed and compared as shown in Fig. 5(b). Overall, the shape and peak values of the potential distributions reveal very good agreement. The peaks in the potential distributions correspond to the location of the front face of the vertical via hole, not the center, since the electric field is zero inside a conducting via hole. Note that there is a slight variation in the small values of the FEM-computed potential due to the numerical error introduced during the
70
IEEE TRANSACTIONS ON COMPONENTS, PACKAGING, AND MANUFACTURING TECHNOLOGY—PART A, VOL. 20, NO. 1, MARCH 1997
(a)
plane and the point “g” denotes the connection to the ground plane through a via hole. The current waveform, shown in Fig. 6(a), is a triangular pulse with rise and fall time of 500 psec and a peak value of 10 mA. This wave shape is chosen to model the actual current flowing through the - and -type transistors of a switching CMOS inverter. The noise maps for the various tiling cases are shown in Fig. 6(b) and (c) for the power and ground plane, respectively. These maps indicate a maximum voltage drop of 2.73 mV on the power plane (corresponding to point “p”) and a maximum voltage increase of 3.69 mV on the ground plane (corresponding to “g”) regardless of the number of tiles. As can be seen from the maps, the essential features of the noise maps remain the same, with maps corresponding to finer grids showing better resolution of the noise magnitude. Fig. 7 illustrates the CPU and memory usage as a function of the number of tiles for this configuration. The CPU and memory requirement for the circuit simulation increases rapidly as the number of tiles increases. As a result, 625 tiles for the partitioning of the PCB is chosen as a reasonable compromise between the accuracy and simulation time for all other experiments described hereafter in this section. The position of the connectors are then varied keeping the coordinates of the current injection points on the PCB identical as shown in Fig. 6. The connectors are alternately placed on the left, top, right, and bottom edges of the PCB as illustrated in Fig. 8. It has been observed that the potential fluctuations on the power and ground planes have their maximum values when the connectors are placed on the top and right edges. This is readily explained by noting that the current injection points for these two configurations are farther away from the dc power supply than in the other two configurations, making them more susceptible to noise.
(b) Fig. 5. (a) Signal trace terminated with vertical via hole and (b) potential distribution on the ground plane computed from both the HSPICE (hybrid approach) and full FEM simulation. The geometrical dimensions are given: W0 2 :0
= 2:3 mm; W1 = 1:15 mm; W2 = 2:875 mm; H1 = 1:0 mm; H2 = mm; �1 = 3:4; �2 = 1:0:
calculation of the ground potential from the FEM-computed fields. The potential distribution on the ground plane has a particularly important meaning, since 1) it reveals the nonideal behavior of the ground planes in PCB’s and 2) directly shows the presence of SSN or ground bounce. In this hybrid approach, the ground plane is not assumed to bear perfectly zero potential, but it is allowed to float through the use of appropriate equivalent circuits. B. Convergence Test: Tiling Optimization The first task is to determine how changing the number of tiles used to model the power and ground planes affects the noise maps, and the experimental setup is shown in Fig. 6(a). The connector is placed on the left hand side and a current source is connected between the power and the ground planes as shown. The point “p” denotes the connection to the power
C. Seven Drivers with Decoupling Capacitors In order to obtain more realistic values of the noise voltages, the PCB with actual transistor drivers replacing the ideal piecewise linear current source has been simulated. Seven large CMOS inverters were connected to different points on the power and ground planes. Transistor sizes and capacitive load have been chosen to represent realistic VLSI chip pad drivers: 1400 m/1.2 m for -channel MOSFET’s, 800 m/1.2 m for -channel MOSFET’s, and 25 pF load capacitance. Each driver is excited by a 1.7 nsec wide voltage pulse with 0.8 nsec rise/fall time. The resulting noise maps are shown in Fig. 9(a) and indicate that the maximum noise levels on the power and ground planes are 439.26 mV and 560.93 mV, respectively. In order to quantify the effect of the decoupling capacitors, 100 nF ideal capacitances (i.e. with no lead inductance) are connected across the power and ground leads of the seven drivers as illustrated in Fig. 10. The corresponding noise maps are shown in Fig. 9(b) and indicate a reduction in the switching noise to 149.4 mV and 98.43 mV on the power and ground planes, respectively. It is observed that the decoupling capacitor connected between the power and ground leads of the driver allows the most effective noise reductions on the power and ground planes.
YOOK et al.: COMPUTATION OF SWITCHING NOISE
71
(a)
(b)
(c) Fig. 6. (a) Board layout and current waveform for convergence experiments. Noise maps on the (b) power plane and (c) ground plane for three different number of tiles (225, 625, and 1024, respectively).
Fig. 7. CPU and memory usage versus the number of tiles.
72
IEEE TRANSACTIONS ON COMPONENTS, PACKAGING, AND MANUFACTURING TECHNOLOGY—PART A, VOL. 20, NO. 1, MARCH 1997
Fig. 8. Variation in the position of the connector.
Fig. 10. Configuration of the decoupling capacitance. (a)
(b) Fig. 9. Noise maps (minimum on power and maximum on ground plane) (a) without and (b) with decoupling capacitors. Note that the scale of the vertical axis is not identical for both cases.
Variations in noise levels as a function of the magnitude of decoupling capacitance are shown in Fig. 11. In general, larger values of decoupling capacitance contribute to reduced noise level. Switching noise, however, cannot be reduced to zero regardless of the amount of decoupling capacitance used. Instead, the noise tends to saturate to a specific level beyond a certain critical value of the decoupling capacitance (the “knee” of the curves). While the critical value has been turned out to be roughly 1.0 nF with the given configuration, it is possible to have different values for different configurations.
0.8 nsec rise/fall time and 1.7 nsec pulse width, and its peak value is 5 V. The PCB configuration used in this experiment and the equivalent circuit of the stripline with current source are shown in Fig. 12. The resulting noise maps, minimum potential on the power and maximum on the ground planes, are shown in Fig. 13 for the two cases: with and without stripline. As can be observed in the figure, the presence of the stripline or signal trace causes minor perturbations (i.e., reduced potential difference between the power and ground planes) to the potential distributions in the power and ground planes. When the stripline is present, the maximum noise levels in the power and ground planes become 93.5 mV and 141.0 mV, respectively. However, when the stripline is removed, the noise levels in the power and ground planes are slightly changed to 87.0 mV and 168.6 mV, respectively, due to the reduced overall inductance and current injection into the planes. Note that those peaks on the power and ground planes correspond to the locations of the driver pins connected to each plane. When the width of the signal line becomes narrower, the interactions between the signal line and the power/ground planes are expected to reduce due to the decreasing mutual capacitance. As a result, for very narrow signal traces, the effect of the traces can be considered as a secondary phenomenon. V. SUMMARY
D. Modeling of Signal Traces In this section, the effect of a signal trace on the switching noise is studied. For the experiment, one signal line having width 0.5 mm and length 42 mm is placed in the middle of the dielectric substrate ( ) and a current source is connected at the center of the line. The current driver and its excitation pulse waveform are identical to those used in the previous experiment. In addition, one end of the signal line is terminated with 50 lumped resistor, while the other end of the line is connected to a trapezoidal voltage source having
From the experiments performed in this paper, the following observations can be made. First, for a given amount of current injection, the SSN increases when the current drivers are placed farther away from the equipotential connectors that supply dc power to the board. Second, maximum reduction in the SSN occurs when decoupling capacitors are placed in the vicinity of the current injection points (i.e. between the power and ground driver pins). Third, increasing the value of the decoupling capacitance tends to reduce the magnitude of the SSN. Beyond a critical value, however, further increases
YOOK et al.: COMPUTATION OF SWITCHING NOISE
Fig. 11.
73
Noise variation on power and ground planes with various decoupling capacitances.
(a)
(b) Fig. 13. Noise maps on the power and ground planes (a) with signal trace and (b) without signal trace.
Fig. 12. Top and cross-sectional views (not to scale), and source/stripline configuration. The parenthesized numbers are coordinates in [mm] relative denotes connection to ideal ground, i.e., to lower left corner of the PCB. node 0 of HSPICE.
r
in capacitance value does not reduce the overall SSN. This critical value depends on the PCB configuration and the amount of current injected by the drivers. Fourth, the presence
of the signal traces marginally contribute to noise on both the power and ground planes. Limited evidence, however, suggests that this contribution is dwarfed by the current injection from the drivers. Additional experiments also suggested that significant lead inductances introduced by the decoupling capacitors may in some cases nullify the noise reduction benefits of these capacitors.
74
IEEE TRANSACTIONS ON COMPONENTS, PACKAGING, AND MANUFACTURING TECHNOLOGY—PART A, VOL. 20, NO. 1, MARCH 1997
VI. CONCLUSION This paper has presented a systematic methodology, combining the finite element full-wave electromagnetic tool and circuit simulator HSPICE, for the modeling and analysis of SSN in digital IC’s and packages. In this hybrid methodology, the seemingly contradictory goals of modeling accuracy and global analysis efficiency were carefully balanced. The accuracy was insured by performing detailed EM field analysis on appropriately chosen small sections of the PCB, referred to as tiles, to create lumped electrical equivalent circuit models. The PCB tile models were subsequently combined with both the models for chip current and/or voltage drivers and the package leads to produce an electrical simulation model for the PCB power distribution subsystem. A circuit simulator was then used to exercise this model under a variety of current or voltage excitation conditions to yield noise maps that indicated the variation in the power and ground potential as a function of location on the PCB. Furthermore, the effect of the value and configuration of decoupling capacitances were studied and found that the noise levels on the power and ground planes were saturated to a certain value as the decoupling capacitance increases. Finally, the effect of the signal traces between the power and ground planes was examined and revealed minor influence on the potential distributions in both planes. REFERENCES [1] R. P. Colwell, “Latent design faults in the development of multiflow’s trace/200,” in Proc. 22nd Fault Tolerant Computing Symp., July 1992, pp. 468–474. [2] H. B. Bakoglu, Circuits, Interconnections and Packaging for VLSI, VLSI Systems Series. New York: Addison-Wesley, 1990. [3] E. E. Davidson, “Electrical design of a high-speed computer packaging system,” IEEE Trans. Comp., Packag., Manufact. Technol., vol. 6, pp. 272–282, 1983. [4] G. A. Katopis, “Deltai noise specification for a high-performance computing machine,” Proc. IEEE, pp. 1405–1415, 1985. [5] A. J. Rainal, “Computing inductive noise of chip packages,” AT&T Bell Lab. Tech. J., pp. 177–195, Jan. 1984. [6] R. Senthinathan and J. L. Prince, Simultaneous Switching Noise of CMOS Devices and Systems. Boston, MA: Kluwer, 1994. [7] L. W. Nagal, “SPICE2: A computer program to simulate semiconductor circuits,” erl-m520, Univ. California, Berkeley, CA, May, 1975. [8] C. Dike, “Equivalent circuits model subtle traits of advanced CMOS IC’s,” Electron. Design News, pp. 189–198, Apr. 1988. [9] W. S. Song and L. A. Glasser, “Power distribution techniques for VLSI circuits,” IEEE J. Solid-State Circuits, pp. 150–156, 1986. [10] W. T. Weeks, “Algorithms for ASTAP-A network analysis program,” IEEE Trans. Circuit Theory, vol. CT-20, pp. 628–634, 1973. [11] D. Shear, “EDN’s advanced CMOS logic ground-bounce tests,” Electron. Design News, vol. CT-20, pp. 88–114, Mar. 1989. Correction: vol. 34, pp. 35, Sept. 1989. [12] O. Pedersen, B.-E. Flaten, and T. Gleditsch, “Modeling of power and ground planes,” Circuit World, vol. 13, pp. 30–33, Mar. 1992. [13] W. D. Becker, P. H. Harms, and R. Mittra, “Time-domain electromagnetic analysis of interconnects in a computer chip package,” IEEE Trans. Microwave Theory Tech., vol. MTT-40, pp. 2155–2163, Dec. 1992. [14] S. Maeda, T. Kashiwa, and I. Fukai, “Full wave analysis of propagation characteristics of a through hole using the finite-difference time-domain method,” IEEE Trans. Microwave Theory Tech., vol. MTT-39, pp. 2154–2159, Dec. 1991. [15] Meta-Software, HSPICE User’s Manual, 1992. [16] L. T. Pillage, “Asymptotic waveform evaluation for timing analysis,” Ph.D. dissertation, Carnegie Mellon University, Pittsburgh, PA, 1989. [17] H. H. Howe, Stripline Circuit Design. Dedham, MA: Artech House, 1974. [18] J.-G. Yook, N. Dib, and L. Katehi, “Characerization of high frequency interconnects using finite difference time domain and finite element
methods,” IEEE Trans. Microwave Theory Tech., vol. MTT-42, pp. 1727–1736, Sept. 1994. [19] J.-G. Yook and L. Katehi, “Capacitance and inductance evaluation of vertical interconnets using the finite element method,” in Int. URSI Symp. Dig., June, 1993, p. 33. [20] Q. Gu, Y. Yang, and M. A. Tassoudji, “Modeling and analysis of vias in multilayered integrated circuits,” IEEE Trans. Microwave Theory Tech., vol. MTT-41, pp. 206–214, Feb. 1993.
Jong-Gwan Yook (S’86) was born in Korea, in 1964. He received the B.S. and M.S. degrees in electronic engineering from Yonsei University, Seoul, Korea, in 1987 and 1989, respectively. He is currently pursuing the Ph.D. degree in electrical engineering at the University of Michigan, Ann Arbor. He is a Graduate Student Research Assistant in the Radiation Laboratory, University of Michigan. His main research interests are in the area of electromagnetic characterization of VLSI and MMIC interconnects using the finite element method and development of numerical techniques for analysis and design of high frequency circuits with emphasis on parallel computing.
V. Chandramouli (S’94) received the B.E. degree (with honors) in computer science and technology from the University of Roorkee, Roorkee, India, in 1991 and the M.S. degree in computer science from the University of Utah, Salt Lake City, in 1993. Since September, 1993, he has been a doctoral student in Computer Science and Engineering at the University of Michigan, Ann Arbor. His current research interests are in the area of circuit simulation, developing efficient timing and power models for gates and interconnects, timing analysis, and the theory of music. Mr. Chandramouli was the recipient of the University Merit Scholarship at Roorkee from 1988–1991.
Linda P. B. Katehi (F’95) received the B.S.E.E. degree from the National Technical University of Athens, Greece, in 1977 and the M.S.E.E. and Ph.D. degrees from the University of California, Los Angeles, in 1981 and 1984, respectively. In September 1984, she joined the faculty of the EECS Department of the University of Michigan, Ann Arbor. Since then she has been interested in the development and characterization (theoretical and experimental) of microwave, millimeter printed circuits, the computer-aided design of VLSI interconnects, the development and characterization of micromachined circuits for millimeter-wave and submillimeter-wave applications, and the development of low-loss lines for Terahertz-frequency applications. She has also been studying theoretically and experimentally various types of uniplanar radiating structures for hybrid-monolithic and monolithic oscillator and mixer designs. She has graduated 14 Ph.D students and is presently supervising 17 Ph.D. graduate students. She has been the author and co-author of more than 260 papers published in referred journals and symposia proceedings. Dr. Katehi received the IEEE AP-S W. P. King (Best Paper Award for a Young Engineer) in 1984, the IEEE AP-S S. A. Schelkunoff Award (Best Paper Award) in 1985, the NSF Presidential Young Investigator Award and an URSI Young Scientist Fellowship in 1987, the Humboldt Research Award and The University of Michigan Faculty Recognition Award in 1994, the IEEE MTT-S Microwave Prize in 1996. She is a member of Sigma XI, Hybrid Microelectronics, URSI Commission D, and AP-S ADCOM from 1992 to 1995. She is an Associate Editor for the IEEE TRANSACTIONS ON ANTENNAS AND PROPAGATION and the IEEE TRANSACTIONS ON MICROWAVE THEORY AND TECHNIQUES.
YOOK et al.: COMPUTATION OF SWITCHING NOISE
Karem A. Sakallah (S’76–M’81–SM’92) received the B.E. degree (with distinction) in electrical engineering from the American University of Beirut, Beirut, Lebanon, in 1975, and the M.S.E.E. and Ph.D. degrees in electrical and computer engineering from Carnegie Mellon University (CMU), Pittsburgh, PA, in 1977 and 1981, respectively. In 1981, he joined the Department of Electrical Engineering at CMU as a Visiting Assistant Professor. From 1982 to 1988, he was with the Semiconductor Engineering Computer-Aided Design Group at Digital Equipment Corporation, Hudson, MA, where he headed the Analysis and Simulation Advanced Development team. Since September 1988, he has been at the University of Michigan, Ann Arbor, as Associate Professor of Electrical Engineering and Computer Science. From September 1994 to March 1995, he was on a six-month sabbatical leave at the Cadence Berkeley Laboratory in Berkeley, CA. He is currently an Associate Editor for the IEEE TRANSACTIONS ON COMPUTER-AIDED DESIGN OF INTEGRATED CIRCUITS AND SYSTEMS. His research interests are primarily in the area of computer-aided design, with particular emphasis on numerical analysis, multilevel simulation, timing verification and optimal clocking, modeling, knowledge abstraction, and design environments. Dr. Sakallah is a member of the ACM and Sigma Xi.
75
Tawfik R. Arabi was born in Beirut, Lebanon in 1964. He received the B.S. degree in electrical engineering from the American University of Beirut, Lebanon, and the Ph.D. degree in electrical engineering from Syracuse University, Syracuse, NY, in 1986 and 1991, respectively. In 1991, he joined the Intel Corporation where he has been working on innovative packaging and interconnect solutions to high speed digital circuits. His research interests are in the area of numerical electromagnetic modeling and circuit optimization of high speed transmission link circuits. Since 1993, he has been an Adjunct Professor teaching courses at both Oregon State University, Corvallis, and Portland State University, Portland, OR.
Tim A. Schreyer received the Ph.D. degree from Stanford University, Stanford, CA, in 1989. He is a Senior Staff Engineer at Intel Corporation, where he specializes in signal integrity and transmission line modeling of printed circuit board interconnections. His work at Intel includes developing new techniques for designing high speed interconnections, and teaching these techniques to other system designers.