Thailand Using Statistical Behaviors of Weather Data. Peerasak ... April 2010. The bimodal distribution and power law distribution were used to analyze ...
Computational Classification of Cloud Forests in Thailand Using Statistical Behaviors of Weather Data Peerasak Sangarun, Wittaya Pheera, Krisanadej Jaroensutasinee, and Mullica Jaroensutasinee Centre of Excellence for Ecoinformatics, School of Science, Walailak University, Nakhon Si Thammarat, 80160, Thailand {ppsangarun,wittayapheera,krisanadej,jmullica}@gmail.com
Abstract. This study attempted to distinguish the atmospheric characteristic of cloud forest quantitatively in order to classify their typical features. The nine weather stations were installed in different sites divided into three specific areas: (1) four cloud forest areas (Duan Hok, Dadfa, Mt. Nom and Doi Inthanon stations), (2) two lowland rainforest areas (Huilek and Mt. Nan Headquarters stations) and (3) three coastal areas (Walailak University, Khanom and Nakhon Si Thammarat stations). The atmospheric data consisted of temperature, the percentage of relative humidity and solar radiation collected from July 2006 to April 2010. The bimodal distribution and power law distribution were used to analyze parameters and classify atmospheric characteristics of the obtained data then classified them by cluster analysis. The results showed that those study sites can be classified into two groups: (1) cloud forest and (2) lowland rainforest and coastal area. Keywords: cloud forest, atmospheric data, weather station, bimodal distribution, power law distribution.
1 Introduction Tropical Montane Cloud Forests (TMCFs) occurs in mountainous altitudinal band frequently enveloped by orographic clouds [3]. This forest obtains more moisture from deposited fog water in addition to bulk precipitation [4] and [6]. The main climatic characteristics of cloud forests include frequent cloud presence, usually high relative humidity and low irradiance [4]. TMCFs normally found at altitudes between 1,500 to 3,300 m a.s.l., occupying an altitudinal belt of approximately 800 to 1,000 m. at each site [7]. The lowermost occurrence of low-statured cloud forest (300–600 m a.s.l.) is reported from specific locations like small islands, where the cloud base may be very low and the coastal slopes are exposed to both, high rainfall and persistent wind-driven clouds [1]. On small tropical islands, TMCFs can be found at lower altitudes. TMCFs obtain more moisture from deposited fog water in addition to precipitation [1], [8] and [9]. All tropical forests are under threat but cloud forests are S. Lin and X. Huang (Eds.): CSEE 2011, Part I, CCIS 214, pp. 244–250, 2011. © Springer-Verlag Berlin Heidelberg 2011
Computational Classification of Cloud Forests in Thailand
245
uniquely threatened both by human and by climate change impacting on temperature, rainfall and the formation of clouds in mountain areas [2]. Grace and Curran [5] used a bimodal distribution to model daily maximum temperature frequency distribution at southern Australian coastal sites. The model could assess impact of changes in the local atmospheric circulation patterns. This study attempted to quantify weather variables from automatic weather stations i.e. temperature, the percentage of relative humidity and solar radiation by using bimodal distribution and power law distribution, so that we can learn more about their seasonality. This study investigated the atmospheric data from nine study sites (Fig. 1a and 1b). This study was aimed to use weather data monitoring by automatic weather stations at cloud forests study sites and the other sites for studying and analyzing the atmospheric characteristics. Furthermore, we may use these data to predict the possibility of climate change and global warming of Thailand in the future.
2 Materials and Method Mt. Nan National Park is situated at Noppitam sub-district, Thasala district, and Sichon district in Nakhon Si Thammarat province, Thailand (Fig. 1a and 1b). Mt. Nan is a part of Nakhon Si Thammarat mountain range lie in North-South direction with an area of 406 km2. 90% of the area in Mt. Nan is a primary tropical evergreen forest which is an important watershed source of Nakhon Si Thammarat. There were nine study sites: three coastal sites (Khanom, Walailak University and Nakhon Si Thammarat), two tropical rainforest sites (Mt. Nan Headquarters and Huilek), and four cloud forest sites (Dadfa, Duan Hok, Mt. Nom and Doi Intanon) (Fig. 1a and 1b). Khanom (KHN), Walailak University (WLU) and Nakhon Si Thammarat (NST) sites were coastal area with the elevation of 8 m a.s.l. Mt. Nan Headquarters (NHQ) and Huilek (HUL) sites were tropical montane rain forests located within Mt. Nan National Park with the elevation of 182 and 234 m a.s.l., respectively. Dadfa (DFC) cloud forest site is a lower montane cloud forest located at Khanom district, Nakhon Si Thammarat province near coastal area with the elevation of 680 m a.s.l. Mt. Nom (MNC) cloud forest with the highest peak of 1,270 m a.s.l. and Duan Hok (DHC) cloud forest with the highest peak of 1,053 m a.s.l. are located at Mt. Nan National Park. Doi Intanon (DIC) cloud forest is located at Jomtong district, Maejam district, Maewang district and Doilo sub-district, Changmai Province. The geographical characteristic of Doi Intanon is a high mountainous range in North-South direction which is a part of Thanonthongchai mountain range with the elevation range of 400-2,565 m a.s.l. 2.1
Data Collection
We installed automatic weather station (Davis weather station model Vantage Pro II Plus) at nine study sites (Fig. 1a and 1b). There were different installation periods at each study site as followings: (1) KHN (September 2007), (2) WLU (August 2006), (3) NST (June 2006), (4) NHQ (September 2007), (5) HUL (November 2006), (6)
246
P. Sangarun et al.
DFC (January 2009), (7) DHC (March 2007), (8) MNC (January 2009) and (9) DIC (March 2008). We used the data logger for data storage interval time of 30 min. for all weather data.
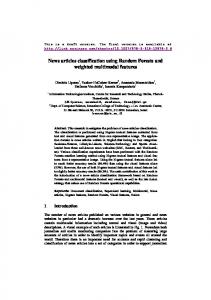
(a)
(b)
Fig. 1. (a) The map of Thailand and Doi Intanon (DIC) study site (9) and (b) Mt. Nan National Park. The numbers represent (1) KHN, (2) WLU, (3) NST, (4) NHQ, (5) HUL, (6) DFC, (7) DHC, and (8) MNC.
2.2
Data Analysis
In this study, the weather data (i.e. temperature, relative humidity and solar radiation) at nine study sites were used to fit the bimodal and power law distribution of relative frequency. For temperature data, we used a bimodal distribution to fit the histogram distribution curves in all sites, except at DIC where it had three normal distributions. For relative humidity data, we analysed data as followings: (1) the bimodal distribution was used to analyse KHN, WLU, NST and NHQ sites and (2) the power law distribution was used to fit the first subpopulation distribution and the normal distribution was then used to fit the second and third subpopulation distributions where it applied. For solar radiation data, solar radiation data during 0600-1800 hours were used for data analysis. The power law distribution was used to fit the first subpopulation distribution and the normal distribution was then used to fit the second and third subpopulation distributions at all sites. The bimodal distribution and power law distribution are given by equation (1) and (2), respectively.
(1)
Computational Classification of Cloud Forests in Thailand
247
3 Results
Relative Frequency
The temperature at all sites was bi-modally distributed, except at DIC site (Fig. 2a-2i) which showed multimodal distribution according to three subpopulations. Cloud forest sites had lower and than other sites (Fig. 2a-2i). The relative humidity at KHN, WLU, NST and NHQ sites were fitted by the bimodal distribution (Fig. 3a-3d). HUL, DFC, DHC and MNC sites were fitted by power law distribution and normal distribution (Fig. 3e-3h). DIC site was different from others sites that was fitted by power law and bimodal distribution (Fig. 3i).
(a)
(b)
(c)
(d)
(f)
(g)
(h)
(i)
(e)
Fig. 2. Temperature distribution with bimodal curve at nine study sites. (a-c) coastal sites, (d-e) lowland rainforests and (f-i) cloud forests
Solar radiation at KHN, WLU, NST, NHQ and MNC sites were fitted by power law and bimodal distribution (Fig. 4a-4d and 4h). HUL, DHC and DIC sites were fitted by power law and normal distribution (Fig. 4e, 4g and 4i). DFC site was fitted by power law distribution (Fig. 4a-4i).
Relative Frequency
248
P. Sangarun et al.
(a)
(b)
(c)
(d)
(f)
(g)
(h)
(i)
(e)
Relative Frequency
Fig. 3. The percentage of relative humidity distribution with bimodal curve at nine study sites. (a-c) coastal sites, (d-e) lowland rainforests and (f-i) cloud forests
(a)
(b)
(c)
(d)
(f)
(g)
(h)
(i)
(e)
Fig. 4. Solar radiation distribution with bimodal curve at nine study sites. (a-c) coastal sites, (d-e) tropical forests and (f-i) cloud forests
The results from cluster analysis of temperature, relative humidity and solar radiation identified clarification of two different groups of forests: (1) DFC, DHC, DIC, HUL and MNC study sites. (2) NHQ, NST, KHN and WLU sites (Fig. 5).
Computational Classification of Cloud Forests in Thailand
249
Fig. 5. Cluster analysis of temperature, relative humidity and solar radiation data
4
Discussion
The bimodal model of temperature distribution composed of two subpopulations which were the mean temperature in rainy and summer season. DIC site had three subpopulations. The coolest subpopulation was the mean temperature in winter. The solar radiation was also grouped in the study sites into two differences: (1) DFC, DHC, DIC and HUL study sites. (2) MNC, NHQ, NST, KHN and WLU sites (Fig. 5). This study showed that MNC, DHF and DFC lower and than other sites. This indicated the peak of first subpopulation can be used as an indicator of cloud forest that is located near the equator. On the other hand, this could not be applied to high latitude cloud forest like DIC because in winter (November to February) the temperature was lower than the other month. The first peak of temperature was 6.97 ˚C and the second peak was 11.75 ˚C that was the mean temperature in rainy season and the third peak was showed the mean temperature in summer was 14.95 ˚C. It was found that DFC had slightly higher temperature than DHC and MNC that = 21.12, 19.22, 17.80 ˚C respectively. This could be due to the fact that DFC was located near coastal area at low elevation (i.e. 700 m a.s.l). These results support the Bruijnzeel’s study that can be found in TMCFs at lower altitudes. [1], [8] and [9]. The atmospheric characteristics of nine study sites could be classified by cluster analysis into two groups of forests within cloud forest sites; MNC, DFC, DHC and DIC and coastal sites; NHQ, NST, KHN and WLU. HUL site was different from the other sites. This may be the result from the influence of specific location, HUL was located at the valley that had frequent cloud presence and the water stream. The canopies of the tall trees in this site are covered with fog in the morning. MNC study site was located at the top of the hill that is exposed to the solar radiation and didn’t have the canopy cover. The bimodal distribution of solar radiation showed the mean of the first and second subpopulations and . NHQ, NST, KHN and WLU had higher than the other sites.
5
Conclusion
Bimodal distribution of temperature can be used to separate forest types. From nine study sites, the mean and variance of the bimodal distribution can group them into two types: (1) four cloud forest sites (DHC, DFC, MNC, and DIC stations), (2) two
250
P. Sangarun et al.
lowland rainforests (HUL and NHQ stations) and three coastal sites (WLU, KHN and NST stations). In this study, the relative humidity distribution of coastal sites that were WLU, KHN and NST sites was fitted by power law and bimodal distribution of 4 study sites and by using power law and normal distribution of 5 study sites. The data of temperature, relative humidity, and solar radiation could be used to analyze the weather variation and distribution. Further, these data could be generalized for better understanding of the fluctuation of weather which tends to change according to the global warming climate situation. Acknowledgments. This work was supported in part by PTT Public Company Limited, TRF/Biotec special program for Biodiversity Research Training grant BRT R351151, BRT T351004, BRT T351005, Walailak University Fund 05/2552 and 07/2552, WU50602, and Center of Excellence for Ecoinformatics, the Institute of Research and Development, Walailak University and NECTEC. We thank Mt. Nan National Park staff for their invaluable assistance in the field.
References 1. Bruijnzeel, L.A., Proctor, J.: Hydrology and biochemistry of tropical montane cloud forest: what do we really know? In: Hamilton, L.S., Juvik, J.O., Scatena, F.N. (eds.) Tropical Montane Cloud Forest, pp. 38–78. Springer, New York (1995) 2. Bubb, P., May, I., Miles, L., Sayer, J.: Cloud Forest Agenda. UNEP-WCMC, Cambridge (2004) 3. Foster, P.: The potential negative impacts of global climate change on tropical montane cloud forests. Earth-Science Reviews 55, 73–106 (2001) 4. González-Mancebo, J.M., Romaguera, F., Losada-Lima, A., Suárez, A.: Epiphytic ryophytes growing on Laurus azorica (Seub.) Franco in three laurel forest areas in Tenerife (Canary Islands). Acta Oecologica 25, 159–167 (2004) 5. Grace, W., Curran, E.: A binormal model of frequency distributions of daily maximum temperature. Australian Meteorology Management 42, 151–161 (1993) 6. Hamilton, L.S., Juvik, J.O., Scatena, F.N.: The Puerto Rico Tropical Cloud Forest Symposium: Introduction and Workshop Synthesis. In: Hamilton, L.S., Juvik, J.O., Scatena, F.N. (eds.) Tropical Montane Cloud Forests, pp. 1–23. Springer, New York (1995) 7. Stadtmüller, T.: Cloud forests in the humid tropic: a bibliographic review, pp. 1–81. The United Nations University, Tokyo (1987) 8. Still, C.J., Foster, P.N., Schneider, S.H.: Simulating the effects of climate change on tropical montane cloud forests. Nature 398, 608–610 (1999) 9. Weathers, K.C.: The importance of cloud and fog in the maintenance of cosystems. Trends in Ecology and Evolution 14, 214–215 (1999)