Proceedings of the ASME 2013 International Mechanical Engineering Congress and Exposition IMECE2013 November 15-21, 2013, San Diego, California, USA
IMECE2013-65474 COMPUTATIONAL FLUID DYNAMICS AND STRUCTURAL FINITE ELEMENT ANALYSIS OF A MICRO HYDRO TURBINE Jacob D. Riglin Lehigh University Bethlehem, PA, USA
[email protected] Zackary Kraybil Lehigh University Bethlehem, PA, USA
[email protected]
W. Chris Schleicher Lehigh University Bethlehem, PA, USA
[email protected] Robert C. Klein e-Harvest System Glen Gardner, NJ, USA
[email protected]
ABSTRACT Performance characteristics of a micro hydro turbine are determined through the use of computation fluid dynamics (CFD) and finite element analysis (FEA). CFD is used to optimize a portable micro hydro turbine. The runner geometry is designed as a non-uniform Archimedean Spiral. The transient 3D turbulent flow simulation is conducted for various runner designs to determine power generation and the efficiency. The equations governing the fluid motion through the turbine are solved in a frame of reference change between time-steps. A multiphase flow model is employed to study the cavitation for various flow rates and rotation rates to determine the onset of the cavitation. It was determined that the onset of cavitation occurred between inlet flow rates of 0.0625 m3/s and 0.075 m3/s for the 1.5 pitch Archimedean spiral at a rotation rate of 250 RPM. When the rotation rate is increased to 500 RPM, vapor formation within the flow exists between a flow rate of 0.05 m3/s and 0.0625 m3/s. The occurrence of cavitation was predicted using Cavitation number, with the critical number being approximately -10,000. The presence of cavitation caused the efficiency to drop up to 10%. Basic structural analysis of the Archimedean blade yielded a maximum von Mises stress of 143.67 MPa at flow rate of 0.1 m3/s and a rotation rate of 1000 RPM. From the von Mises stress obtained, aluminum alloy is the best material to be used based on the importance of material strength and weight. INTRODUCTION An Archimedes blade design was tested to determine performance characteristics, the presence of cavitation, and the
Alparslan Oztekin Lehigh University Bethlehem, PA, USA
[email protected] Corresponding Author
structural strength in order. CFD allows for the flow characteristics to be obtained within turbomachinery as well as producing performance characteristics. Turbomachinery may be optimized based on results obtained in a much more efficient manner [1]. From the flow data, nodal pressure, forces, etc. may then be applied to structural analyses. A structural model for the turbine blade was developed to yield the highest efficiency over the broadest range of available head. In addition to structural analysis, results from single phase simulations may be compared to results of multiphase simulations conducted at identical operating conditions. A significant amount of work has been done regarding the simulation of cavitation existing in turbomachinery. Multiphase models allow for cavitation effects to be determined within the flow regime [2] [3] [4] [5]. Results from multiphase simulations are often compared to results obtained from studies detailing experimental results, thus showing both predicted cavitation regions and the actual damaged produced from the existing cavitation [6]. NOMENCLATURE Ca Cavitation Number [ ] ⃗ F Body Forces [ kg m s-2 ] g⃗ Gravity [ m s-2] Hturb. Head [ m ] lshaft Location Along the Shaft Length [ m ] m Constant [ 1.5 ] ṁij Relative Mass Flow from Phase i to j [ kg s-1 ] ṁji Relative Mass Flow from Phase j to i [ kg s-1 ] N Number of Blade Rotations [ ] P Nodal Pressure [ Pa ]
1
Copyright © 2013 by ASME
p Pv PA Pturb. Q r⃑ Re t to u ⃗m v ⃗⃑r v vdr,ρ Vref X Y Z p m p t k ηturb. τblade τ̿r ⃗⃗⃑ ω Ωblade
Pressure [ Pa ] Vapor Pressure [ Pa ] Absolute Pressure [ Pa ] Power [ W ] Mass Flow [ kg s-1] Distance from the Axis of Rotation Reynolds Number [ ] Time [ s] Parametric Variable [ ] Velocity [ m s-1 ] Mass Average Velocity [ m s-1 ] Referential Velocity [ m s-1 ] Connected Drift Velocity and Rel. Velocity [ m s-1 ] Referential Cross Section Velocity [ m s-1 ] x-coordinate [ m ] y-coordinate [ m ] z-coordinate [ m ] Vapor Phase Volume Fraction [ ] Constant [ 0.012 ] Density [kg m-3] Density of Mixture [ kg m-3] Vapor Phase Density [ kg m-3] Local Dynamic Viscosity [ kg m-1 s-1 ] Turbulent Viscosity [kg m-1 s-1] Constant [ 1.3 ] Constant [ 1.0 ] Efficiency [ ] Torque [ N m ] Reynolds Stress Tensor Vorticity Rotation Rate of Blade [ rad s-1 ]
DESIGN AND MESHING What makes this geometry interesting to study is that it puts a twist on a traditional Archimedean screw. Generally, Archimedean screws are exposed partially to the working fluid and rely on the weight of the fluid trapped between blades to turn the screw as the fluid travels from a higher elevation to a lower. Archimedean screws are also used in the reverse to transport water to a higher potential [7]. In the proposed application, the Archimedean screw in enclosed in a casing and the working fluid is channeled through this casing with a driving pressure drop due across the screw due to a combination of geographical elevation differences and kinetic energy differences of the fluid. Another twist is that the pitch of the screw changes between the leading and trailing edges,
becoming steeper in that respective progression. The nonuniformity of the screw enhances the pressure drop across the screw, allowing more power to be extracted with a shorter screw section than a uniformly pitched screw. The nonuniformity of the screw blades are governed by the following geometric equations: 𝑋 = 𝑅𝑐𝑜𝑠(𝑡) (1) 𝑌 = 𝑅𝑠𝑖𝑛(𝑡)
(2)
𝑡 𝑚 𝑍 = 𝐿 (1 − ( ) ) 𝑁𝜋
(3)
𝑡=
𝑙𝑠ℎ𝑎𝑓𝑡 (𝑁𝜋) 𝐿
(4)
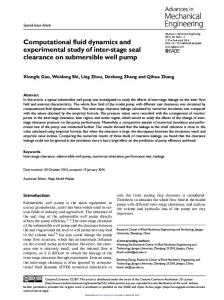
Eq. (1 through Eq. (4 relates the Cartesian coordinates of a radial section of the blade. The pitch of the blade is controlled by the power 𝑚 in the z-dimension as well as the parameter 𝑡 which relates how many times a blade wraps around the hub to the fractional axial length of the hub. Fig. 1 illustrates the design presented in this study based on the defined governing geometry equations. The screw has a hydraulic diameter of six inches and hub length of 19.5 inches.The defined non-uniformly pitched screw geometry was modeled using the solid modeling CAD package Solidworks, and was then exported to ANSYS Design Modeler, where the computational domain was defined as an enclosed pipe with an inner hydraulic diameter of six inches and length of 63.5 inches. In order to reduce the complexity of the model, the leakage gap between the screw and the casing was not modeled. Upon completion of the geometric computational domain, the data was passed to ANSYS Meshing for mesh generation. The mesh that was used is a hybrid mesh, consisting of approximately two million elements and making use of a structured hex mesh in the inner regions of the domain. Near solid boundaries, a prism mesh with increasing layer thickness was used to help resolve boundary layer effects. Quadrilateral and tetrahedral elements were used to bridge the prism and hex elements together. Fig. 2 is representative of the mesh generated for the CFD portion of this study. The maximum and minimum y+ values for the blade and housing were found to be 54.269 and 0.172, along with an overall average of 17.119. The values are acceptable for turbulence modeling within the log region of the turbulent boundary layer.
Fig. 1. Design of the Non-uniformly Pitched Archimedean screw Turbine Presented in this Study.
2
Copyright © 2013 by ASME
Outlet
Inlet
Fig. 2. Mesh Generated for CFD Analysis (a) The Entire Domain (b) End-view of Casing Mesh (c) Surface Mesh on the Screw.
Fig. 3 shows the mesh produced for the finite element analysis of the blade. The number of elements must be increased until the stress in the blade converges. The mesh seen in Fig. 3 consists of 212773 elements. The element density increases near the shaft since fracture is most likely to occur at regions were changes in geometry are more prevalent. Material properties for each material were used directly within ANSYS. Alluminum alloy was the main material tested due to corrosion resistance, density, cost, stiffness, and yield strength of the material. The default values for Aluminum Alloy are 280 MPa yield strength and a density of 2770 kg/m3. This yields a mass of 0.91045 kg or 2.0072 lbm for the turbine blade.
Fig. 3. Blade meshing for FEA analsys.
MODELING AND NUMERICAL METHOD With a completed mesh, the CFD was carried out with ANSYS Fluent solving RANS with a turbulence model and the continuity equation. The turbulence model chosen for these computations was Yakhot and Orszag’s variant on the standard k-epsilon model, the renormalized-group or RNG k-epsilon model [8]. Transient simulations were used in this study to analyze performance characteristics of the turbine at various times during operation. The transient method chosen uses a frame of reference change to formulate the fluid’s velocity relative to a stationary blade. The equations for conservation of mass and conservation of momentum for this method take the form: 𝜕𝜌 + ∇ ∙ 𝜌𝑣⃑ = 0 𝜕𝑡
(5)
𝜕 (𝜌𝑣⃑ ) + ∇ ∙ (𝜌𝑣⃑ 𝑣⃑ ) 𝜕𝑡 +𝜌(2𝜔 ⃗⃑ × 𝑣⃑ + 𝜔 ⃗⃑ × 𝜔 ⃗⃑ × 𝑟⃑) = −∇𝑝 + ∇ ∙ 𝜏̿ + 𝐹⃑
(6)
In the conservation of momentum term, there are two additional terms representing the Coriolis and centripetal accelerations [9]. The solution was initialized with ANSYS’s hybrid initialization method for 20 iterations. The time-step selection was chosen such that there were 100 time-steps per cycle or complete rotation of the turbine. The pressuremomentum coupling was carried out using the segregated SIMPLE algorithm that transforms the continuity equation in terms of pressure to correct the calculated velocity field.
3
Copyright © 2013 by ASME
On the inlet of the domain, a fully developed turbulent profile was assumed and governed by a user defined function based on an empirical relationship. Also, turbulence boundary conditions were approximated by specifying the hydraulic diameter of the inlet for the length scale (0.1524 m) and a turbulent intensity of 10%. The same condition for turbulence was supplied on the outlet in the event backflow was determined on the outlet. Solid boundaries were modeled as noslip, hydraulically smooth walls. The screw geometry was modeled as a wall rotating with the frame of reference of the mesh zone. Head, total power, and efficiency were calculated for volumetric flow rates ranging from 0.05 m3/s to 0.5 m3/s while varying rotation rate from 250 RPM to 1000 RPM. The mass flow rate averaged total pressure was measured at cross sections of the domain 1.5 inches from the leading and trailing edges of the screw and the following equations were used to calculate the quantities in question. ∆𝐻𝑡 𝑃𝑡 𝜂𝑡
.
.
.
=𝜏
= 𝑎
𝑃𝑡 𝜌 𝑔∆𝐻𝑡
=
∆𝑃 . 𝜌 𝑔
(7)
Ω
𝑎
(8)
× 100%
(9)
. .𝑄
Only two models are capable of modeling cavitation within multiphase simulations, the Eulerian model and the Mixture model. The Mixture model was used to simulate the multiphase flow, using liquid water as the primary phase and water vapor as the second phase. The multiphase Mixture model was selected over the Eulerian model due the simplicity of the model. The Eulerian model requires momentum equations to be solved for each phase whereas the Mixture model solves one momentum equation for the collective phases. The interaction between both phases was set to “cavitation”. Slip velocity between the two phases was neglected. Mixture model continuity equation, momentum equation, and equation for secondary phases can be seen in Eq. (10 through Eq. (13 below [9]. 𝜕 (𝜌 𝜕𝑡 𝑚
𝑡
(𝜌𝑚 ) +
𝑚) +
− 𝑃+ 𝜌𝑚 𝑔 + 𝐹 +
∙[
∙ (𝜌𝑚
∙ (𝜌𝑚
𝑚(
∙ (∑
𝑚
𝑚)
𝑚 𝑚)
=0
𝜕 (𝜌 𝜕𝑡 𝑚
𝑚) +
∙[
− 𝑃+ 𝜌𝑚 𝑔 + 𝐹 +
𝜕 ( 𝜕𝑡
∙ (𝜌𝑚
𝑚(
𝑚
∙ (∑
𝜌 )+
∙(
𝑚 𝑚)
=
+
𝑚 )]
𝜌
,
𝜌
𝑚)
+
,
(12) )
= (13)
− ∙(
𝜌
,
) + ∑(𝑚̇ − 𝑚̇ )
A transient analysis was conducted using the aforementioned model. When using the uniform geometry, the solution was initialized using ANSYS’s hybrid initialization option. Importing transient data that was obtained from the single-phase solution initialized the 1.5 pitch geometry. The time step value was reduced slightly before the simulation was started. The solution control method and pressure correction method were selected to be “SIMPLEC” with a correction value of three and “PRESTO!”. During post processing, the Cavitation number, seen in Eq. (14, was utilized to determine the critical value at which the onset of cavitation occurs. By introducing the Cavitation number to the flow regime, the domain becomes non-dimensionalized in such a way to allow areas where cavitation, if it exists within the flow, is occurring regardless as to whether the simulation is single phase or multiphase [10]. Cavitation can only be simulated in multiphase simulations, but through the use of the Cavitation number, the regions susceptible to cavitation may be observed in the single phase simulations where multiphase effects/interactions are neglected.
=
(10) 0%
𝑃−𝑃 1 𝜌 𝑓 2
(14)
=
+
𝑚 )]
𝜌
,
+
,
)
(11)
In order to develop a model that would work for the broadest range of possible head and flow rate parameters, the case with the highest torque was selected as this case is likely to yield the highest stresses in the turbine blades. This was found to be 0.1 m3/s and 1000 RPM. The pressure distribution on the blades was imported into a mechanical FEA model. Fig. 4 shows the pressure distribution along blade at a flow rate of 0.1 m3/s and a rotation rate of 1000 RPM. The pressure distribution was used as one boundary condition and the end of the shaft was held in the fixed position.
4
Copyright © 2013 by ASME
rotation rate increases, so does the calculated power. This results in a steeper trend as rotation rate increases. The trend for efficiency peaks around 72% for each rotation rate investigated, meaning that the rotation rate does not affect the peak efficiency. However, rotation rate does affect the volumetric rotation rate at which the peak efficiency occurs. A higher rotation rates moves the peak efficiency to a higher flow rate and vice versa. Tab. 1. and Tab. 2. are representative of the results calculated for a rotation rate of 250 RPM and 500 RPM, respectively [11]. A maximum drop in efficiency of approximately 10% occurs between the single phase and multiphase simulations. Tab. 1. Example Results from CFD Calculations for 250 RPM
RESULTS The following figures are results for CFD simulations at 0.075 m3/s and 250 RPM. Fig. 5 depicts the pressure acting on the screw blades. The pressure is highest near the leading edge of the blade. As flow rate increases, the uniform total pressure distribution has increases and a much higher pressure gradient is seen in the trailing edge region. Rotation rate appears to have only a slight effect on this distribution.
Single Phase
Multiphase
Fig. 4. Nodal Pressure imported from CFD results.
Flow 3
[ m /s ]
Head [m]
Power [W]
0.101 0.086 0.076
7.549 5.27 4.163
1726.23 1185.48 904.59
Efficiency Efficiency [%] [%] 23.2 26.84 29.35
30.38 35.49 38.67
Tab. 2. Example Results from CFD Calculations for 500 RPM
Single Phase
Multiphase
Fig. 5. Pressure Contour on the Screw for 0.075 m3/s, 250 RPM.
The trend for calculated head shows that no matter the rotation rate, the required calculated head for that flow rate is approximately the same and only begins to more around the higher volumetric flow rates (approximately 0.4 m3/s). Also, as volumetric flow rate increases, the required head increases exponentially. The power increases exponentially just as was seen in the calculated head. However, rotation rate has a drastic effect on the calculated power. At a constant flow rate, as the
Flow [ m3/s ]
Head [m]
Power [W]
Efficiency [%]
Efficiency [%]
0.125 0.101
12.715 8.117
5286.8 3117.0
33.85 38.98
42.409 50.06
0.086 0.076
5.488 4.329
2123.7 1585.1
46.17 49.48
56.93 59.98
0.062
2.232
891.1
66.017
67.01
Fig. 6 shows the von Mises stress along the turbine blade, while Fig. 7 shows the same stress distribution but focuses in on the region where the maximum stress occurs. The shaft diameter and blade thickness were easily designed within a factor of safety of 3, meaning that the maximum von Mises stress observed in the blade and along the shaft was less than a third of the tensile stress of Aluminum. In the final
5
Copyright © 2013 by ASME
model both had factors of safety well above 3 due to geometric considerations. As can be expected, without any fillet the stress will never converge. This can be thought of as a crack which will not immediately fracture. Under repeated loads, however, the crack will grow and the cycles to failure are quite low. There is quite a bit of difficulty in modeling the fillet due to complex geometry. The maximum von Mises stress obtained at the shaft-blade connection was 143.67 MPa, allowing for a factor of safety of approximately 2.
Fig. 6. Equivalent (von Mises) Stress along the turbine blade for aluminum alloy.
The volume fraction contours of the secondary phase existing along the blade are shown in Fig. 8 for flow rates ranging from 0.075 m3/s to 0.010 m3/s at a rotation rate of 250 RPM. The onset of cavitation occurred at a flow rate between the values of 0.0625 m3/s and 0.075 m3/s. When the rotation rate increased to 500 RPM, the onset velocity dropped to a flow rate within the range of 0.05 m3/s and 0.0625 m3/s. As the flow rate increased, regardless of rotation rate, the intensity of the cavitation occurring at the exit of the turbine increased dramatically. From Fig. 8, at a flow rate of 0.010 m3/s the area in which cavitation is occurring is approximately four to five times larger than the area when the flow rate is at 0.0825 m3/s. The efficiency of the turbine dropped by approximately 8% to 12% from the efficiency produced from the single phase model when cavitation occurred. Fig. 9 shows the Cavitation number along the blade at a flow rate of 0.010 m3/s and a rotation rate of 250 RPM. Comparing the volume fraction contour in Fig. 8 at the same flow rate to Fig. 9, the multiphase simulation produces a Cavitation number contour that accurately corresponds to the volume fraction contour. The Cavitation number contours existing in Fig. 9 for both the multiphase simulation and the single phase simulation yield similar results, however the single phase Cavitation numbers extend up along the blade in the opposite direction of flow. This dissimilarity is caused by the density of the single phase simulation exceeding that of the multiphase simulation due to the lack of the secondary gas phase, which would lower the density of the overall mixture. The error becomes more profound as the intensity of the cavitation increases.
Fig. 7. Equivalent Stress along blade at region where maximum stress exists.
6
Copyright © 2013 by ASME
Fig. 8. Volume fraction contours along the blade at flow rates of 0.075 m3/s (left), 0.0825 m3/s (middle) and 0.010 m3/s (right) at a rotation rate of 250 RPM.
Fig. 9. Cavitation number along the blade for multiphase (left) and single phase (right) simulations at a flow rate of 0.010 m3/s and a rotation rate of 250 RPM.
7
Copyright © 2013 by ASME
CONCLUSIONS For the 1.5 power pitch Archimedes screw geometry, up to 1726 W and 4280 W of power were produced at rotation rates of 250 RPM and 500 RPM when the cut off velocity is 0.010 m3/s. A large pressure drop exists at the turbine outlet, along the shaft. When applying the conditions that would apply the greatest load to the turbine, 0.010 m3/s at 1000 RPM, the maximum von Mises stress existing in the turbine blade was 143.67 MPa under the assumption that the material of the blade was an aluminum alloy with properties of 280 MPa tensile strength and a density of 2770 kg/m3. From the geometry used, the weight of the turbine is 0.91045 kg. The maximum stress obtained showed that a factor of safety of two was obtained. The aluminum alloy selected allows for the blade and shaft to be light weight while still withstanding the loading applied during operation of rotation rates up to 1000 RPM. The onset of cavitation occurs between the flow rates of 0.0625 m3/s and 0.075 m3/s for a rotation rate of 250 RPM and 0.050 m3/s and 0.0625 m3/s when the rotation rate is increased to 500 RPM. When cavitation was present, the efficiencies observed were approximately 8% 12% lower than the values obtained from the single phase simulations at corresponding flow rates. Cavitation number was effective in normalizing the flow in such a way as to compare both single phase and multiphase simulations. The Cavitaion number contours for the multiphase simulations align almost perfectly with the corresponding volume fraction contours along the blade. ACKNOWLEDGMENTS The authors would like to gratefully acknowledge Navy funding this work under Award N00014-12-M-0050. REFERENCES
“Demonstrating and Validation of a 3D CFD Simulations Tool Predicting Pump Performance and Cavitation for Industrial Applications,” Journal of Fluids Engineering, vol. 133, pp. 1-14, January 2011. [3] R. Medvitz, R. Kunz, D. Boger and J. Lindau, “Performance Analysis of Cavitating Flow in Centrifugal Pumps Using Multiphase CFD,” Journal of Fluids Engineering, vol. 124, pp. 377-383, June 2002. [4] S. Shukla and J. Kshirsagar, “Numerical Prediction of Cavitation in Model Pump,” in 2008 ASME International Mechanical Engineering Congress and Exposition. [5] H. Li, F. Kelecy, A. Egelja-Maruszewski and S. Vasquez, “"Advanced Computational Modeling of Steady and Unsteady Cavitating Flows",” in 2008 ASME International Mechanical Engineering Congress and Exposition, 2008. [6] X. Escaler, E. Egusquiza, M. Farhat, F. Avellan and M. Coussirat, “Detection of cavitation in hydraulic turbines,” Mechanical Systems and Signal Processing, vol. 20, pp. 983-1007, 2006. [7] G. Müller and J. Senior, "Simplified theory of Archimedean screws," Journal of Hydraulic Research, vol. 47, no. 5, pp. 666-669, 2009. [8] V. Yakhot, S. A. Orszag, S. Thangam, T. B. Gatski and C. G. Speziale, "Development of turbulence models for shear flows by a double expansion technique," American Institute of Physics, vol. 4, no. 7, pp. 1510-1520, 1992. [9] ANSYS, Inc., "Theory Guide," 2009. [10] L. d'Agostino and M. Salvetti, "Fluid Dynamics of Cavitation and Cavitating Turbopumps", vol. 496, Springer, 2008, pp. 1-15. [11] J. D. Riglin, "Cavitation Study of a Microhydro Turbine," 2012. [Online]. Available: http://preserve.lehigh.edu/etd/1134.
[1] W. C. Schleicher, "Numerical Investigation and Performance Characteristic Mapping of an Archimedean Screw Hydroturbine," 2012. [Online]. Available: http://preserve.lehigh.edu/etd/1270. [2] H. Ding, F. C. Visser, Y. Jiang and M. Furmancyzk,
8
Copyright © 2013 by ASME