Shervin Karimkashi, Nabeel Qazi and etc. I also would ...... 82â87, 2013. [209] P. Joshi and K. Sharma, âEffects of grain boundaries on the performance of poly-.
Computational Modelling of the Heat Transfer Phenomena in the Process of Photovoltaic Solar Cell Manufacturing
Mohammad Shakil Ahmmed School of Mechanical and Manufacturing Engineering The University of New South Wales
This dissertation is submitted for the degree of Doctor of Philosophy
February 2017
I would like to dedicate this thesis to my loving mother ...
Declaration
‘ I hereby declare that this submission is my own work and to the best of my knowledge it contains no materials previously published or written by another person, or substantial proportions of material which have been accepted for the award of any other degree or diploma at UNSW or any other educational institution, except where due acknowledgement is made in the thesis. Any contribution made to the research by others, with whom I have worked at UNSW or elsewhere, is explicitly acknowledged in the thesis. I also declare that the intellectual content of this thesis is the product of my own work, except to the extent that assistance from others in the project’s design and conception or in style, presentation and linguistic expression is acknowledged.’ Mohammad Shakil Ahmmed February 2017
Acknowledgements
I would like to extend thanks to many people, who so generously contributed to the work presented in this thesis. Special mention goes to my enthusiastic supervisor, Professor Evatt R. Hawkes. My PhD has been an amazing experience and I thank my supervisor wholeheartedly, not only for his tremendous academic support, but also for giving me so many wonderful opportunities. Similar, profound gratitude goes to Dr. Mohsen Talei, who has been a truly dedicated mentor. I am particularly indebted to Dr. Mohsen for his constant faith in my work, and for his support when so generously hosting me in. I have very fond memories of my time working with him. Special mention goes to Dr. Brett Hallam, Dr. Ziv Hameiri, and Dr. Xiaojing Hao for going far beyond the call of duty, and providing me with a fantastic conceptual framework. I am indebted to my many colleagues who supported me over the last four years, namely Dr. Obulesu Chatakonda, Dr. Yuanjiang Pei, Dr. Shyam Sundar Pasunurthi, Dr. Fatemeh Salehi, Jalal (James) Behzadi, Dr. Alexander Krisman, Dr. Shahram Karimi, Joshua Tang, Shervin Karimkashi, Nabeel Qazi and etc. I also would like to acknowledge the computational facilities supporting this project including the Australian NCI National Facility, the partner share of the NCI facility provided by Intersect Australia Pty Ltd., the Peak Computing Facility of the Victorian Life Sciences Computation Initiative (VLSCI), iVEC (Western Australia), and the UNSW Faculty of Engineering. Finally, but by no means least, thanks go to my family for almost unbelievable support. They are the most important people in my world and I dedicate this thesis to them.
Abstract
Recent developments in solar photovoltaic cell technology have enabled significant cost reductions so that in many markets it is now directly competitive with conventional energy generation. To maintain downward pressure on module prices and to improve efficiencies, continued developments of manufacturing processes are required. In this respect, laser processing offers advantages in achieving various fabrication steps by providing spatially precise and localised heating on short and controllable timescales, and offering continuous, high throughput, in-line processing. In designing new laser-processing approaches and in optimising existing ones, a detailed understanding of the resulting heat transfer, phase change, and other relevant phenomena that occur during the process is arguably valuable. Since experimental techniques to investigate these phenomena in detail would be very difficult and unwieldy to use as an optimisation tool, this thesis advocates an approach based in numerical modelling. The thesis first focuses on development and validation of a numerical model of heat transfer and phase change phenomena during laser-material interaction, and then implement the numerical model to reveal these phenomena in three significant laser processes used in the fabrication of solar cells: (1) laser based hydrogen passivation of defects in silicon wafers, (2) laser annealing of the absorber layer in copper zinc tin sulphide (CZTS) based solar cells, and (3) pulse laser-induced melting and solidification dynamics of the silicon wafers. The numerical model is developed in OpenFOAM, an open-source computational fluid dynamics toolbox written in C++. The developed OpenFOAM code is validated against several analytical and experimental reference cases related to the simulation of laser-semiconductor interaction, and an excellent agreement is observed between the model and the analytical and experimental results. In the first implementation of the model, the effect of continuous wave (CW) diode laserinduced heat transfer phenomena on the hydrogen passivation of silicon wafers is modelled. In the case of crystallographic defect passivation, it is demonstrated that an appropriate combinations of parameters can be chosen to enable process characteristics in the same range as those known to be optimal for conventional belt furnace or rapid thermal processing (RTP) methods, which are used to enable hydrogen release and diffusion and to passivate these
x defects. It is observed that the optimal temperature regime for passivation of Boron-Oxygen (B-O) defect complexes can also be obtained using different settings for the laser parameters. In addition, by coupling the thermal model with a model of the B-O defect system reaction rates, it is found that the passivated defect concentrations are significantly influenced by the processing times and the temperature distributions within the depth of the wafer. In the second implementation, the effect of CW diode laser-induced heat transfer phenomena on the processing of CZTS thin film solar cells is demonstrated. The model is applied to the situation of a CW diode laser beam annealing CZTS thin film deposited on a Molybdenum (Mo) soda lime glass substrate. It is shown that the Mo remains isothermal, whereas a temperature gradient can be observed in the CZTS thin film and the glass substrate. This temperature gradient is demonstrated to increase with the CZTS absorber layer thicknesses, which is expected to affect the absorber layer properties. Very thick absorber layers are shown to generate high thermal stress, which is associated with risk of delamination. Finally, appropriate settings of the laser-annealing parameters are determined that produce process characteristics similar to those that result in a CZTS absorber layer with optimum properties when processed via conventional methods such as the belt furnace and RTP. In the final implementation, the dynamics of laser-induced melting and subsequent resolidification of the silicon wafers are described. Silicon wafers are irradiated with a number of widely used pulse shapes, Gate, Gaussian, Weibull, Asymmetric and Q-switched, in the nanosecond regime to reveal the effect pulse shaping, i.e. the energy distribution within a single pulse, on the thermal processes and the associated melting and solidification dynamics. It is demonstrated that the transient behaviour of the heat transfer phenomena, parameterised by the surface temperature, heating and cooling rates, is significantly influenced by the variation of laser energy within the pulse. In turn, the heat transfer process controls the melting and solidification dynamics. The results suggest that in achieving a long melt duration with relatively low resolidification velocity and solid-phase thermal gradients, the pulses that ramp up quickly but deliver energy more slowly in the latter ramp-down half of the pulse would be beneficial, such as the Q-switched pulse. In summary this thesis makes a contribution to understanding heat transfer and related phenomena in key laser processing approaches used in solar cell manufacturing, providing guidance as to the selection of processing parameters and hence improved processing outcomes. It moreover demonstrates the utility of numerical models to provide this otherwise lacking information, thus potentially opening many future avenues for development and optimisation of laser processing methodologies.
xi
Preface The thesis concerns computational modelling of the heat transfer phenomena in the process of photovoltaic solar cell manufacturing. It is based on the following papers: Journal papers: 1. Mohammad Shakil Ahmmed, Brett J. Hallam, Evatt R. Hawkes, Mohsen Talei, Lihui Song and Stuart Wenham, “Laser annealing and its effect on the hydrogenation of silicon wafers”, is to be submitted to Journal of Applied Physics. 2. Mohammad Shakil Ahmmed, Xiaojing Hao, Evatt R. Hawkes, Mohsen Talei, Jongsung Park and Martin A Green, “Copper zinc tin sulfide (CZTS) thin film solar cells: continuous wave diode laser annealing and its heat transfer phenomena”, is to be submitted to Solar Energy-Journal. 3. Mohammad Shakil Ahmmed, Ziv Hameiri, Evatt R. Hawkes, Mohsen Talei and Stuart Wenham, “Dynamics of laser induced melting and solidification of silicon wafers for solar cells processing”, is to be submitted to Materials Science in Semiconductor Processing. 4. Lihui Song, Alison Wenham, Sisi Wang, Philip Hamer, Mohammad Shakil Ahmmed, Brett Hallam, Ly Mai, Malcolm Abott, Evatt R. Hawkes, CheeMun Chong and Stuart Wenham, “Laser enhanced passivation of silicon wafers”, International Journal of Photoenergy, vol. 2015, Article ID 193892, 1-13, 2015. Peer-reviewed conference papers: 1. Mohammad Shakil Ahmmed, Xiaojing Hao, Jongsung Park, Evatt R. Hawkes and Martin A Green, “Diode laser annealing of CZTS thin film solar cells”, 42nd IEEE Photovoltaic Specialists Conference, 1-5, 2015. 2. Mohammad Shakil Ahmmed, Mohsen Talei and Evatt R. Hawkes, “Implicit enthalpy method for modelling laser induced melting and solidification of silicon”, 19th Australasian Fluid Mechanics Conference, Melbourne, Australia, 8-11 December 2014. 3. Mohammad Shakil Ahmmed, Mohsen Talei, Evatt R. Hawkes, Lihui Song and Stuart Wenham, “Thermal simulation of laser annealing for hydrogenation of c-Si solar cells”, Proceedings of 52nd Solar Scientific Conference, Melbourne, Australia, 8-11 May 2014.
Table of contents Nomenclature
xxvi
1
Introduction 1.1 Thesis objectives . . . . . . . . . . . . . . . . . . . . . . . . . . . . . . . 1.2 Thesis outline . . . . . . . . . . . . . . . . . . . . . . . . . . . . . . . . .
2
Numerical methods 2.1 Introduction . . . . . . . . . . . . 2.2 Overview of the physical models . 2.3 Governing equations . . . . . . . 2.4 Boundary and initial conditions . . 2.5 Optics . . . . . . . . . . . . . . . 2.6 Numerical solver . . . . . . . . . 2.6.1 OpenFOAM . . . . . . . 2.6.2 Implementation . . . . . . 2.7 Numerical test cases . . . . . . . 2.7.1 Laser annealing . . . . . . 2.7.2 Melting and solidification 2.8 Concluding remarks . . . . . . . .
3
. . . . . . . . . . . .
. . . . . . . . . . . .
. . . . . . . . . . . .
. . . . . . . . . . . .
. . . . . . . . . . . .
. . . . . . . . . . . .
. . . . . . . . . . . .
. . . . . . . . . . . .
. . . . . . . . . . . .
. . . . . . . . . . . .
. . . . . . . . . . . .
. . . . . . . . . . . .
. . . . . . . . . . . .
. . . . . . . . . . . .
. . . . . . . . . . . .
. . . . . . . . . . . .
. . . . . . . . . . . .
Laser annealing and its effect on the hydrogenation of silicon wafers 3.1 Introduction . . . . . . . . . . . . . . . . . . . . . . . . . . . . . 3.2 Literature review and objectives . . . . . . . . . . . . . . . . . . 3.3 Objectives . . . . . . . . . . . . . . . . . . . . . . . . . . . . . . 3.4 Numerical procedures . . . . . . . . . . . . . . . . . . . . . . . . 3.5 Validation with the experimental results . . . . . . . . . . . . . . 3.6 Results and discussion . . . . . . . . . . . . . . . . . . . . . . . 3.6.1 Determining parameters based on RTP . . . . . . . . . . .
. . . . . . . . . . . .
. . . . . . .
. . . . . . . . . . . .
. . . . . . .
. . . . . . . . . . . .
. . . . . . .
. . . . . . . . . . . .
. . . . . . .
1 6 6
. . . . . . . . . . . .
9 9 9 10 13 15 18 18 23 26 26 34 37
. . . . . . .
39 39 40 42 43 51 53 53
xiv
Table of contents 3.6.2 B-O defect passivation . . . . . . . . . . . . . . . . . . . . . . . . Concluding remarks . . . . . . . . . . . . . . . . . . . . . . . . . . . . . .
64 70
4
Diode laser annealing of Copper Zinc Tin Sulphide thin film based solar cells 4.1 Introduction . . . . . . . . . . . . . . . . . . . . . . . . . . . . . . . . . . 4.2 Literature review . . . . . . . . . . . . . . . . . . . . . . . . . . . . . . . 4.3 Objectives . . . . . . . . . . . . . . . . . . . . . . . . . . . . . . . . . . . 4.4 Numerical procedures . . . . . . . . . . . . . . . . . . . . . . . . . . . . . 4.5 Validation with an experimental reference case . . . . . . . . . . . . . . . 4.6 Results and discussions . . . . . . . . . . . . . . . . . . . . . . . . . . . . 4.7 Concluding remarks . . . . . . . . . . . . . . . . . . . . . . . . . . . . . .
73 73 74 77 77 81 83 97
5
Dynamics of laser induced melting and solidification of silicon wafers for solar cells processing 99 5.1 Introduction . . . . . . . . . . . . . . . . . . . . . . . . . . . . . . . . . . 99 5.2 Literature review . . . . . . . . . . . . . . . . . . . . . . . . . . . . . . . 100 5.3 Objectives and problem descriptions . . . . . . . . . . . . . . . . . . . . . 102 5.4 Numerical procedures . . . . . . . . . . . . . . . . . . . . . . . . . . . . . 106 5.5 Validation . . . . . . . . . . . . . . . . . . . . . . . . . . . . . . . . . . . 107 5.6 Results and discussions . . . . . . . . . . . . . . . . . . . . . . . . . . . . 109 5.6.1 Surface temperature evolution . . . . . . . . . . . . . . . . . . . . 109 5.6.2 Dynamics of melting and solidification . . . . . . . . . . . . . . . 112 5.6.3 Temperature along depth of the wafer . . . . . . . . . . . . . . . . 120 5.7 Concluding remarks . . . . . . . . . . . . . . . . . . . . . . . . . . . . . . 127
6
Summary 6.1 Summary of the present work . . . . . . . . . . . . . 6.1.1 Development of the methodology . . . . . . 6.1.2 Hydrogen passivation . . . . . . . . . . . . . 6.1.3 CZTS absorber layer annealing . . . . . . . 6.1.4 Pulse laser-induced melting and solidification 6.2 Future works . . . . . . . . . . . . . . . . . . . . .
3.7
. . . . . .
. . . . . .
. . . . . .
. . . . . .
. . . . . .
. . . . . .
. . . . . .
. . . . . .
. . . . . .
. . . . . .
. . . . . .
. . . . . .
129 129 129 130 131 132 133
References
135
Appendix A Thermophysical and optical properties
159
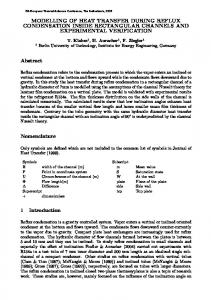
List of figures Physical processes during laser beam interaction with semiconductor, (a) laser heating and (b) melting and solidification. . . . . . . . . . . . . . . .
10
Schematic of the laser processing. The laser beam is considered fixed and the substrate moving. . . . . . . . . . . . . . . . . . . . . . . . . . . . . .
12
Schematic of the laser processing of thin film solar cells, (a) 3-D and (b) 2-D cross section. The laser beam is supposed fixed and the substrate moving. .
13
2.4
Boundary conditions used in the simulations. . . . . . . . . . . . . . . . .
15
2.5
Reflection of laser radiation at a flat interface between atmosphere 1 and material 2. . . . . . . . . . . . . . . . . . . . . . . . . . . . . . . . . . . .
16
2.6
Sketch of the reflection and refraction at a coated interface. . . . . . . . . .
17
2.7
Graphical representation, known as Unified Modelling Language (UML), diagram for GeometricField class. . . . . . . . . . . . . . . . . . . . . . .
20
2.8
Control volume for a 3-D Cartesian orthogonal structured grid [105]. . . . .
21
2.9
Flow chart of the implicit enthalpy method implemented in OpenFOAM.
.
25
2.10 Schematic of the laser heating of a slab. The x coordinate is shown only to improve clarity. The simulated problem is one dimensional. . . . . . . . . .
27
2.11 Comparison of the numerical and analytical temperature profiles (a) at the surface of the slab as a function of time and (b) within the depth of the slab at t = 1 µs, 2 µs and 3 µs, for the laser irradiation of Q0 = 1011 W/m2 and the constant optical surface absorption of Aopt = 0.056 [112]. . . . . . . . .
29
2.12 Comparison of the numerical and analytical temperature profiles (a) at the surface of the slab as a function of time and (b) within the depth of the slab at t = 1 µs, 2 µs and 3 µs, for the laser irradiation of Q0 = 1011 W/m2 and the optical surface absorption of Aopt = 0.056 + 3×10⁻⁵ T [112]. . . . . . .
30
2.13 Pulse shape used for laser heating of a slab, considering the laser characterising parameters of m p = 3, td = 45 µs and t0 = 10 µs [114, 116]. . . . . . . .
31
2.1 2.2 2.3
List of figures 2.14 Comparison of the numerical and analytical temperature profiles (a) within the depth of the slab at t = 3.9 µs and (b) at the front surface of the slab as a function of time, for Qmax = 0.5×10¹¹ W/m2 and Aopt = 0.678 [114]. . . . . 2.15 Comparison of the numerical and analytical temperature profiles as a function of time at x = 0 µm, 1 µm and 2 µm for α = 7.85×10⁵ 1/m. . . . . . . . . 2.16 Schematic of the diffusion controlled phase change problem. . . . . . . . . 2.17 Comparison of the present numerical and the results presented by Voller et al. [119] for (a) temperature history at the centre of the domain, and (b) progress of solidification with time. . . . . . . . . . . . . . . . . . . . . . . . . . . 2.18 Comparison of the numerical and the experimental results presented by Unamuno et al. [120] and Aziz et al.[121] for the melting depth as a function of laser energy density, for λ = 308 nm and FWHM = 30 ns. . . . . . . . . 3.1 3.2
3.3 3.4 3.5
Schematic of the CW laser annealing process, (a) 3-D view, (b) 2-D cross section employed in the calculations (A-A) and (c) diode laser beam [165]. Diagrammatic representation of the three-state model for B-O defect complex system [144]. The first state (A) describes the silicon material after high temperature processing before the formation of the recombination-active defect complex. Hence state A is comprised of the dissociated defect constituents, which form the recombination-active defect complex under illumination. The second state (B) describes the material in the degraded state after the formation of the carrier-induced defect complex. This typically occurs after exposure to carrier injection at relatively low temperature. The third state (C) describes the silicon material once the recombination-active defects have been passivated, to form a recombination-active hydrogen defect complex. This is typically achieved after the injection of hydrogen into the silicon during fast firing and a subsequent hydrogenation process incorporating minority carrier injection. State C is stable with exposure to subsequent minority carrier injection. . . . . . . . . . . . . . . . . . . . . . . . . . . . Comparison of the numerical and experimental results [180, 181] for the peak temperature as a function of the normalised incident laser power. . . . Maximum spot temperature of the silicon wafer as a function of the laser power density for a range of scanning speeds, for FWHM = 170 µm. . . . . (a) Temperature distributions on the surface, and (b) within the depth of the wafer (at the location directly underneath the laser) for the scanning speeds of 1 mm/s, 15 mm/s and 50 mm/s, at the laser power density of 5.74×10⁷ W/m2 and FWHM = 170 µm. . . . . . . . . . . . . . . . . . . . . . . . .
32 34 35
35
37
48
50 52 53
54
List of figures 3.6
Temperature distributions within the depth of the wafer for the cases where the wafer observes the same maximum spot temperature of 1000 K for the scanning speeds of 1 mm/s, 15 mm/s and 50 mm/s, and the laser power densities of 5.74×10⁷ W/m2 , 1.03×10⁸ W/m2 and 1.43×10⁸ W/m2 , respectively, and for the FWHM = 170 µm. . . . . . . . . . . . . . . . . . . . . . . . .
56
Temperature profiles as a function of time at a fixed location on the wafer at (a) the laser power density and scanning speed of of 5.74×10⁷ W/m2 and 1 mm/s, (b) the laser power density and scanning speed of of 1.03×10⁸ W/m2 and 15 mm/s, and (c) the laser power density and scanning speed of 1.43×10⁸ W/m2 and 50 mm/s, respectively, for FWHM = 170 µm. . . . . .
58
Maximum spot temperature as a function of laser power density with different substrate heating of the wafer for the scanning speed of 1 mm/s, and FWHM = 170 µm. . . . . . . . . . . . . . . . . . . . . . . . . . . . . . . . . . . .
59
(a) Temperature profile as a function of time, and (b) temperature distribution within the wafer at the laser power densities of 5.74×10⁷ W/m2 and 2.83×10⁷ W/m2 with the initial temperatures of 300 K and 673 K, respectively, and for the scanning speed of 1 mm/s and FWHM = 170 µm. . . . .
61
3.10 Thermal mismatch stresses within (a) SiNx film, and (b) silicon wafer at the laser power densities of 5.74×10⁷ W/m2 and 2.83×10⁷ W/m2 with the initial temperatures of 300 K and 673 K, respectively, and for the scanning speed of 1 mm/s and FWHM = 170 µm. . . . . . . . . . . . . . . . . . . .
63
3.11 Maximum spot temperature as a function of laser power density for the scanning speed of 0.1 mm/s, FWHM = 1000 µm, and substrate temperature of 300 K. . . . . . . . . . . . . . . . . . . . . . . . . . . . . . . . . . . .
64
3.7
3.8
3.9
3.12 (a) Temperature distribution, and (b) the defect population NC at the passivated state within the depth of the wafer at the laser power density, scanning speed, and FWHM of 4.46×10⁶ W/m2 , 0.1 mm/s and 1000 µm, respectively. 66 3.13 (a) Temperature distribution, and (b) the defect population NC at the passivated state within the depth of the wafer at the laser power density, scanning speed, and FWHM of 5.88×10⁶ W/m2 , 0.1 mm/s and 1000 µm, respectively. 67
List of figures 3.14 (a) Temperature distribution, and (b) the defect population NC at the passivated state within the depth of the wafer for the beam widths of FWHM = 1000 µm, 2000 µm, 3000 µm, 4000 µm and 5000 µm, and the scanning speed of 0.1 mm/s in the cases when the wafer observes the same maximum spot temperature of 600 K for the laser energy densities of 4.46×10⁶ W/m2 , 2.41×10⁶ W/m2 , 1.70×10⁶ W/m2 , 1.38×10⁶ W/m2 and 1.13×10⁶ W/m2 , respectively. The dwell times corresponding to the beam FWHM of 1000 µm, 2000 µm, 3000 µm, 4000 µm and 5000 µm are 10 s, 20 s, 30 s, 40 s and 50 s, respectively. . . . . . . . . . . . . . . . . . . . . . . . . . . . . . 4.1
4.2
4.3
4.4
4.5
4.6
4.7
69
Schematic of the CW diode laser annealing process of the CZTS/Mo/glass structure, (a) 3-D view, (b) 2-D employed cross section (A-A) and (c) diode laser beam [165]. The laser is supposed fixed and the substrate moving. . .
79
Comparison of the numerical and the experimental temperature profile as a function of time at the silicon/glass interface at the laser power density of 8.89 kW/m for the scanning speed of 5 mm/s. . . . . . . . . . . . . . . . .
82
Comparison of the numerical and the experimental results of maximum spot temperature as a function of energy dose at the exposure time of 6 ms and 12 ms. . . . . . . . . . . . . . . . . . . . . . . . . . . . . . . . . . . . . . . .
82
Maximum spot temperature as a function of laser power density for the CZTS/Mo/glass structure for a variety of scanning speeds for the CZTS and Mo layer thicknesses of 600 nm and 600 nm respectively, at T0 = 473 K. . .
84
Maximum spot temperature as a function of laser power density for the CZTS/Mo/glass structure for a variety of scanning speeds for the CZTS and Mo layer thicknesses of 1 µm and 600 nm respectively, at T0 = 473 K. . . .
84
Maximum spot temperature as a function of laser power density for the CZTS/Mo/glass structure for a variety of scanning speeds for the CZTS and Mo layer thicknesses of 2 µm and 600 nm respectively, at T0 = 473 K. . . .
85
The spatial distribution of temperature on the surface of the CZTS precursor at the laser power density of 5.32 kW/m and scanning speed of 100 mm/s for the CZTS film thicknesses of 600 nm, 1 µm, and 2 µm, at T0 = 473 K. The thicknesses of Mo and glass are kept constant, 600 nm and 3.3 mm respectively. The red rectangle AC represents the laser irradiated spot of 170 µm, in which A, B, and C are the front, centre and rear ends of the laser beam, respectively. . . . . . . . . . . . . . . . . . . . . . . . . . . . . . .
86
List of figures 4.8
Temperature distributions within the CZTS/Mo/glass structure for CZTS absorber layer thickness of 600 nm at the laser power density of 5.32 kW/m and scanning speed of 100 mm/s, at T0 = 473 K. The thicknesses of Mo and glass are kept constant, 600 nm and 3.3 mm respectively. Note that the length scale used on the axis is different between the glass and CZTS/Mo substrates. 87
4.9
Temperature distributions within the CZTS/Mo/glass structure for CZTS absorber layer thickness of 1 µm at the laser power density of 5.32 kW/m and scanning speed of 100 mm/s, at T0 = 473 K. The thicknesses of Mo and glass are kept constant, 600 nm and 3.3 mm respectively. Note that the length scale used on the axis is different between the glass and CZTS/Mo substrates. 88
4.10 Temperature distributions within the CZTS/Mo/glass structure for CZTS absorber layer thickness of 2 µm at the laser power density of 5.32 kW/m and scanning speed of 100 mm/s, at T0 = 473 K. The thicknesses of Mo and glass are kept constant, 600 nm and 3.3 mm respectively. Note that the length scale used on the axis is different between the glass and CZTS/Mo substrates. 88 4.11 Thermal stress within (a) CZTS film, (b) Mo film, and (c) glass substrate as a function of CZTS absorber layer thickness at the laser power density of 5.32 kW/m for the scanning speed of 100 mm/s, at T0 = 473 K. . . . . . . .
90
4.12 Temperature profiles as a function of time at the CZTS surface for the scanning speeds of 20 mm/s, 50 mm/s and 100mm/s for the cases in which the CZTS/Mo/glass structure observes the same maximum spot temperature at the laser power densities of 5.32 kW/m, 8 kW/m, and 10.5 kW/m respectively, at T0 = 473 K. The thicknesses of the CZTS film, Mo film and glass substrate are 1 µm, 600 nm, and 3.3 mm respectively. . . . . . . . . . . . . . . . . .
92
4.13 The spatial distribution of temperature profiles within the CZTS/Mo/glass structure for the scanning speeds of 20 mm/s, 50 mm/s and 100mm/s for the cases in which the CZTS/Mo/glass structure observes the same maximum spot temperature at the laser power densities of 5.32 kW/m, 8 kW/m, and 10.5 kW/m respectively, at T0 = 473 K. The thicknesses of the CZTS film, Mo film and glass substrate are 1 µm, 600 nm, and 3.3 mm respectively. Note that the length scale used on the axis is different between the glass and CZTS/Mo substrates. . . . . . . . . . . . . . . . . . . . . . . . . . . . . .
93
4.14 Temperature distributions (a) at the CZTS surface and (b) within the CZTS/Mo/glass multilayer systems at the laser power density of 8 kW/ m and 5.32 kW/m for the scanning speed of 100 mm/s at T0 = 300 K and 473 K, respectively. . . . 95
List of figures 4.15 Thermal stress distribution within (a) CZTS film, (b) Mo film, and (c) glass substrate at the laser power density of 8 kW/ m and 5.32 kW/m for the scanning speed of 100 mm/s at T0 = 300 K and 473 K, respectively. . . . . .
96
5.1
(a) Temporal pulse shape of Gaussian showing the ramp-up stage, rampdown stage and FWHM, and (b) the pulse shapes of Gaussian, Gate, Weibul, R Asymmetric, and Q-switched at the same laser energy, F(t)dt, and full width at half maximum (FWHM). t1 is the time at which the pulse delivers its maximum intensity. . . . . . . . . . . . . . . . . . . . . . . . . . . . . 104
5.2
Ratio of the ramp-up and ramp-down gradient, r = α ′ /β , and the pulse rise times, tr , associated with the pulse shapes of Gaussian, Weibull, Asymmetric and Q-switched. . . . . . . . . . . . . . . . . . . . . . . . . . . . . . . . . 105
5.3
Schematic diagram of the laser irradiated silicon wafer. The X coordinate is shown only to improve clarity. The simulated problem is one dimensional. . 105
5.4
Comparison of the numerical and the experimental results presented by Unamuno et al. [120] and Aziz et al. [121] for the melt depth as a function of laser energy, for λ = 248 nm and FWHM = 32 ns. . . . . . . . . . . . . 108
5.5
Temperature profiles on the surface of the wafer as a function of time for a variety of laser fluences for the Gaussian pulse shape. τ presents the time at which temperature reaches the maximum value. . . . . . . . . . . . . . . . 110
5.6
Temperature profiles on the surface of the wafer as a function of time for the pulse shapes of Gaussian, Gate, Weibull, Asymmetric, and Q-switched for the same laser fluence and FWHM of 1.6 J/cm2 and 32 ns, respectively. . . 111
5.7
The time delay ∆, pulse rise time tr , and r = α ′ /β associated with the pulse shapes of Gate, Gaussian, Weibull, Asymmetric and Q-switched. . . . . . . 112
5.8
(a) Melting front evolution, (b) corresponding surface temperature profile on and above the melting point, and (c) melt-front velocity as a function of time at the laser fluence of 1.6 J/cm2 , for the Gaussian pulse shape. . . . . . . . 115
5.9
Melt front evolution as a function of time for a variety of laser fluences for the Gaussian pulse shape. . . . . . . . . . . . . . . . . . . . . . . . . . . . 116
5.10 Melt front evolution as a function of time for the pulse shapes of Gaussian, Gate, Weibull, Asymmetric, and Q-switched at the same laser fluence and FWHM of 1.6 J/cm2 and 32 ns, respectively. . . . . . . . . . . . . . . . . . 117 5.11 Melting depth and melt duration for the pulse shapes of Gaussian, Gate, Weibull, Asymmetric, and Q-switched at the same laser fluence and FWHM of 1.6 J/cm2 and 32 ns, respectively. . . . . . . . . . . . . . . . . . . . . . 117
List of figures 5.12 The melt depth γ0 as a function of heating rate associated with the pulse shapes of Gaussian, Gate, Weibull, Asymmetric, and Q-switched at the same laser fluence and FWHM of 1.6 J/cm2 and 32 ns, respectively. . . . . . . . 5.13 The melt front velocity as a function of time for the pulse shapes of Gaussian, Gate, Weibull, Asymmetric, and Q-switched at the same laser fluence and FWHM of 1.6 J/cm2 and 32 ns, respectively. . . . . . . . . . . . . . . . . . 5.14 The propagation of melt front ∆γ after γ0 and the time that liquid phase remains at a depth of γ0 as a function of cooling rate associated with the pulse shapes of Gaussian, Gate, Weibull, Asymmetric, and Q-switched at the same laser fluence and FWHM of 1.6 J/cm2 and 32 ns, respectively. . . . . 5.15 Temperature distribution within the depth of the wafer at the heating times of 34 ns, 55 ns and 60 ns at the laser fluence of 1.6 J/cm2 for the Gaussian pulse shape. . . . . . . . . . . . . . . . . . . . . . . . . . . . . . . . . . . 5.16 Temperature gradient within the depth of the wafer at the heating times of 34 ns, 55 ns and 60 ns at the laser fluence of 1.6 J/cm2 for the Gaussian pulse shape. . . . . . . . . . . . . . . . . . . . . . . . . . . . . . . . . . . . . . 5.17 Temperature distribution within the depth of the wafer at the heating time of 55 ns for a variety of laser fluences for the Gaussian pulse shape. . . . . . . 5.18 Temperature gradient within the depth of the wafer at the heating time of 55 ns for a variety of laser fluences for the Gaussian pulse shape. . . . . . . . . 5.19 (a) Temperature distribution, and (b) thermal gradient within the depth of the wafer for the pulse shapes of Gaussian, Gate, Weibull, Asymmetric and Q-switched at time when the solidification ends for the same laser fluence and FWHM of 1.6 J/cm2 and 32 ns, respectively. . . . . . . . . . . . . . . 5.20 (a) Temperature distribution, and (b) thermal gradient within the depth of the wafer for the pulse shapes of Gaussian, Gate, Weibul, Asymmetric and Q-switched at time when the wafer ends to melt for the same laser fluence and FWHM of 1.6 J/cm2 and 32 ns, respectively. . . . . . . . . . . . . . .
118
119
120
121
122 122 123
125
126
A.1 Thermal conductivity of silicon [49, 100, 126, 127]. . . . . . . . . . . . . . 159 A.2 Product of specific heat (C p ) and density (ρ) of silicon [49, 100, 126, 127]. . 160 A.3 Relation of enthalpy density and temperature for silicon [102, 282]. . . . . 160
List of tables 2.1
Thermophysical properties of silicon used for validating with the analytical solutions [112, 114, 115]. . . . . . . . . . . . . . . . . . . . . . . . . . . .
28
Activation energies (Ea ) and characteristic frequencies (vi j ) for transitions from state i to state j (Ti j ) in the B-O defect complex systems associated with CID degradation in the silicon wafers [144]. . . . . . . . . . . . . . .
49
Laser annealing parameters used for the CZTS/Mo/glass structure. . . . . .
78
A.1 Optical properties of silicon . . . . . . . . . . . . . . . . . . . . . . . . . . A.2 Thermal conductivity, and product of density and specific heat of steel [173, 296–298] . . . . . . . . . . . . . . . . . . . . . . . . . . . . . . . . . . . A.3 Properties used for calculating thermal joint conductance . . . . . . . . . . A.4 Thermal and optical properties of CZTS film . . . . . . . . . . . . . . . . . A.5 Thermal and optical properties of Mo . . . . . . . . . . . . . . . . . . . . A.6 Thermal and optical properties of Glass . . . . . . . . . . . . . . . . . . .
161
3.1
4.1
162 163 164 164 164
Nomenclature Greek Symbols α
Absorption coefficient
α′
Ramp-up gradient
αexp
Thermal expansion coefficient
β
Ramp-down gradient
∆
Time delay
δ
Phase difference
εstraini Thermal strain at layer i γ
Phase fraction
γ0
Initial melt depth
γmax
Maximum melt depth
λ
Laser beam wavelength
Γφ
Diffusivity associated with the generic variable
Φ
Solution vector
φ
Generic variable
φ1,i
Incident angle
φ2,re f r Refraction angle φc
Angle of refraction in the coating
xxvii
Nomenclature
φN
Variable at the neighbouring cell
φP
Variable at the cell of interest
ρ
Density
ρi
Density of layer i
σ
Stefan-Boltzmann constant
σr
Root mean-squared of surface roughness
σstressi Thermal stress at layer i τ
Time at which temperature reaches to the maximum
τi
Transmissivity of layer i
Other Symbols A
Sparse matrix
A0
Optical absorption at room temperature
anb
Matrix off diagonal coefficients
Aopt
Optical Absorption
aP
Matrix diagonal coefficients
A(T ) Optical absorption as a function of temperature B
Array of source term
b
Source term in matrix form
Cp
Specific heat
C pi
Specific heat of layer i
C pl
Liquidus specific heat
C ps
Solidus specific heat
D
Diffusivity
dc
Thickness of the coating
Nomenclature F(t)
Temporal shape function
g
Gas constant
H
Total enthalpy
h
Sensible enthalpy
Hc
Micro-hardness
hc
Thermal contact conductance
hconv Convective heat transfer coefficient hg
Gap contact conductance
hj
Thermal joint conductance
Hl
Liquidus enthalpy
Hs
Solidus enthalpy
I
Laser beam intensity
i
Layer number of the multilayer structure
im
Imaginary number
I0
Initial laser intensity
K
Thermal conductivity
k
Extinction coefficient
k1
Extinction coefficient of air
k2
Extinction coefficient of material
kc
Extinction coefficient of coating
kg
Thermal conductivity of air
Ki
Thermal conductivity of layer i
Kl
Thermal conductivity of liquid
Ks
Thermal conductivity of solid
xxvIII
xxIx
Nomenclature
ks
Harmonic mean thermal conductivity
Lf
Latent heat of fusion
m
Iteration level
mp
Pulse parameter
mas
Effective mean absolute asperity slope
N
Complex refractive index
n
Real part of the complex refractive index
N1
Complex refractive index of medium 1
n1
Refractive index of air
N2
Complex refractive index of medium 2
n2
Refractive index of material 2
Nc
Complex refractive index of coating
nc
Refractive index of coating
ns
Surface normal vector
nt
Index for time step
Pcont
Contact pressure
Q0
Absorbed laser energy at the surface
ql
Liquidus flux
Qlaser Heat source due to absorbed laser power qs
Solidus flux
R
Reflection coefficient
r
Ratio of ramp-up and ramp-down gradient
Ri
Reflectivity of layer i
Sf
Face area vector
Nomenclature Sφ
Mean value
Sφ
Source term in generic equation
Sφ ,P
Value at the cell centre
T
Temperature
T∞
Ambient temperature
T0
Initial temperature
t0
Time at pulse amplitude maximum
t1
Time at which maximum intensity reach
td
Pulse duration
tγ
Time at which melt depth moves from initial to maximum
Ti
Temperature of layer i
TM
Melting temperature
tm
Time at which melt front starts to propagate
Tmax
Maximum temperature
tmax
Time at which melt depth reaches to maximum
tr
Pulse rise time
Tre f
Reference temperature
ts
Resolidification time
Y
Effective refractive index
Ym
Mean plane separation
xxx
Chapter 1 Introduction The delivery of affordable, accessible, and environmentally clean energy is among the most essential challenges facing society today. For over a century, energy has been provided overwhelmingly by fossil fuels [1]. The historical dominance of fossil fuels has been driven by their low costs, high availability, and despatchability on demand. However, their use has come at a significant price. Via release of carbon dioxide, and to a lesser extent methane, nitrous oxide, and carbonaceous particles, fossil fuel combustion has led to anthropogenic climate change [2]. Global average temperatures have risen already by 1 degree Celsius since the pre-industrial age [2], with significant global action being required to limit further rises and prevent catastrophic outcomes for humanity. Further to the issue of climate change, burning of fossil fuels releases various other pollutants that have severe negative consequences for human health and the environment. These include particulate matter, polycyclic aromatic hydrocarbons, nitrogen oxides, sulphur oxides, volatile organic compounds, carbon monoxide, and in some cases heavy metals [3]. Extraction and processing of fossil fuels also cause significant environmental damage [4]. Fossil fuels are not necessarily distributed around the globe where they are needed. Particularly, oil and gas resources are concentrated in a few regions of the world, some of which are politically unstable, which leads to risks with energy security and, according to some commentators, has led to wars being fought over access to resources. Finally, fossil fuels are ultimately a finite resource. Although there are significant quantities left, the financial and environmental cost of extracting the remaining resources is likely to increase over time [5]. Given the above considerations, a shift away from fossil fuels towards other energy generation approaches is inevitable. Solar photovoltaic (PV) technology stands out as a leading contender to provide a significant fraction of the world’s energy going forwards. Once considered too expensive for terrestrial applications, the cost and deployment trajectory
2
Introduction
of PV has been impressive. Since 1980, the module price has declined by 20 % for every doubling of capacity [6]. Correspondingly, installed PV capacity has in the last two decades been growing exponentially, having risen from 309 MW in 1996 [7] to 178 GW in 2014 [8], which corresponds to a doubling of capacity every 2 years. As a result, solar PV has already achieved grid parity in many markets [9], and there is a growing awareness that solar PV will soon provide one of the lowest cost options for electricity supply [10]. When the historical cost advantages of fossil fuels no longer exist, which is already the case in some markets, it seems likely that a major transition will take place. To maintain downward pressure on PV module prices and to increase module efficiencies, increasingly sophisticated manufacturing processes are required. The fabrication of PV devices involves a wide array of processing steps dictated by the device architecture and the material systems used, which fundamentally determine the photovoltaic conversion efficiency and the cost. Although a solar cell can be defined as a simple p-n junction diode [11], the fabrication of high-efficiency solar cells requires careful processing techniques along with precise control [12]. Lasers offer a variety of advantages in performing key steps in the manufacturing process. They offer the ability to provide spatially precise and localised heating on potentially short timescales, and offer continuous, high throughput, in-line processing [12–15]. It is well known that the performance of a photovoltaic solar cell is determined by a number of factors, such as the defect concentration, the crystallinity or micro-structure of the semiconductor, the emitter profile or quality of the junction, the properties of transparent conducting oxide (TCO), the quality of the metallic contact, and the cell interconnection scheme [12]. To address these design considerations, laser processing may be utilised for a variety of purposes in the form of annealing [16–22], doping [23–30], edge-isolation [31], drilling [14, 15], welding and patterning [32]. The application of laser processing for photovoltaic solar cells depends on the material system, e.g. whether silicon wafer based or thin-film based, the cell architecture, and the particular objective of the process been carried out (laser-doping, annealing, edge-isolation, etc.). In the case of thin-film based solar cells, thermal processing by laser annealing has been identified as a potential route to produce high quality thin-film based semiconductors such as copper indium gallium di-selenide (Cu(In,Ga)(Se,S)2 ) [33, 34], cadmium telluride (CdTe) [35], and amorphous-silicon (a-Si) [36–38]. Also, laser annealing of thin-film based solar cell has been shown to provide a significant improvement of the absorber layer morphology, such as larger and compact grain growth with very low roughness, which improves cell performance [37]. For performing edge isolation and creating monolithic interconnection for thin-film solar cells, including amorphous-silicon, laser patterning has
3 been widely used [33, 34]. In the case of silicon wafer based solar cells, laser processing has been employed for a number of applications, such as defect removal by means of hydrogen passivation [16–22], junction formation [27, 29, 39–41], laser doping of selective emitters [23–30], laser-grooved buried contacts [42] and damage removal from the ionimplanted layer [23, 27]. While thermal treatments achieved via lasers have been widely demonstrated, continued improvement in manufacturing procedures is always demanded to maintain and/or enhance product competitiveness. Furthermore, PV devices themselves continue to evolve, opening up potentially new applications for lasers in PV manufacturing. It is essential therefore to optimise the involved laser processing methodologies to improve product and reduce costs. It is important that laser processes reliably achieve their aims, and that potentially negative side-effects are avoided, such as the formation of thermal stress which can result in brittleness, hardness, crack damage of the surface, delamination between the interfaces of the absorber layers, etc. [26, 29, 43–50]. Such optimal outcomes arguably cannot be achieved only by a trial and error approach. It is essential to have a complete understanding of the laser-material interaction and the associated heat transfer, phase change, and other important phenomena. This will result in strategies to better control processing parameters, and hence improve the manufactured high-efficiency and/or low-cost solar cells. However, while the final outcomes of a laser process can be assessed experimentally, it would be very difficult to fully understand the heat transfer phenomena during laser processing via experimental methods. The relevant laser-material interactions occur on typically short timescales and length-scales, and many of the important phenomena occur inside the material, which is experimentally very difficult to access. Also, it is not possible to produce a reasonable description of the heat transfer phenomena occurring during laser processing via analytical methods, due to these phenomena being governing by complex, nonlinear partial differential equations, which do not have analytic solutions. These considerations lead to the numerical modelling approach adopted in this thesis. The objective of this thesis is to demonstrate the power of numerical modelling to understand and optimise laser processing used in solar cell manufacturing. Three different applications of laser processing, with differing objectives and differing characteristics, are considered as examples. The three applications were selected based on the potential of the technologies, interest in their development within the School of Photovoltaic and Renewable Energy Engineering at the University of New South Wales (UNSW), and the lack of detailed information regarding laser-material interactions. These selections are further motivated in the following.
4
Introduction
The first technology considered is the application of lasers to effect hydrogen passivation of silicon wafers. Hydrogen passivation, or hydrogenation, is a key strategy used in the PV industry to improve the performance of silicon solar cells [43, 51–58]. Crystalline silicon, when manufactured by a variety of methods contains impurities and defects which act as recombination sites for carriers, thus reducing their lifetime and consequently the cell’s performance [59]. It is believed that during hydrogen passivation, hydrogen binds to these defects and renders them inactive as recombination sites [56, 60–66]. Recently, hydrogenation has become increasingly important with significant interest in using lower cost sources of silicon such as upgraded metallurgical grade (UMG) silicon, which contain higher levels of impurities and thus defects[67]. Traditional methods of hydrogen passivation are insufficiently effective in these cases, and new methods are therefore required. There are three important steps in hydrogen passivation, which can all be achieved via laser processing. First, hydrogen has to be released from the SiNx anti-reflection coating, second, it has to diffuse throughout the wafer, and third, it has to react with the defects to result in passivation [68–70]. Laser processing offers a high throughput means to achieve these ends. Importantly, and in contrast to traditional methods of belt furnace and rapid thermal processing (RTP), it also offers the ability to passivate Boron-Oxygen defects which would otherwise arise in the field [71, 72]. Recent modelling [67] suggests that the rate-limiting process for passivation of these defects is their formation, and this can be accelerated by laser illumination which provides injection of carriers.
The second technology considered in the thesis is laser processing of copper zinc tin sulphide (CZTS)-based thin-film solar cells. Thin-film solar cells are of significant interest due to their very low material costs. However, for PV to become among the dominant future energy technologies, it is important for solar cell materials to be earth abundant and non-toxic. In this respect, Cu2 ZnSnS4 (CZTS) is widely considered to be an ideal material [73–78]. Moreover, its electrical properties can be manipulated to fulfil specific needs in a PV device [79]. Thermal annealing is used to enhance crystallinity and phase purity of the cells, and thus improve the structural, optical, surface morphological and electrical properties [80]. This annealing can in principle be carried out by conventional furnace annealing (FA) [81] or rapid thermal annealing (RTA) [81–84]. However, laser methods offer several advantages over these conventional approaches. The localised and intense heat source provided by a laser provides the opportunity to raise the film to higher temperature over a significantly lower time than RTA and FA, while permitting the substrate to remain at significantly lower temperature. As a consequence, a short cycle time for reaction can be obtained [85] and thermal exposure reduced.
5 The third technology application considered is the general problem of melting of a surface layer of silicon via application of a pulse layer. Surface melting is carried out for a number of reasons. For example, even very early work demonstrated the laser-based removal of surface damage arising from ion-implantation of dopants [23, 27]. In other applications, by taking advantage of high mobility and solubility of dopants in the liquid phase, a number of approaches have employed lasers to dope a surface region, including to create a large area emitter [86, 87], a back surface field [87, 88], and more recently, to create a selective emitter. The present work was inspired mainly by interest in selective emitter technology, known at UNSW as laser doping. This technology is motivated by the fact that in modern cells, there is a trade-off between conductivity of the doped silicon and carrier lifetimes, the former requiring a high doping concentration and the latter requiring a low one. High conductivity is particularly needed near contacts. In the UNSW laser doping process [89], the dopant source is applied onto the dielectric film as a spin-on coating. A laser beam scans over the regions to locally melts the silicon. This causes local removal of the dielectric film and induces diffusion of dopants in liquid phase. This results in the simultaneous formation of a selective emitter and self-aligned metallisation pattern. A number of high-efficiency solar cells, both on n-type and p-type substrates, have been manufactured by this methodology [90–92]. One key aspect of the interaction of pulse lasers with silicon material, which is important not only for laser doping mentioned above but also for other technologies, is the effect of the pulse shape, i.e. the temporal distribution of laser energy within the pulse. Various pulse shape options are available, and each is expected to have its own characteristics in terms of important parameters such as the melting duration, which affects the time available for dopant diffusion, and the resolidification velocity, which affects the quality of the resolidified material, particularly the propensity for thermal-stress related damage. Information on this aspect was found to be lacking in the literature, motivating its consideration in this thesis. It is hoped that the application of numerical modelling of the above three key technologies will be helpful not only to improve the performance of future devices but also provide new and more specific guidelines to reduce cost and time when designing new fabrication lines and process set-ups.
6
1.1
Introduction
Thesis objectives
This thesis examines the effect of laser induced heat transfer phenomena. It focuses on two different aspects. The first is the development and validation of a numerical model to capture the thermal processes during laser processing. The second is the application of the model to three laser-processing technologies: (1) hydrogen passivation of defects in the silicon wafers, (2) laser annealing of the CZTS thin-film based solar cells, and (3) melting and solidification of the silicon wafers with pulse lasers. The objective in the applications is to better understand the laser material interactions and to provide guidance for future development of optimal process conditions.
1.2
Thesis outline
In the following, the detail of the content of each chapter of this thesis is summarised. Chapter 2 discusses the numerical approach used for the modelling. The numerical model encompasses the equations governing heat transfer and phase change, and has been implemented using the finite volume method (FVM). The implementation was carried out in the framework of OpenFOAM [93], an open-source computational fluid dynamics (CFD) toolbox written in C++. At the end of this chapter, numerical test cases used to validate the developed solvers in OpenFOAM are presented. Several known benchmark test cases are presented, in which the relevant physical aspects in laser induced heat transfer phenomena are exposed and assessed. Chapter 3 presents a study of the effect of diode laser induced heat transfer phenomena on the hydrogen passivation of silicon wafers. Laser parameters are first determined that result in similar maximum temperatures, exposure times, and cooling rates as in conventional belt furnace or rapid thermal processing methods to achieve hydrogen release, diffusion, and passivation of crystallographic defects. The resulting thermal distributions are characterised in detail. Next, laser parameters are determined that can induce passivation of B-O defects, and defect passivation is assessed with the aid of a recently introduced model of the defect complex. Chapter 4 describes the diode laser annealing of CZTS based thin-film solar cells. The study models solar cells containing CZTS thin-film deposited on molybdenum (Mo) coated soda lime glass substrate. A variety of absorber layer thicknesses, i.e. CZTS, were used, whereas the thicknesses of Mo and glass substrate were kept constant. The effect of diode laser induced heat transfer phenomena on designing of CZTS thin-film based solar cell architectures are examined.
1.2 Thesis outline
7
Chapter 5 presents a numerical study of the dynamics of pulsed laser induced melting and solidification of silicon wafers. A variety of widely used pulsed shapes were considered in the annealing process, and transient effects associated with the pulse shapes, on the heat transfer and melting dynamics in silicon the wafers were investigated. Chapter 6 concludes the thesis and provides a summary of the results presented, and gives an outlook for future work.
Chapter 2 Numerical methods 2.1
Introduction
This chapter presents the numerical methods employed in this thesis. Firstly, the physical problem of laser beam interaction with semiconductors is described. The governing equations pertaining to this problem are presented next. The equations for calculating the optical properties in the cases of uncoated, and coated surfaces are then presented. Following that, the open-source CFD code OpenFOAM is briefly introduced and the implementation of the governing equations into this solver is explained [93]. Finally, the numerical test cases used for validating the developed numerical solver are presented.
2.2
Overview of the physical models
Laser beam interaction with a semiconductor is a complex process resulting in many physical phenomena occurring simultaneously. When a semiconductor, such as silicon and copper zinc tin sulphide (CZTS), is irradiated with a laser, photons, which interact with electrons in the conduction band, are absorbed [94, 95]. During this process, a fraction of the irradiated energy is reflected, and the remaining is absorbed as thermal energy through successive collisions between electrons and lattice phonons [95–97]. The absorbed energy then initiates a series of effects such as temperature rise and, if the temperature is sufficient, melting and solidification. These processes may result in the alteration of the material’s physical and chemical properties. In laser processing techniques for photovoltaic manufacturing, these property changes are explained to create lasting effects on the material. Figure 2.1 and 2.1b show a schematic of the laser beam interaction with a semiconductor for a case in which the temperature rise is sufficient to promote melting.
10
Numerical methods
(a) laser beam interaction with semiconductor
(b) melting process
Fig. 2.1 Physical processes during laser beam interaction with semiconductor, (a) laser heating and (b) melting and solidification.
2.3
Governing equations
As the time required for electrons to transfer energy to the lattice is much shorter than the laser beam duration used for solar cell processing, energy is absorbed in the semiconductor
11
2.3 Governing equations
in the form of heat [94]. The material response can be explained by the spatial and temporal evolution of the temperature field, which is governed by the transient heat conduction equation. The heat equation, taking into account the enthalpy of melting and solidification, may be expressed as [98]
dH = ∇.(K∇T ) + Qlaser . dt
(2.1)
Here, H is the total enthalpy, K is the thermal conductivity, ∇T is the gradient of T and Qlaser is the heat source due to the absorbed laser power which can be expressed as,
Qlaser = (1 − R)αI.
(2.2)
Here, R is the reflection coefficient, α is the absorption coefficient, and I is the laser beam intensity. A more detailed description of these parameters will be presented in section 2.5.The enthalpy in the energy equation, eq. 2.1, consists of the sensible enthalpy and the latent heat of fusion when melting and solidification is considered. Therefore, the total enthalpy can be expressed as [98],
Z T
H = h + γρL f =
Tre f
ρC p dT + γρL f .
(2.3)
Here, h is the sensible enthalpy, L f is the latent heat of fusion, Tre f is the reference temperature, ρ is the density, and γ is the phase fraction. Substituting eq. 2.3 into eq. 2.1 leads to the following form of the energy equation,
d(ρC p T ) dγ = ∇.(K∇T ) + Qlaser − ρL f . dt dt
(2.4)
The liquid fraction in energy equation, eq. 2.4, is a Heaviside step function which can be written as,
γ = 1,
when T > TM ,
γ = 0,
when T < TM .
(2.5)
12
Numerical methods
Here, TM is the melting temperature. The heat equation, eq. 2.4, in absence of the melting and solidification can be expressed as
d(ρC p T ) = ∇.(K∇T ) + Qlaser . dt
(2.6)
To account for a moving heat source a coordinate system moving with the laser beam can be employed as shown in Fig. 2.2, which leads to an extra term in the energy equation as follows [99],
d(ρC p T ) dT = ∇.(K∇T ) + ρC p v + Qlaser , dt dx
(2.7)
where, v is the scanning speed. This transformation reduces computational cost and implementation complexity.
Fig. 2.2 Schematic of the laser processing. The laser beam is considered fixed and the substrate moving. In multilayer systems, a number of thin films are deposited on the substrate, as can be seen in Fig. 2.3. Therefore, the transient heat conduction equation for a multilayer structure can be written as [100],
d(ρiC pi Ti ) dTi = ∇.(Ki ∇Ti ) + ρiC pi v + Qlaseri . dt dx
(2.8)
13
2.4 Boundary and initial conditions
Here in layer i, ρi is the density, C pi is the specific heat, Ki is the thermal conductivity, and Qlaseri is the heat source due to absorbed laser power.
(a) 3D
(b) 2D cross section
Fig. 2.3 Schematic of the laser processing of thin film solar cells, (a) 3-D and (b) 2-D cross section. The laser beam is supposed fixed and the substrate moving.
2.4
Boundary and initial conditions
The boundary conditions used in this thesis are schematically shown in Fig. 2.4. At the bottom and sides of the work-piece, Neumann boundary conditions are imposed [49]. For the top surface, both the convection-radiation and Neumann boundary conditions we separately imposed and tested. The results showed that the effect of convective and radiative heat transfer from the front surface is almost negligible for most of the cases, which is also mentioned by [49]. Hence, the Neumann boundary condition is employed in the cases where
14
Numerical methods
the effect of convection and radiation is negligible. The initial and boundary conditions can be expressed as, T (x, y, z, 0) = T0 , ∂T = 0 at X = −L/2 and X = L/2, ∂x
(2.10)
∂T = 0 at Y = H, ∂y
(2.11)
∂T = 0 at Y = 0, or, ∂y
(2.12)
∂T = hconv (T − T∞ ) + εσ (T 4 − T∞ 4 ) at Y = 0, ∂y
(2.13)
∂T = 0 at Z = −W /2 and Z = W /2. ∂z
(2.14)
−K
−K
−K
−K
(2.9)
−K
Here, T0 is the initial temperature, L is the length, W is the width, H is the depth, hconv is the convective heat transfer coefficient, σ is the Stefan-Boltzman constant, ε is the emissivity, and T∞ is the ambient temperature. In the case of a multilayer structure, the temperature and heat flux must be continuous functions of position, and hence the boundary conditions at the interfaces can be expressed as, Ti (yi ) = Ti+1 (yi ) and Here, i is the layer.
∂ Ti ∂ Ti+1 = −Ki+1 . − Ki ∂ y yi ∂ y yi
(2.15)
15
2.5 Optics
Fig. 2.4 Boundary conditions used in the simulations.
2.5
Optics
As the laser light can be well approximated by directional beams, absorption and reflection effects are modelled by geometrical optics [101]. In order to calculate Qlaser in eq. 2.2, R, α, and I need to be first obtained. The equations used for calculating these parameters will be therefore discussed in this section.
Absorption coefficient, α The absorption coefficient, which is the basic quantity for considering the absorption effects, can be calculated using the extinction coefficient and the wavelength of the laser light as follows, 4πk . (2.16) λ Here, α is the absorption coefficient, k is the extinction coefficient, and λ is the laser beam wavelength. α=
16
Numerical methods
Laser intensity, I The absorption equation for intensity can be expressed in one dimension as follows [49], dI = −αI. dy
(2.17)
Here, y is the depth along the material, and I is the laser intensity. The laser intensity within the material can be obtained integrating eq. 2.17 as follows, Z I dI I0
I
=−
Z y
αdy,
(2.18)
αdy),
(2.19)
0
or, Z y
I = I0 exp(−
0
where, I0 is the laser intensity on the surface.
Reflection coefficient, R, for a single layer system Reflection coefficient is an indicator of how much energy will be reflected from the material surface. This coefficient depends on the polarisation, and the angle of incidence φinc of the radiation as well as the refractive index of the atmosphere N1 and the material N2 . Figure 2.5 shows the reflection of a laser beam from a flat surface between the atmosphere and the material. The incident laser beam for solar cells manufacturing are commonly perpendicular to the surface [102]. Also, the surrounding medium, i.e. atmosphere, is transparent, which means that the extinction of the surrounding medium can be treated as zero. Hence, the reflection coefficient can be expressed using the well known Fresnel law as follows [103]
Fig. 2.5 Reflection of laser radiation at a flat interface between atmosphere 1 and material 2.
17
2.5 Optics
N1 − N2 2 . R = N1 + N2
(2.20)
Here, N1 and N2 are the complex refractive index of air, and the material, respectively and can be expressed as, N1 = n1 − im k1 ,
and
N2 = n2 − im k2 .
(2.21)
(2.22)
Here, n1 and n2 are the real refractive indexes of air and material, and k1 and k2 are the extinction coefficients of air and material, respectively. As the extinction coefficient of air is zero, k1 = 0, substituting eq. 2.21 and 2.22 into eq. 2.20 R=
(n1 − n2 )2 + k2 2 . (n1 + n2 )2 + k2 2
(2.23)
Reflection coefficient for a coated interface A thin film coating on the wafer surface is usually applied to reduce the amount of reflected energy; for example a SiNx thin film is used on silicon wafer based solar cells. A thin film coating may characterised by its thickness dc and refractive index Nc = nc − im kc . Figure 2.6 shows the reflection of laser beam at a coated interface, in which N1 , Nc , and N2 are the complex refractive indices of the air, coating and substrate material, respectively. The reflection coefficient of the combination of air, coating and the underlying medium can be expressed as [103]
Fig. 2.6 Sketch of the reflection and refraction at a coated interface.
18
Numerical methods
N1 −Y 2 . R = N1 +Y
(2.24)
Here, Y is the ’effective refractive index’ of the combination of coating and material, and can be expressed as [104], Y=
N2 cosδ + im Nc sinδ , 2 cosδ + im ( N N1 )sinδ
(2.25)
where, Nc = nc − im kc . The phase fraction δ can be obtained as, δ=
2πNc dc . λ cosφc
(2.26)
Here, φc is the angle of refraction in the coating.
2.6
Numerical solver
2.6.1
OpenFOAM
OpenFOAM (Open Field Operation and Manipulation) [93], an open-source computational fluid dynamics toolbox, licensed under the GNU General Public License (GPL) was used in this study. It is written in the C++ programming language using the object oriented programming paradigm [93]. Object oriented programming allows for writing the solver as a hierarchy of so-called classes and functions, which are related to data-sets and operations. These classes and functions can be deemed as variable fields, mesh, boundary conditions, numerical operators, etc., which offers a number of advantages as follows: 1. The governing transport equation can be written in a form that looks equivalent to the original mathematical formulation by defining the numerical operators as classes. As an example the energy equation, eq. 2.4, in the case of zero velocity d(ρC p T ) dt
= ∇.(K∇T ) + Qlaser − ρL f dγ dt ,
can be easily implemented as, fvScalarMatrix TEqn ( fvm::ddt(rhoCp, T) -
2.6 Numerical solver
19
fvm::laplacian (fvc::interpolate (K), T) + rhoLf*fvc::ddt(gamma) ); solve (TEqn == Qlaser); The above example on writing the energy equation shows that the main ingredients are the fields, T, rhoCp, K, rhoLf, gamma, Qlaser, and the numerical operators, such as fvm::ddt, fvm::laplacian, fvc::interpolate, and fvc::ddt, apply on the fields regardless of the type of mesh and the mesh resolution being considered. The operator fvm and fvc represent the differential operators of finite volume method and finite volume calculus, respectively. 2. The code can easily deal with different types of meshes, such as structured or unstructured, polyhedral, orthogonal or non-orthogonal. 3. The open-source nature of the code and the hierarchical structure of the classes, creates wide opportunities to expand its functionality and capability according to the user’s or the programmer’s interest. 4. Inheritance of classes gives much flexibility in extending the codes and classes.
Working with the main classes in OpenFOAM To explain how the object oriented programming in OpenFOAM works, the GeometricField class is presented and described in terms of its structure and interaction with other classes. The graphical representation of this class is shown in Fig. 2.7. In Fig. 2.7, a box represents a class, a solid arrow stands for public inheritance and a dashed arrow indicates usage, with the edge of the arrow labelled with the variable responsible for the relationship. GeometricField has a boundaryField which is a Field. As hinted above, GeometricField could represent any tensor field; it consists of an internalField and a boundaryField. The internalField belongs to Field class and stores a list of values for each computational point, and the GeometricBoundaryField stores boundary values for each boundary surface patchField. Reference to dimensions is stored in the dimensionSet that basically is the vector of the exponents for fundamental units. It could include 5 [kg, m, s, K, mol] or 7 [kg, m, s, K, mol, A, cd] elements.
20
Numerical methods
Fig. 2.7 Graphical representation, known as Unified Modelling Language (UML), diagram for GeometricField class. Finite volume method (FVM) In this thesis, eqns. 2.4, 2.7 and 2.8 are solved numerically using the Finite Volume Method (FVM). In this method, the conservation equations are integrated over a finite number of computational cells and the conservation equations are in the integral form. The conservation equations can be rewritten in a general form as follows [105, 106],
∂ (ρCφ φ ) = ∇.(Γφ ∇φ ) + Sφ . ∂t
(2.27)
Here, φ is the generic variable, Γφ is the diffusivity associated with the generic variable, and Sφ is the source term. It is worth to mention that the generic variable φ represents the temperature field T, and Γφ is the thermal conductivity. After integrating eq. 2.27 over the volume of the cell, the Gauss-Ostrogradsky’s theorem can be used for the diffusion term, i.e. the first term on the right hand side of eq. 2.27,
Z
Z
∇. f dV = V
S
f .ns dS.
(2.28)
Here, V is the cell volume, S is the area vector, ns is the surface normal vector, and f is the face. A Cartesian orthogonal structured grid and the associated control volume as shown in Fig. 2.8 is used in this thesis. For this control volume eq. 2.28 can then be rearranged as follows [105, 106],
21
2.6 Numerical solver
Fig. 2.8 Control volume for a 3-D Cartesian orthogonal structured grid [105].
Z
Z
∇. f dV = V
Se
fe dS −
Z Sw
Z
fw dS +
St
ft dS −
Z
Z
Sb
fb dS +
Sn
fn dS −
Z Ss
fs dS.
(2.29)
Here, e, w, t, b, n, and s represent the faces at the east, west, top, bottom, north and south, respectively. The integral form of eq. 2.27 over the control volume V around the point P can then be written as [105–107],
Z t+∆t � Z d t
dt
V
� Z ρCφ φ dV dt =
t
t+∆t
�
� Z ∑ Γ f S f .(∇φ ) f dt +
t
f
t+∆t
�Z V
� Sφ dV dt.
(2.30)
Here, S f is the face area vector.
Spatial discretisation of the diffusive fluxes R
The diffusion term, in eq. 2.30, can be rewritten as S Γφ ∇φ .ns dS, where ns is the surface normal vector pointing outward. The integrand of the diffusion term is evaluated at the control volume surfaces, not at the control volume centres. Therefore, the cell face values and their gradients need to be known. Since all dependent variables are stored at the cell centres, it is required to express the cell face value in terms of the cell centre values.
22
Numerical methods
In the case of orthogonal meshes, used in this thesis, the diffusion term can be estimated as [106], S f .(∇φ ) f = |S f |
φN − φP , |d|
(2.31)
where, d is the length vector between the centre of the cell of interest and the centre of a neighbouring cell, and φN and φP are the variables at the centre of the neighbouring cell and cell of interest, respectively. Time integration scheme The unsteady term, in eq. 2.27, can be discretised using either an implicit or an explicit method. In this thesis, the implicit scheme is employed, as it is unconditionally stable. The unsteady term can be discretised using the first order implicit Euler method as follows [106],
d dt
Z
ρφ dV = V
(ρP φPV )nt − (ρP φPV )0 . ∆t
(2.32)
Here, nt denotes the index for the time step. Discretisation of the volume sources The integral form of the volume sources is calculated using the product of the mean value and the volume of the cell. The mean value is approximated as the value at the cell centre and hence can be written as [106],
Z
Sφ dV = Sφ ∆V ≈ Sφ ,P ∆V.
(2.33)
∆V
Here, Sφ is the source term, Sφ is the mean value, and Sφ ,P is the value at the cell centre. Linear solvers Eq. 2.27, can be finally written as an algebraic equation for each nodal point P using the finite volume discretisation techniques as follows [105–107]:
aP φP + ∑ anb φnb = b, nb
(2.34)
23
2.6 Numerical solver or in a matrix form as, A.Φ = B.
(2.35)
Here, A is a sparse matrix with diagonal coefficients aP and off-diagonal coefficients anb , Φ is the solution vector, nb denotes the neighbour point, and B is the array of the source term b. The solution of eq. 2.35 is obtained in an iterative process. This method starts with an initial guess, and then consecutively updates the current solution until a convergence criteria is met ( i.e. the difference between solutions at two consecutive iterations fall below a prescribed tolerance). A number of iterations techniques have been developed to achieve the final solution with a high rate of convergence. In this thesis, the Preconditioned Conjugate Gradient (PCG) with Diagonal Incomplete-Cholesky (DIC) preconditioner for symmetric matrices have been employed to solve eq. 2.35 iteratively [93, 108],
2.6.2
Implementation
Laser annealing The mathematical models described in section 2.3 are solved by using the finite volume method in OpenFOAM. The numerical model is developed inheriting the base classes of OpenFOAM. The temperature dependent physical properties of semiconductor are used into the solver by connecting a library, referred to as swak4Foam [109]. Also, the convectiveradiative boundary condition, and the spatial and temporal functions of the heat source are calculated using this library. Coupling condition, boundary conditions for multilayer structure Heat transfer modelling in multilayer structure is a multiregion multi-physics problem, as it is inherently-coupled physics on disparate continua, e.g. fluid, solid, different solids. Two different approaches are available to solve multiregion problems [110]: 1. Partitioned : Separate governing equations are solved within each layer. The equations are then coupled at the interface. 2. Monolithic : Governing equations are described in terms of primitive variables and then a single matrix equation is solved for the entire domain. In this thesis, the partitioned approach was used for modelling the multiregion problem, which is more robust and accurate [110]. The method is briefly described here.
24
Numerical methods
In this method, each region is solved separately on its corresponding meshes and the coupling between different regions are ensured at the boundaries using Flux Forward, Temperature Back (FFTB) method [110]. As the heat flux and the temperature at the interface of the two regions must be conserved, an inner iterative loop is adopted. In this process, the heat flux calculated in the first region is prescribed as the boundary heat flux at the common interface of the second region (flux forward). The temperature distributions of the second region can then be calculated based on this Neumann boundary condition, and the temperature profile at the common interface obtained is prescribed back to the first region as a Dirichlet boundary condition (temperature back). This loop is repeated till the temperature and heat flux differences at the two region common interface are below the desired numerical error. Finally, the physical time step is incremented when the convergence is reached.
Melting and solidification Obtaining the temperature field usually requires an iterative process between eq. 2.4 and 2.5, which is referred to as the temperature based update method [111]. One of the major problems of this approach is that the numerical solution is prone to instability in the form of oscillations. This is due to an extreme sensitivity of the phase fraction to small changes in temperature, which may lead to mutually inconsistent γ and T fields [111]. To overcome these problems, we updated the liquid fraction based on the enthalpy in an iterative manner. Our developed method is similar to the method presented by Voller [98] and Shy et al. [111]. The solution algorithm can be described as follows: 1. The iterative process is started by setting γ 0 = γ old where "old" denotes the old time step; 2. Equation 5.3 is solved to obtain the temperature field T m+1 where m is the iteration level; 3. The liquid fraction γ m+1 is calculated based on the enthalpy field as,
γ
m+1
hm+1 = ρC p T m+1 ,
(2.36)
� hm+1 − Hs =γ + , Hl − Hs
(2.37)
m
�
25
2.6 Numerical solver
Hs = ρC ps TM ,
and Hl = ρC pl TM + ρL f ,
(2.38)
here, Hs is the solidus enthalpy, Hl is the liquidus enthalpy, C ps is the solidus specific heat, and C pl is the liquidus specific heat. 4. The steps (2)-(3) are continued until convergence is reached. The following criteria are applied to every node at each step of this procedure γ m+1 = 0,
if γ m+1 < 0
γ m+1 = 1,
if γ m+1 > 1.
and
(2.39)
The flow chart of the implemented implicit enthalpy method in OpenFOAM is presented in Fig. 2.9.
Fig. 2.9 Flow chart of the implicit enthalpy method implemented in OpenFOAM.
26
Numerical methods
2.7
Numerical test cases
The distributed OpenFOAM package comes with a limited capability. We extended the basic OpenFOAM package to include various models for simulating the physical phenomena during laser processing of photovoltaic solar cells. This section deals with the numerical test cases used for validation of the developed models within the OpenFOAM solver. The test cases are selected such that they are relevant to the physical phenomena dealt within this thesis and not yet included in the released OpenFOAM package. The aspects considered in this section are: 1. Laser annealing (a) Laser heating of a slab with continuous wave laser (b) Laser heating with pulsed laser (c) Laser heating of a slab with optical penetration 2. Melting and solidification (a) Conduction controlled phase change (b) Pulsed laser induced melting and solidification of silicon
2.7.1
Laser annealing
In this section, we considered the test cases of laser annealing of a work piece with different irradiation conditions. The governing equation, eq. 3.2, is solved with different form of the source term, Qlaser , for considering the different irradiation conditions. The numerical results are then compared with the corresponding analytical results. Laser heating of a slab For setting up the problem, we have considered a constant laser irradiation, Q, is incident on the front surface of the slab. When laser radiation irradiates on the surface of a slab, part of the energy will be absorbed by the slab, and the remaining part will be reflected and transmitted. The passage of laser radiation within the slab is assumed to be not accompanied by non-linear absorption, as that can change the dynamics of laser propagation and characteristics of the medium as well [112, 113]. In this section, it is assumed that the diameter of the laser beam is large compared to the thickness of the slab. Figure 2.10 shows the schematic and boundary conditions of the problem. The heat transfer equation, eq. 2.6, considering different
27
2.7 Numerical test cases
irradiation condition is solved for the cases of optical surface absorption, optical penetration and pulsed laser. In the cases of optical surface absorption and pulsed laser heating, the heat source is considered as surface heating, i.e. Qlaser = 0 in eq. 2.6.
Fig. 2.10 Schematic of the laser heating of a slab. The x coordinate is shown only to improve clarity. The simulated problem is one dimensional.
(a) Laser heating with optical surface absorption In this case, a semi-infinite slab is considered. As can be seen in Fig. 2.10, a constant laser irradiance, Q0 , incident in the y-direction of the slab. The initial and boundary conditions for the problem can be expressed as, T (y, 0) = T0 ,
−K
∂T = Q0 Aopt ∂y
at
y = 0,
∂T =0 ∂y
at
y = H.
−K
(2.40)
and
(2.41)
(2.42)
28
Numerical methods
Here, Aopt is the optical surface absorption, and H is the depth of the slab. In the case of temperature dependent absorption, the optical absorption is considered to be a linear function of temperature as follows, Aopt = A0 + A(T ).
(2.43) dA
Here, A0 is the value of absorption at room temperature, and A(T ) is the slope dTopt of the linear relation. The above stated problem can be solved using the analytical methods provided by [112, 114, 115] for constant thermophysical properties. To compare with the analytical solution, the numerical solution has been performed using the constant thermophysical properties as shown in Table 2.1. The grid spacing was taken as 0.5 µm in the x direction, and the time step was taken as 1 ns. Table 2.1 Thermophysical properties of silicon used for validating with the analytical solutions [112, 114, 115]. ρ
K
Cp
TM
(kg/m3 )
W/mK
J/KgK
(K)
2328
150
700
1683
Figure 2.11a shows a comparison of the numerical and analytical surface temperature profiles as a function of time for the laser irradiance of Q0 = 1011 W/m2 in the case of constant optical surface absorption. Figure 2.11b shows a comparison of the numerical and analytical temperature profiles within the depth of the slab at times of t = 1 µs, 2 µs and 3 µs, for the same laser irradiation and constant optical surface absorption. As can be seen, an excellent agreement is observed between the numerical solutions and analytical results. Figure 2.12 shows a comparison of the numerical and analytical results for the case in the optical surface absorption is a function of temperature. Once again, an excellent agreement is observed.
29
2.7 Numerical test cases
(a) Temperature as a function of time
(b) Temperature along the depth
Fig. 2.11 Comparison of the numerical and analytical temperature profiles (a) at the surface of the slab as a function of time and (b) within the depth of the slab at t = 1 µs, 2 µs and 3 µs, for the laser irradiation of Q0 = 1011 W/m2 and the constant optical surface absorption of Aopt = 0.056 [112].
30
Numerical methods
(a) Temperature as a function of time
(b) Temperature along the depth
Fig. 2.12 Comparison of the numerical and analytical temperature profiles (a) at the surface of the slab as a function of time and (b) within the depth of the slab at t = 1 µs, 2 µs and 3 µs, for the laser irradiation of Q0 = 1011 W/m2 and the optical surface absorption of Aopt = 0.056 + 3×10⁻⁵ T [112].
31
2.7 Numerical test cases (b) Laser heating with pulsed laser irradiation
For this test case, we consider the laser irradiation at the front surface of the slab to be a function of time, (i.e. pulsed laser irradiation). The pulse shape for laser irradiation presented by El-Adawi et al. [114] and Ready [116] is used here, � Q(t)/Qmax =
td − t td − t0
�m p � � t , t0
(2.44)
where, Qmax is the maximum power density of the laser pulse, td is the pulse duration, t0 is the time at which Q = Qmax , and m p defines its general shape. Figure 2.13 shows the pulsed shape used for laser heating of the slab, for which the pulse characterising parameters of m p = 3, td = 45 µs and t0 = 10 µs are used.
Fig. 2.13 Pulse shape used for laser heating of a slab, considering the laser characterising parameters of m p = 3, td = 45 µs and t0 = 10 µs [114, 116]. For setting up the problem, we have considered the same initial and boundary conditions as the first test case (eqns. 2.40-2.42) except for the irradiation condition which is considered to be time dependent, Q(t). Also, it is assumed that the optical absorption is not temperature dependent. An exact solution for the temperature field, T(y,t), within the slab can obtained using the Laplace integral transformation method proposed by El-Adawi et al. [114]. It is worth mentioning that the analytical solution is only valid for the constant thermophysical properties. The numerical solution has been performed considering the similar grid spacing and time steps, and constant thermophysical properties as mentioned in the previous section. Figure 2.14 show a comparison of the numerical and analytical temperature profiles within the depth of the slab at t = 3.9 µs and as a function of time at the front surface of the
32
Numerical methods
slab for the laser power density of Qmax = 0.5×10¹¹ W/m2 , respectively [114]. As can be seen, there is an excellent agreement between the numerical and analytical results.
(a) Temperature along the depth
(b) Temperature as a function of time
Fig. 2.14 Comparison of the numerical and analytical temperature profiles (a) within the depth of the slab at t = 3.9 µs and (b) at the front surface of the slab as a function of time, for Qmax = 0.5×10¹¹ W/m2 and Aopt = 0.678 [114].
33
2.7 Numerical test cases (c) Laser heating of a slab with optical penetration
In laser processing of semiconductors, such as silicon, 95 percent of the laser energy is absorbed within a depth of 3/α for a small laser beam [117, 118]. The absorption depth of laser energy within the slab increases with an increase of the laser beam wavelength, which causes deposition of energy to occur over a greater thickness of the slab. Thus, it is necessary to consider the heat source as a volume heat source for a large laser beam wavelength. For this test case, we consider a spatially decaying laser source, i.e. Q(y). For setting up the problem, we assume that the laser irradiation is incident on the front surface of the slab, as shown in Fig. 2.10, which is absorbed partially in the surface layers followed by an exponential decay as the distance from the top surface increases. Therefore, the energy source term in eq. 2.6 can be modelled as, Q = Q0 α(1 − R)e−αy .
(2.45)
Here, Q0 is the radiation intensity at the surface, and R is the surface reflectance. The initial and boundary conditions are considered as, T (y, 0) = T0 ,
(2.46)
� � ∂T −K = hconv T∞ − T at y = 0, ∂y
(2.47)
−K
∂T =0 ∂y
at
y = ∞.
(2.48)
An exact solution for the temperature and heat flux distributions in a semi-infinite solid for this problem is obtained using the method proposed by Zubair and Chaudhry [117, 118]. It is worth mentioning that the analytical solution is valid for the constant thermophysical, and optical properties. Hence, the constant thermophysical and optical properties of silicon, as shown in Table 2.1, are used. The numerical parameters, such as grid spacing and time step, also taken as similar to the previous section. Figure 2.15 shows a comparison of the numerical and analytical temperature profiles as a function of time at x = 0 µm, 1 µm and 2 µm for α = 7.85×10⁵ 1/m. As can be seen, there is an excellent agreement between the numerical and analytical results.
34
Numerical methods
Fig. 2.15 Comparison of the numerical and analytical temperature profiles as a function of time at x = 0 µm, 1 µm and 2 µm for α = 7.85×10⁵ 1/m.
2.7.2
Melting and solidification
In this section, we have considered the test cases of melting and solidification to validate the solver. The governing equations (eqns. 2.4 and 2.5) are solved for different boundary conditions, and the predicted results are then compared with the corresponding published numerical and experimental results. (a) Conduction controlled phase change problem In order to validate the numerical solver, simulations of cases available in the literature for a conduction controlled phase change problem is undertaken. The problem concerns the isothermal solidification of a liquid in an impermeable and rigid box. The box has a initial temperature of Tinit = 1535 ◦ C. The temperature at walls set to Twall = 1150 ◦ C, which is lower than the melting temperature of TM = 1500 ◦ C. Figure 2.16 shows a schematic of the problem along with the boundary conditions. The thermophysical properties are assumed to be same and constant in both the solid and liquid phases, ρ = 7200 Kg/m3 , C p = 750 J/KgK, K = 30 W/mK and L f = 262.5 KJ/KgK. Due to symmetry of the problem, only one quarter of the box is considered. The grid spacing was 9.5×10⁻³ m in the x and y directions, and the time step was 250 s. Figure 2.17 shows a comparison between the numerical results with those presented by Voller et al. [119]. The overall agreement between these results verifies the accuracy of the numerical model.
35
2.7 Numerical test cases
Fig. 2.16 Schematic of the diffusion controlled phase change problem.
(a) Temperature profile at the centre of the domain
(b) Progress of solidification with time
Fig. 2.17 Comparison of the present numerical and the results presented by Voller et al. [119] for (a) temperature history at the centre of the domain, and (b) progress of solidification with time.
36
Numerical methods
(b) Pulsed laser induced melting and solidification of silicon In this section, the numerical model is validated with the experimental results presented by Unamuno et al. [120] and Aziz et al. [121] for nanosecond pulsed laser induced melting and solidification of silicon. In the experiments, the melting depth in crystalline silicon was determined by the observations of removal of the dislocation loops 1 created by the low dose ion-implantations. The observation of the removal of dislocation loops were performed using the transmission electron microscopy (TEM) images. In the experiment, first the dislocation loops were produced within a particular depth of the crystalline silicon, and after that the laser annealing was performed in order to melt and hence removal these dislocation loops. In order to produce the dislocation loops, distributed to a particular depth within the crystalline silicon, the controlled ion-implantation species, doses, and temperatures were used. The ion-implanted silicon was then annealed with the laser pulse, wavelength of 308 nm. The temporal shape of the laser pulse was Gaussian with FWHM of 30 ns, and had an uniform beam intensity over a 3×3 cm2 area. The micro-structural changes, due to laser induced melting, were studied by the cross section TEM micrograph in a Philips EM-400 electron microscope. In this case, removal of the dislocation loops was used as evidence of melting, and the depth at which the dislocation loops were removed from the crystalline silicon was used as a marker for determining the melting depth. To compare with the experimental results, simulations have been carried out for λ = 308 nm, and FWHM of 30 ns. In setting up the problem, it is considered that the laser incidents normal to the surface. Since the laser power density is constant over the surface, the problem can be considered as one dimensions. The initial and boundary conditions of the problem are taken as [49, 116],
1 Ion-implantation
T (y, 0) = T0 ,
(2.49)
dT −K = 0, dy y=0
(2.50)
T (d,t) = T0 .
(2.51)
is the process of introducing dopants into the silicon. When impurities are intentionally added to the silicon they are referred as dopants. It is worth noting that the dopants are added into the silicon to improve its conductivity. When the dopant atoms are directed into the silicon surface, the silicon atoms are often displaced. This results in an breakage of the crystallographic structure of the silicon materials, which referred as the dislocation [122, 123].
2.8 Concluding remarks
37
Here, T0 is the initial temperature, and d is the depth. The temperature dependent thermophysical and optical properties of silicon were taken from the published experimental results [49, 100, 120, 124–127], and are summarised in Appendix A. The spatial grid spacing was dy = 1.5 × 10⁻⁴ µm, and the time step was dt = 0.01 ns. Figure 2.18 shows a comparison between the numerical and experimental results for the melting depth as a function of laser energy density for λ = 308 nm and FWHM = 30 ns. As can be seen, there is an excellent agreement between the numerical and experimental results.
Fig. 2.18 Comparison of the numerical and the experimental results presented by Unamuno et al. [120] and Aziz et al.[121] for the melting depth as a function of laser energy density, for λ = 308 nm and FWHM = 30 ns.
2.8
Concluding remarks
In this chapter, the governing equations for investigating the laser induced heat transfer phenomena were presented. The details of the numerical model and its solution procedures developed in OpenFOAM were also discussed. Finally, validation of the developed OpenFOAM code were discussed concluding that the developed OpenFOAM code performs well and is sufficiently validated against a number of generic test cases related to the simulation of laser-semiconductor interaction.
Chapter 3 Laser annealing and its effect on the hydrogenation of silicon wafers 3.1
Introduction
This chapter presents a numerical study of laser annealing to effect hydrogen passivation of silicon wafers. The effectiveness of hydrogen to passivate various types of defects and impurities within silicon wafers, and hence improve performance of solar cells is well known [59, 128, 129]. Thermal processing treatments of wafers are used to play important roles in hydrogen passivation, facilitating the initial release of hydrogen from a dielectric layer, its diffusion through the wafer, and enhancing defect passivation reactions. While these processes can be achieved using conventional belt furnaces or rapid thermal processing (RTP), lasers have several advantages. These include allowing a high throughput, low energy requirement process, avoiding activation of certain defect types as a result of long exposure times, increasing the rate of Boron-Oxygen (B-O) defect passivation by several mechanisms, increasing hydrogen mobility by manipulating its charge state, and finally allowing localised processing to different regions of the wafer having differing defect profiles. Fundamental to optimising laser-induced hydrogenation passivation is knowledge of how to choose the ideal laser parameters to achieve desired temperature fields inside the wafer, and thus control the effectiveness of hydrogenation. Experimental measurements of these temperature fields would be very difficult and unwieldy to use as an optimisation tool. This chapter therefore explores a numerical approach, setting out to answer two key questions. First, what parameters are required to achieve similar temperatures and exposure time as experienced during conventional RTP? Second, how should the laser parameters be controlled to achieve effective passivation?
40
Laser annealing and its effect on the hydrogenation of silicon wafers
The structure of this chapter is as follows. Relevant literature is first reviewed in section 3.2. The numerical problem description and approach are subsequently outlined in section 3.4. Validation of the methodology against a relevant experimental data set is reported in section 3.5. The method is applied to the laser-annealing problem and results are discussed in section 3.6 before drawing conclusions in section 3.7.
3.2
Literature review and objectives
One of the key challenges to fabricate high efficiency solar cells on low-cost silicon materials, such as multi-crystalline silicon and silicon ribbons [65, 130], is to passivate defects and impurities [76, 131–133]. Crystalline silicon wafers, when fabricated by a variety of methods such as Czochralski (Cz), cast, ribbon etc. [134], can contain a variety of defects and impurities [59]. These defects and impurities act as recombination sites, which reduces minority carrier lifetimes, and consequently affect conversion efficiency of the silicon solar cells [43, 51–58]. To passivate these defects and impurities and hence improve performance, hydrogen is often introduced into the wafer [56, 60–66]. It has been extensively reported that the hydrogen can effectively passivate both the surface and the bulk regions by forming bonds with the various types of defects, such as dislocations, grain boundaries, boron-oxygen (B-O) defects, and impurities [54, 67, 71, 72, 129, 135–144]. To provide a source of hydrogen, typically, a thin layer of silicon nitride (SiNx:H), deposited on the silicon substrate as an anti-reflection coating (ARC), is employed [128]. During the plasma enhanced chemical vapor deposition (PECVD) process, Hydrogen is incorporated into the SiNx layer during the plasma enhanced chemical vapour deposition (PECVD) process, and is initially bonded to the silicon and nitrogen atoms [128]. Thermal treatments are conducted firstly to release hydrogen from SiNx:H layer [69, 70], secondly to promote diffusion into the silicon substrate [68–70], and thirdly to enhance the reaction rates of hydrogen passivation [52, 68–70, 145]. Thermal treatments are therefore key to providing rapid and effective passivation. Thermal treatments to enhance hydrogen release, diffusion, and passivation reactions can be provided using conventional approaches such as via belt furnaces and rapid thermal processing (RTP) [52, 68–70, 145, 146]. In these conventional approaches, the whole wafer is heated and exposed to high temperature with exposure times in the range of few minutes to several hours [147]. An alternative approach to thermal processing, explored here, is the use of a laser. As a source of heat and illumination, lasers have been demonstrated experimentally to provide effective hydrogen passivation [16–22]. Relative to the conventional approaches, laser processing has several potential advantages:
3.2 Literature review and objectives
41
1. As heat application is localised to the region where it is required, it potentially improves the overall energy budget of the process [148]. 2. Implemented in a high throughput process it can potentially reduce processing times [149]. 3. By allowing relatively low exposure times to high temperatures and enabling high cooling rates it can prevent the formation of certain types of defects such as those associated with release of impurities from precipitate sites [66, 150–152]. 4. Carrier injection resulting from laser illumination increases rate of Boron-Oxygen (B-O) defect formation (which would otherwise form in the field), enabling passivation of those defects [153]. 5. Carrier injection can also manipulate charge state of hydrogen, enabling more rapid diffusion and increased rates of reaction particularly with positively charged defects [154, 155]. 6. Lasers potentially enable localised processing, for example to apply passivation to a surface region, or to apply different passivation regimes to different parts of a wafer that suffer from different types of defects [21, 22, 156]. Among the above-mentioned advantages, the most important to the present thesis is the passivation of the B-O defect. Unless passivated, this defect arises in the field as a result of exposure to illumination. It causes a relative performance penalty of approximately 10%, and is therefore quite significant. Traditional methods of hydrogen passivation have been shown to be insufficiently effective to neutralise this defect, especially for low-cost materials such as upgraded metallurgical grade (UMG) silicon. Recent studies have demonstrated enhanced effectiveness of passivation via laser-based methods [153–155]. This is thought to result from two key factors. First, via minority carrier injection, illumination can be used to control the charge state of hydrogen [154, 155] and greatly increase its mobility and reactivity. In understanding the second factor it is important to note that the defects require formation prior to being passivated. Recent kinetic modelling [153] suggests that rate-limiting process for hydrogen passivation is in fact the formation of the defects rather than their passivation, and that illumination is in part effective by increasing the rate of defect formation. As discussed by Hallam et al. [153], the reaction rates controlling defect formation, dissociation, passivation, and destabilisation are all temperature-dependent. As such, both equilibrium passivation levels as well as net rates of passivation therefore vary with temperature such that temperature control is particularly critical.
42
Laser annealing and its effect on the hydrogenation of silicon wafers
The thermal treatment induced by a laser, and thus the effectiveness of passivation, is obviously controlled by the laser parameters such as the laser power, scanning speed, and spot size, as well as wafer substrate temperature, its thickness, etc. Among other variables of interest, these parameters control the surface temperature, annealing time, heating and cooling rate, and significantly affect the passivation process by affecting the diffusion and retention of hydrogen at defect sites in silicon, particularly in the case of the temperature-dependent B-O defect system as noted above. Also, laser annealing can potentially generate thermally induced mechanical stress, and crack damage within the silicon substrate [157, 158]. This in turn can affect the performance of the hydrogen passivation process, and hence limit the conversion efficiency of the solar cells, counteracting the passivation effect. However, to the best of the author’s knowledge, a strong understanding of how the laser processing parameters affect the resulting thermal treatment in the context of hydrogen passivation is currently absent from the literature. Key to this understanding is knowledge of the resulting spatial and temporal variations of the temperature fields inside the wafer. Experimentally determining these fields would be exceedingly difficult and very cumbersome as an optimisation tool. While many experiments have been carried out to understand the final results in terms of the achieved passivation [16–21, 21, 22, 72, 141, 159], it is challenging to identify the root cause of the success or failure of the passivation with different laser processing parameters and this severely limits attempts to optimise the process. This motivates the numerical approach adopted here. Several numerical studies of laser processing with various semiconductor materials to achieve various outcomes have been reported, as noted in the Introduction. Most relevant to the present chapter are previous studies of the removal of crystallographic defects and activation of dopants in solid phase crystallised silicon [160], solid phase crystallisation of the cadmium telluride (CdTe) [35], firing contacts of the silicon wafers [161] etc. These studies demonstrate the power of numerical simulations of heat transfer phenomena to provide important information to optimise those processes. However, none of these previous studies considered the particular situation of laser-induced hydrogen passivation, the focus of the present work.
3.3
Objectives
Conventional thermal processing methods using belt furnaces or RTP achieve the key roles of hydrogen release, hydrogen diffusion, and passivation of certain types of defects, notably crystallographic defects, e.g. at grain boundaries in multi-crystalline silicon. In approaching the laser hydrogenation problem, a reasonable starting point is to determine the laser
3.4 Numerical procedures
43
parameters that may lead to a similar degree of hydrogen passivation by the above-mentioned mechanisms compared to using the belt furnace and RTP methods. This is therefore the first objective of this chapter. Laser power, beam diameter, scanning speed and substrate initial temperature are investigated as parameters. The results are assessed in terms of obtaining the optimal temperature along with a similar value of annealing time and cooling rate compared to using the belt furnace and RTP methods for passivation of the crystallographic [64, 68, 69, 146, 162, 163] and B-O defects [144, 164]. Results are further discussed in terms of maximum temperature, spatial structure of the temperature fields, and thermal stress. The second objective is to demonstrate the ability of the methodology to contribute information on B-O defect passivation. As earlier noted, conventional approaches do not effectively passivate the B-O defect because this first requires defect formation, which can only be achieved at a reasonable rate via carrier injection. In addition, the conventional processes suffer from long cooling times, which may result in reactivation of impurities. B-O defect passivation requires somewhat different parameters (temperature, exposure time) to those required for the hydrogen release and crystallographic passivation discussed above, so the required parameters are first determined. Following this, in collaboration with Dr Brett Hallam, the temperature distributions are coupled with equilibrium calculations of defect concentrations using the reaction rates and model for defect formation and passivation proposed by Dr Hallam [153]. The laser parameters are selected to result in temperature distributions that suggest examples of both ineffective and effective passivation.
3.4
Numerical procedures
To set some fixed parameters, this study considers similar operating conditions used in a set of previously reported laser-induced passivation experiments [21]. The laser systems and the physical dimensions of the silicon wafer and SiNx:H layer are the same as Song et al. [21]. A continuous wave (CW) diode laser with the wavelength of 808 nm is considered. The laser beam is formed into a narrow strip, and this strip is scanned across the wafer, which is placed on top of a 20 mm thick (Hsteel ) steel plate. The energy distribution is approximately uniform in the longer dimension, which is perpendicular to the moving direction and has length of 12 mm. In the narrow direction, i.e. in the moving direction, the energy distribution is Gaussian full width at half maximum of 170 µm [165]. The dimensions of the silicon wafer considered are: length (L) of 41.7 mm, width (W ) of 41.7 mm and depth (Hsi ) of 150 µm [21]. The thickness (dc ) and refractive index (nc ) of the SiNx:H layer are taken as 75 nm
44
Laser annealing and its effect on the hydrogenation of silicon wafers
and 2 respectively [21]. The length and width of the steel plate are considered as similar to the silicon wafer. Due to the high aspect ratio of the laser beam, it is approximated in this study as infinitely long, enabling the problem to be simulated and analysed in two dimensions instead of three. A diagram showing the laser annealing process is given in Fig. 3.1. To obtain the temperature field induced by the laser irradiation, the transient heat conduction equation governs heat flow in the structure is solved [94],
d(ρiC pi Ti ) = ∇.(Ki ∇Ti ) + Qlaseri , dt
(3.1)
here, i is the layer, ρi is the density, C pi is the specific heat, Ki is the thermal conductivity, and Qlaseri is the heat source due to the absorbed laser power of layer i, which is calculated using the method mentioned in section 2.3. It is worth noting that the layer i represents the silicon wafer and the steel plate. To account for a moving heat source a coordinate systems moving with the laser beam is employed as shown in Fig. 3.1, which leads to an extra term in the energy equation as follows [94],
d(ρiC pi Ti ) d(ρiC pi T ) = ∇.(Ki ∇Ti ) + v + Qlaseri , dt dx
(3.2)
here, v is the scanning speed. The temporal part of the energy equation, eq. 3.2, is discretised using the Euler implicit scheme whereas a second-order accurate central difference scheme is used for the spatial terms [93]. The partitioned method, as mentioned in section 2.6.2, is adopted to solve the problem. The grid spacing was 2.5 µm in the y direction, 2.5 µm in the x direction, and the time-step was 1 µs. In this chapter, the simulations were run until a steady state was achieved. The steady-state condition was judged by the temperature change with time, for example the steady condition is reached when the temperature change with time becomes zero. The laser annealing is performed under the normal condition, i.e. the vacuum condition 1 is not used, heat losses due to convection and radiation at the top and sides of the structure are assumed. Since the wafer is thin and it may come in contact with the steel plate, heat loss takes place as a result of thermal conductance and radiation between the wafer and the steel plate. Since the steel plate is much thicker than the wafer and may be considered to act as an 1 Here,
the vacuum condition is defined as an environment where the air has been removed from the space using a vacuum pump.
45
3.4 Numerical procedures
heat sink the Dirichlet boundary condition is assumed at the bottom of the plate. The initial and boundary conditions for the problem therefore may be written as,
Ti (x, y, 0) = T0 ,
−Ki
−Ki
−Ki
∂ Ti = hconv (Ti − T∞ ) + σ εi (Ti4 − T∞4 ), ∂y
(3.3)
Y = 0,
∂ Ti+1 ∂ Ti 4 = −Ki+1 = h j (Ti − Ti+1 ) + σ εe f (Ti4 − Ti+1 ), ∂y ∂y
∂ Ti = hconv (Ti − T∞ ) + σ εi (Ti4 − T∞4 ), ∂x
Ti = T0 ,
X = +L/2
Y = Hsteel ,
(3.4)
Y = Hsi ,
(3.5)
and X = −L/2,
(3.6)
(3.7)
where i is the layer, T0 is the initial temperature, L is the length, Hsi is the depth of the wafer, Hsteel is the depth of the steel plate, hconv is the convective heat transfer coefficient, σ is the Stefan-Boltzmann constant, εe f is the effective emissivity [166], and h j is the thermal joint conductance; Ti , Ki , and εi are the temperature, thermal conductivity and emissivity of layer i, respectively. The thermal joint conductance of the interface formed by the silicon wafer and the steel plate depends on the contact conductance, hc , from the contact spots, and the gap conductance, hg , due to the fluid at the interstitial space. Therefore, the thermal joint conductance may be expressed as [167–171],
h j = hc + hg ,
(3.8)
where, hc is the contact conductance, and hg is the gap conductance. The contact conductance, hc , may be expressed as [167–171], hc = 1.25ks
mas Pcont 0.95 ( ) , σr Hc
(3.9)
where, ks is the harmonic mean thermal conductivity of the interface, mas is the effective mean absolute asperity slope, σr is the root mean-squared (RMS) surface roughness, Pcont is the contact pressure, and Hc is the micro-hardness. The non-dimensional contact pressure,
46 Pcont Hc ,
Laser annealing and its effect on the hydrogenation of silicon wafers in equation 3.9 is related to the RMS surface roughness, σr , as follows [167], Pcont 1 Ym ), = er f c( √ Hc 2 2σr
(3.10)
where, Ym is the mean physical separation between the silicon and steel surfaces. It is worth noting that, for most of the practical applications, the value of non-dimensional separation, Ym σr , varies as [172], Ym 2≤ ≤ 4.75. (3.11) σr The gap conductance, hg , due to the fluid, which is air in the present case, at the interstitial space between the silicon wafer and the steel plate may be expressed as follows [167, 168], hg =
kg , Ym + g
(3.12)
where, kg is the thermal conductivity of the air, and g is the gap constant. The effective emissivity may be calculated as follows [173], εe f =
1 1−εi εi
i+1 + 1−ε εi+1
.
(3.13)
The thermo-physical and optical properties used in the simulations are summarised in Fig. A.1, A.2, Table A.1 and A.2, in Appendix A. Since the surface properties for calculating thermal joint conductance were not known during the simulations, the silicon wafer is considered as polished, and the value of RMS surface roughness, σr , is taken as 0.8 µm, which is reasonable for most of the practical surfaces [168, 172, 174–176]. The remaining properties, and their corresponding values are summarised in Table A.3, in Appendix A. The numerical simulation has been performed using a variety of laser powers, scanning speeds, and initial substrate temperatures to obtain the optimal temperature range along with a similar value of annealing time and cooling rate compared to using the belt furnace and RTP methods for passivating of the crystallographic [64, 68, 69, 146, 162, 163] and B-O defects [144, 164]. Since the present chapter concerns about the thermal effect on the hydrogen passivation of silicon wafers, the temperature profiles of the steel plate are not presented here.
47
3.4 Numerical procedures
To obtain insight into the effect of laser induced thermal process on the passivation of the B-O defect complexes, the mathematical model used by Hallam et al. [144] and Herguth et al. [177] has been solved to calculate the population of passivated defects induced by the thermal process. The mathematical model is based on the three-state, four reaction model of B-O defect complex including rates of formation, passivation, dissociation and destabilisation [144, 177]. A diagrammatic description of the three-state system is shown in Fig. 3.2 [144]. Further details of this model may be found in [144]. The differential equations that describes this model may be written as follows [144, 177] δ NA = kBA .nB − kAB .nA , δt
(3.14)
δ NB = kAB .nA + kCB .nC − (kBA + kBC ).nB , δt
(3.15)
δ NC = kBC .nB − kCB .nC , δt
(3.16)
a − −E k T
ki j = vi j .e
b
,
(3.17)
here, NA , NB and NC are the defect state populations at the dissociated state, the formed defect complex state, and the passivated state respectively, and ki j is the rate constant from state i to j, where i and j denote the states being transitioned from and to respectively. The remaining symbols and their corresponding values are summarised in Table 3.1. A MATALB code was written to solve the differential equations, eqn. 3.14-3.17. In this case, the temperature fields simulated from the OpenFOAM were taken as input in the MATLAB code, and, after that, the population of defects in the passivated state were calculated based on these temperature fields.
48
Laser annealing and its effect on the hydrogenation of silicon wafers
(a) 3-D view
(b) 2-D section A-A
(c) Diode laser beam [165]
Fig. 3.1 Schematic of the CW laser annealing process, (a) 3-D view, (b) 2-D cross section employed in the calculations (A-A) and (c) diode laser beam [165].
49
3.4 Numerical procedures
Table 3.1 Activation energies (Ea ) and characteristic frequencies (vi j ) for transitions from state i to state j (Ti j ) in the B-O defect complex systems associated with CID degradation in the silicon wafers [144]. Process
Ti j
Ea
vi j
(eV)
(1/s)
Ref.
Defect-formation
TAB
0.475
4×10³
[144, 178]
Defect dissociation
TBA
1.32
1×10¹³
[144, 178]
Defect passivation
TBC
0.98
1.25×10¹⁰
[144, 179]
Destabilisation
TCB
1.25
1×10⁹
[144, 179]
50
Laser annealing and its effect on the hydrogenation of silicon wafers
Fig. 3.2 Diagrammatic representation of the three-state model for B-O defect complex system [144]. The first state (A) describes the silicon material after high temperature processing before the formation of the recombination-active defect complex. Hence state A is comprised of the dissociated defect constituents, which form the recombination-active defect complex under illumination. The second state (B) describes the material in the degraded state after the formation of the carrier-induced defect complex. This typically occurs after exposure to carrier injection at relatively low temperature. The third state (C) describes the silicon material once the recombination-active defects have been passivated, to form a recombination-active hydrogen defect complex. This is typically achieved after the injection of hydrogen into the silicon during fast firing and a subsequent hydrogenation process incorporating minority carrier injection. State C is stable with exposure to subsequent minority carrier injection.
51
3.5 Validation with the experimental results
3.5
Validation with the experimental results
Experimental results for temperatures in the target problem were not available, however validation was considered important. Therefore, the methodology was validated against a set of similar, but not identical, experimental cases provided by [180–183]. In these validation experiments, a CW laser beam of 514 nm wavelength, λ , was used to heat a silicon wafer, and Raman scattering was employed as a probe for lattice temperature measurement of the wafer. A 3-W Coherent-Radiation argon-ion laser was focused on to a 400 µm thick silicon wafer. At the focus of the laser beam, temperatures were obtained by analysing the Stokes to anti-Stokes ratios of the Raman peaks. The laser beam was incident normal to the surface, and the scattered light was collected by a double spectrometer. The detected photo counts from the spectrometer were then stored in a multi-channel analyser and transferred to a computer followed by corrections and data reduction. The laser beam used in the experiment had a Gaussian function of 5 µm diameter defined by the 1/e value of intensity. To compare with the experimental results, the numerical simulation has been performed using the Gaussian intensity distribution for the incident laser beam, which is aligned perpendicular to the wafer surface. The schematic of the problem is similar to the case as shown in Fig. 3.1a, except the energy distribution is Gaussian along both of the length and width of the wafer. Since the energy distribution is Gaussian in both of the directions, i.e. x and z directions, the problem is simulated in three dimensions instead of two. In addition, due to symmetry of the problem, half of the domain is considered for the simulations, and the symmetry boundary condition is employed. Since, the effect of both convective and radiative heat transfer from the surfaces are negligible, the initial and boundary conditions may be written as [180] T (x, y, z, 0) = T0 , (3.18)
−K
∂T = 0, ∂x −K
X = −L/2
∂T = 0, ∂y
Y =0
and X = +L/2,
(3.19)
and Y = H,
(3.20)
∂T = 0, Z = 0 and Z = +W /2. (3.21) ∂z The temperature field is calculated using the governing equation, eq. 3.1, and the initial and boundary conditions, eqns. 3.18-3.21, along with the similar numerical set up as mentioned in section 3.4 for a single structure. The grid spacing was 0.25 µm in the x, y and z directions, and the time step was 0.1 µs. The steady state condition was judged by the −K
52
Laser annealing and its effect on the hydrogenation of silicon wafers
similar procedure as mentioned in section 3.4. Figure 3.3 shows a comparison between the numerical and experimental results for the peak temperature as a function of the normalised laser power, i.e. incident power/beam radius. As can be seen, there is an excellent agreement between the numerical and experimental results.
Fig. 3.3 Comparison of the numerical and experimental results [180, 181] for the peak temperature as a function of the normalised incident laser power.
3.6 Results and discussion
3.6 3.6.1
53
Results and discussion Determining parameters based on RTP
Effect of laser power and scanning speed It is well known that using conventional belt furnace and RTP methods, the hydrogen passivation of silicon wafers becomes ineffective when temperature of the wafer exceeds an optimal temperature range [68, 184]. This optimal temperature range depends on the types of defect to be passivated. In the case of crystallographic defect passivation using conventional processes, this optimal temperature range has been reported within the range of 873 K to 1173 K [68, 184]. Higher temperatures would in principle be desirable to achieve more rapid hydrogen release and diffusion, however when temperature of the silicon wafer exceeds the optimal temperature range, the hydrogen can become unstable and evolved out of the silicon [68, 185], which eventually can affect the retention of hydrogen at defect sites in silicon [68]. Temperature control is therefore critical.
Fig. 3.4 Maximum spot temperature of the silicon wafer as a function of the laser power density for a range of scanning speeds, for FWHM = 170 µm. Figure 3.4 shows the maximum spot temperature of the wafer as a function of laser power density for a variety of scanning speeds, for FWHM of 170 µm. As can be seen, the optimal temperature, i.e. 873 K to 1173 K, for conducting hydrogen passivation can be achieved using a variety of laser power densities and scanning speeds. As expected, increasing laser power density or decreasing the scanning speed both lead to increasing
54
Laser annealing and its effect on the hydrogenation of silicon wafers
temperature. There are clearly trade-offs to consider here. High scanning speeds might be desirable from a throughput perspective but require higher laser powers. Excessively high laser power could result in damage to the dielectric layer or wafer surface [157], undesirable melting, etc. Conversely it may increase the rate of B-O defect formation, thus enabling more rapid passivation [186].
(a) Temperature on the surface
(b) Temperature within the depth
Fig. 3.5 (a) Temperature distributions on the surface, and (b) within the depth of the wafer (at the location directly underneath the laser) for the scanning speeds of 1 mm/s, 15 mm/s and 50 mm/s, at the laser power density of 5.74×10⁷ W/m2 and FWHM = 170 µm.
3.6 Results and discussion
55
The spatial distribution of temperature profiles on the surface and within the depth of the wafer are shown in Fig. 3.5, for the scanning speeds of 1 mm/s, 15 mm/s and 50 mm/s, for the fixed laser power density of 5.74×10⁷ W/m2 . As can be seen, in Fig. 3.5a, in front of the laser beam, i.e. x0. In this region, a wider temperature profile appears compared to that of the front side of the laser beam for the scanning speeds of 1 mm/s, 15 mm/s and 50 mm/s. On the contrary, similar trends in the decays of temperature profiles within the depth of the wafer are observed for the scanning speeds of 1 mm/s, 15 mm/s and 50 mm/s, which can be seen in Fig. 3.5b, although the temperature levels themselves are different. Figure 3.4 showed that different combinations of power and scanning speed could be used to obtain temperatures within the optimal range. However, the surface temperature is not the only parameter of interest. Temperatures throughout the wafer are also important, as is the exposure time and cooling rate. Therefore in the remainder of section, the power and scanning speed are adjusted together to maintain a fixed surface temperature around 1000 K, which is within the reported optimal range for conventional hydrogenation processes. For scanning speeds of 1 mm/s, 15 mm/s and 50 mm/s, the required laser power densities were determined to be 5.74×10⁷ W/m2 , 1.03×10⁸ W/m2 and 1.43×10⁸ W/m2 , respectively. To investigate the effect of scanning speed on the temperature distributions within the depth of the wafer, these distributions are presented in Fig. 3.6 for the above-mentioned cases at the location directly underneath the laser. As can be seen, in the case of 50 mm/s scanning speed, the temperature decays much more sharply within the depth of the wafer than in the cases of 1 mm/s and 15 mm/s scanning speeds. It particular, for the 50 mm/s case, the rear surface temperature is 720 K, below the optimal temperature range for crystallographic defect passivation. Obviously, higher scanning speeds would result in even lower temperatures, which would affect the passivation. On the contrary, in the cases of 1 mm/s and 15 mm/s speeds, the temperature throughout the wafer stays almost within the optimal range, suggesting good passivation can be achieved throughout the wafer. It is noted however that in some circumstances, it may be desirable to produce a temperature gradient within the material – for example more passivation may be needed at the front surface, while at the back surface it may be desired not to exceed temperature constraints imposed by metallisation. In this respect, higher scanning speeds could be used to create beneficial temperature gradients according to the particular cell manufacturing circumstances.
56
Laser annealing and its effect on the hydrogenation of silicon wafers
Fig. 3.6 Temperature distributions within the depth of the wafer for the cases where the wafer observes the same maximum spot temperature of 1000 K for the scanning speeds of 1 mm/s, 15 mm/s and 50 mm/s, and the laser power densities of 5.74×10⁷ W/m2 , 1.03×10⁸ W/m2 and 1.43×10⁸ W/m2 , respectively, and for the FWHM = 170 µm. Since diffusion of hydrogen in silicon shows a thermally activated behaviour 2 , the diffusion of hydrogen can be influenced by the annealing time along with the temperature [60, 145, 187]. In addition, the passivation of defects can be affected if sufficient time is not provided for the retention of hydrogen at defect sites in silicon [187]. Therefore, during the thermal treatment, it is necessary to balance hydrogen release, diffusion, and retention of hydrogen at defect sites in silicon at the same time [187]. It has been reported that the hydrogen passivation is negatively affected when the annealing time, i.e. the duration that temperature stays about 700 K or above 3 , is less than 1 s during the thermal processing [21, 67, 153, 188]. This suggests it is necessary to achieve the annealing time more than 1 s for conducting hydrogen passivation. To examine the annealing times with a fixed surface temperature of ∼1000 K, figure 3.7 shows the temperature profile at a fixed location on the wafer as a function of time for the scanning speeds of 1 mm/s, 15 mm/s and 50 mm/s, and the laser power densities of 5.74×10⁷ W/m2 , 1.03×10⁸ W/m2 and 1.43×10⁸ W/m2 , respectively. As can be seen in Fig. 3.7a, in the case of 1 mm/s scanning speed, the annealing time, i.e. the duration that temperature p hydrogen diffusion length within the silicon wafer can be expressed as, l f = 2 (Dt) [60, 145]. Here, t is the time, and D is the diffusivity. Diffusivity is a function of temperature and can be expressed as, D = D0 .exp(− EkTA ), where, k is the Stephen-Boltzmann constant, and D0 is a constant. 3 Here we referred the annealing time as duration that temperature stays about 700 K or above, similar to the thermal process used in the belt furnace and the RTP method [67, 153, 188]. 2 The
3.6 Results and discussion
57
stays about 700 K or above, is about 1.2 s; whereas annealing times of about 0.02 s and 0.008 s are observed in the cases of 15 mm/s and 50 mm/s, respectively. This indicates that the annealing time provided by the scanning speed of 1 mm/s can lead to good degree of hydrogen passivation compared to those of 15 mm/s and 50 mm/s scanning speeds. The cooling rates, dT dt , associated with the scanning speeds of 1 mm/s, 15 mm/s and 50 mm/s can be obtained using Fig. 3.7. It is observed that the wafer cools at a rate of 29 K/s in the case of 1 mm/s scanning speed at the laser power density of 5.74×10⁷ W/m2 . This cooling rate stays within the optimal range, 5 K/s and 45 K/s, provided by the belt furnace and the RTP method for passivation of crystallographic defects [68]. On the contrary, the cooling rates of 497 K/s and 1685 K/s are found for the scanning speeds of 15 mm/s and 50 mm/s at the laser power densities of 1.03×10⁸ W/m2 and 1.43×10⁸ W/m2 respectively, which are well above the cooling rates provided by the belt furnace and RTP method [68]. Since the retention of hydrogen at defects in silicon is significantly influenced by the cooling rate along with the annealing time [68], it is expected that the cooling rates associated with these fast scanning speeds, 15 mm/s and 50 mm/s, may negatively affect the retention of hydrogen and hence the passivation process. Excessively high cooling rates may also introduce other issues such as formation of cracks.
58
Laser annealing and its effect on the hydrogenation of silicon wafers
(a) Laser power density of 5.74×10⁷ W/m2 and v = 1 mm/s
(b) Laser power density of 1.03×10⁸ W/m2 and v = 15 mm/s
(c) Laser power density of 1.43×10⁸ W/m2 and v = 50 mm/s
Fig. 3.7 Temperature profiles as a function of time at a fixed location on the wafer at (a) the laser power density and scanning speed of of 5.74×10⁷ W/m2 and 1 mm/s, (b) the laser power density and scanning speed of of 1.03×10⁸ W/m2 and 15 mm/s, and (c) the laser power density and scanning speed of 1.43×10⁸ W/m2 and 50 mm/s, respectively, for FWHM = 170 µm.
3.6 Results and discussion
59
In summary this section shows that for the present laser beam and wafer, temperatures, annealing/exposure time and cooling rates similar to those reported to be optimal for passivation of crystallographic defects using conventional belt furnace and RTP processes can be achieved with scanning speeds of 1 mm/s and power of density of 5.74×10⁷ W/m2 , and a substrate temperature of 300 K. Effect of substrate heating Heating of the wafer may induce thermal stress, and hence can damage both SiNx film and the silicon wafer, for example by formation of cracks [189] or possibly by delamination of the film. As suggested [189], cracks can be formed due to formation of the thermal mismatch stress between the SiNx film and the silicon wafer. In order to reduce the chance of damage, due to thermally induced mechanical stress, a small laser power along with a high value of initial substrate temperature can be used. Figure 3.8 shows the maximum spot temperature for initial temperatures of 300 K, 473 K, 573 K, 673 K and 773 K for the scanning speed of 1 mm/s. As expected, higher initial substrate temperature relaxes the laser power density to achieve the same amount of spot temperature.
Fig. 3.8 Maximum spot temperature as a function of laser power density with different substrate heating of the wafer for the scanning speed of 1 mm/s, and FWHM = 170 µm. As in the last section, it is desirable to investigate the behaviour of parameters with the surface temperature held fixed. To this end a surface temperature of ∼1000 K was chosen while two initial wafer temperatures of 300 K and 673 K were investigated. For a fixed scanning speed of 1 mm/s, the required laser power to achieve this fixed surface temperature
60
Laser annealing and its effect on the hydrogenation of silicon wafers
was determined to be 5.74×10⁷ W/m2 in the case of the 300 K initial temperature and 2.83×10⁷ W/m2 for the initial temperature of 673 K. Figure 3.9 shows, in the above-mentioned cases, the surface temperature profile as a function of time at a fixed location on the wafer, and the temperature distribution within the depth directly below the laser. As can be seen in Fig 3.9a, temperature of the wafer is not rising as sharply in case of the initial temperature of 673 K compared to that of 300 K condition, as expected. Also, the difference in temperature between the top and bottom surfaces of the wafer obviously reduces in the case of substrate with initial temperature of 673 K, as can be seen in Fig. 3.9b. It is noted that the wafer undergoes a higher value of annealing time, about 30 s, in the case of substrate with initial temperature of 673 K compared to that of 300 K condition, where it is about 1.2 s. This therefore demonstrates that higher values of annealing time, which are beneficial for passivation, can be obtained by substrate heating.
61
3.6 Results and discussion
(a) Temperature as a function of time
(b) Temperature with the depth
Fig. 3.9 (a) Temperature profile as a function of time, and (b) temperature distribution within the wafer at the laser power densities of 5.74×10⁷ W/m2 and 2.83×10⁷ W/m2 with the initial temperatures of 300 K and 673 K, respectively, and for the scanning speed of 1 mm/s and FWHM = 170 µm.
62
Laser annealing and its effect on the hydrogenation of silicon wafers
To illustrate the effect of substrate heating on the reduction of thermal stress, the thermal stress was calculated for the above-mentioned conditions. The thermal stress in the SiNx film and the silicon substrate was determined using the analytical formula provided by Hsuch [190] 4 , σstressi = Ei (εstraini − αexpi ∆T ),
(3.22)
here, σstressi is the stress, Ei is the modulus of elasticity, εstraini is the strain, and αexpi is the coefficient of thermal expansion of layer i. Figure 3.10 shows the thermal stresses at the SiNx film and the silicon substrate at the laser power densities of 5.74×10⁷ W/m2 and 2.83×10⁷ W/m2 with the initial temperatures of 300 K and 673 K are calculated for the scanning speed of 1 mm/s. It is worth mentioning that the SiNx film exhibits tensile stress, whereas compressive stress exists in the silicon substrate. For both initial temperatures, higher values of thermal stress are observed in the SiNx film as compared with the silicon substrate. The stresses are also higher in the case of the 300 K initial temperature as compared with the 673 K initial temperature: in the SiNx film they are 350 MPa and 150 MPa respectively, while in the silicon wafer they are 2.4 MPa and 1.1 MPa respectively. The stresses in the wafer are very low and also compressive and therefore unlikely to cause any problems with cracks. The stresses in the SiNx film are higher and tensile so are more likely to cause issues, however the fracture strength in the formation of micro-cracks and possibly delamination for SiNx films on silicon are not to the best of our knowledge very well known, and probably depend significantly on the details of the deposition process. The broader point is that substrate heating has the potential to reduce thermal stress, should this be found to be a problem. If appropriate estimates for fracture strength could be determined, the current methodology would provide a valuable tool to predict the propensity to form cracks or delamination.
4 In
this case, the required geometrical requirements and mechanical assumptions are satisfied: (1) the thicknesses of the film and substrate are small compared to the lateral dimensions of the wafer, (2) the thickness of the SiNx film is much smaller than the silicon substrate thickness, (3) the thickness of SiNx film is uniform with good adhesion to the substrate, and (4) the deformation both for the SiNx film and the silicon substrate is situated in the elastic domain [191–193].
63
3.6 Results and discussion
(a) Stress within SiNx film (tensile)
(b) Stress within silicon wafer (compressive)
Fig. 3.10 Thermal mismatch stresses within (a) SiNx film, and (b) silicon wafer at the laser power densities of 5.74×10⁷ W/m2 and 2.83×10⁷ W/m2 with the initial temperatures of 300 K and 673 K, respectively, and for the scanning speed of 1 mm/s and FWHM = 170 µm.
64
3.6.2
Laser annealing and its effect on the hydrogenation of silicon wafers
B-O defect passivation
Having determined the laser annealing parameters that may lead to similar operating conditions compared to using the conventional methods of belt furnace and RTP for the hydrogen passivation of crystallographic defects, the effect of laser induced thermal process on the passivation of B-O defect complex is now studied. In previous experimental studies of laser hydrogenation, it has been reported that the dwell time of 10 s is required along with a spot temperature over 573 K to passivate the B-O defect complex [144]. Here the dwell time, also referred as the exposure time [160], is defined as the period of time in which a point on the silicon wafer experiences at least half of the power intensity of the laser beam [194], and this may be calculated as te = FWHM/v [160], where v is the scanning speed. The required dwell time is significantly longer than considered in the previous section focussed on crystallographic defect passivation. In view of this, the scanning speed was reduced and the FWHM was increased relative to the previous section. The FWHM and scanning speed of the laser beam are taken as 1000 µm and 0.1 mm/s respectively, which gives the dwell time of 10 s. Figure 3.11 shows the spot temperature as a function of laser power density for the scanning speed of 0.1 mm/s and FWHM of 1000 µm. As can be seen, as expected, the maximum temperature of the wafer increases along with the increasing laser power density.
Fig. 3.11 Maximum spot temperature as a function of laser power density for the scanning speed of 0.1 mm/s, FWHM = 1000 µm, and substrate temperature of 300 K.
3.6 Results and discussion
65
To illustrate the effect of CW laser annealing on the passivation of B-O defect complex, the temperature distributions and the corresponding passivated defect population NC within the depth of the wafer are presented in Fig. 3.12 and 3.13 for two different laser power densities of 4.46×10⁶ W/m2 and 5.88×10⁶ W/m2 respectively. The defect population was determined from the temperature profiles directly underneath the laser, assuming the temperature is approximately constant over the dwell time of 10 s, via the reaction set given earlier in eq. 3.14 - 3.17. The two power densities are selected to provide one example of effective passivation and another of ineffective passivation. As can be seen, in Fig. 3.12 and 3.13, the passivated defect population NC varies along with temperature, as a result of the changing equilibrium between competing reactions. A higher value of passivated defect population NC is observed for the lower power density case, which corresponds to the lower temperatures (the maximum temperature is 708 K in the higher power case and 603 K in the lower power case). As discussed by Hallam [153], in the present model of the B-O defect complex, dissociation of unpassivated defects dominates over the passivation reaction above 590 K, while above 640 K passivated defect destabilisation dominates the passivation reaction. So both effects contribute to the significantly lower levels of passivation achieved in the higher power case.
66
Laser annealing and its effect on the hydrogenation of silicon wafers
(a) Temperature within the depth
(b) Defect population NC at the passivated state within the depth
Fig. 3.12 (a) Temperature distribution, and (b) the defect population NC at the passivated state within the depth of the wafer at the laser power density, scanning speed, and FWHM of 4.46×10⁶ W/m2 , 0.1 mm/s and 1000 µm, respectively.
67
3.6 Results and discussion
(a) Temperature within the depth
(b) Defect population NC at the passivated state within the depth
Fig. 3.13 (a) Temperature distribution, and (b) the defect population NC at the passivated state within the depth of the wafer at the laser power density, scanning speed, and FWHM of 5.88×10⁶ W/m2 , 0.1 mm/s and 1000 µm, respectively.
68
Laser annealing and its effect on the hydrogenation of silicon wafers
To obtain insight into the effect of dwell time on the passivation of B-O defect complex, the temperature distributions and the corresponding passivated defect populations NC are calculated considering a variety of dwell times. A variety of dwell times were simulated using different laser beam widths, with scanning speed was kept fixed, i.e. 0.1 mm/s. (It is worth mentioning that the scanning speed used here, 0.1 mm/s, is the minimum speed that can be achieved using the mentioned diode laser). Cases FWHM of 1000 µm, 2000 µm, 3000 µm, 4000 µm and 5000 µm, which resulted in dwell times of 10 s, 20 s, 30 s, 40 s, and 50 s, respectively. The laser power was varied in order to obtain the same maximum spot temperature of ∼600 K in each case. For the aforementioned dwell times, laser energy densities of 4.46×10⁶ W/m2 , 2.41×10⁶ W/m2 , 1.70×10⁶ W/m2 , 1.38×10⁶ W/m2 and 1.13×10⁶ W/m2 , respectively, were found to be required. Note that these laser powers did not lead to exactly 600 K at the surface. Due the high sensitivity of the NC reaction system to temperature, the temperature profiles were therefore linearly rescaled to result in exactly 600 K at the surface in all cases 5 . The calculations of NC were carried out for the corresponding dwell times from the steady-state temperature profiles as a function of depth directly underneath the laser.
The temperature distributions and the corresponding passivated defect populations NC within the depth of the wafer (at the location directly under the laser) for the above noted dwell times is presented in Fig. 3.14. As expected, Fig. 3.14a, shows the temperature decays more rapidly for shorter dwell times. However, the effects on the passivated defect population shown in Fig. 3.14b are nonlinear, due the nonlinear temperature-dependence of competing reactions. Except in a small region close to the surface, the defect population NC in the passivated state increases with dwell time up to a dwell time of 20 s, after which it decreases again. The initial increase with dwell time is due to the increased time available for defect formation and passivation, while the subsequent decrease is due to the fact that temperatures are higher for longer dwell times, which decreases the net rates of defect formation and passivation. (In the near-surface region the temperature is very close to 600 K so that the NC value is determined essentially by the residence time.)
5 The linear rescaling was given by T ′
′
= (600 − Ti )/(Ts − Ti )(T − Ti ) + Ti , where T is the scaled temperature and Ts was the surface temperature prior to rescaling.
69
3.6 Results and discussion
(a) Temperature within the depth
(b) Defect population NC at the passivated state within the depth
Fig. 3.14 (a) Temperature distribution, and (b) the defect population NC at the passivated state within the depth of the wafer for the beam widths of FWHM = 1000 µm, 2000 µm, 3000 µm, 4000 µm and 5000 µm, and the scanning speed of 0.1 mm/s in the cases when the wafer observes the same maximum spot temperature of 600 K for the laser energy densities of 4.46×10⁶ W/m2 , 2.41×10⁶ W/m2 , 1.70×10⁶ W/m2 , 1.38×10⁶ W/m2 and 1.13×10⁶ W/m2 , respectively. The dwell times corresponding to the beam FWHM of 1000 µm, 2000 µm, 3000 µm, 4000 µm and 5000 µm are 10 s, 20 s, 30 s, 40 s and 50 s, respectively.
70
3.7
Laser annealing and its effect on the hydrogenation of silicon wafers
Concluding remarks
In this chapter, numerical modelling of the heat transfer equation was used to study thermal effects in laser-induced hydrogenation of silicon solar cell wafers. The objective was to understand how the laser parameters affect the resulting thermal treatment, and in turn the anticipated passivation levels. As expected, it was found that increased laser power, decreased scanning speed, and increased initial temperature all increased the maximum surface temperatures. With fixed maximum surface temperature, obtained by simultaneously varying laser power and scanning speed, lower scanning speeds (i.e. higher laser powers) resulted in lower temperature gradients within the wafer, and longer exposure times. Again with surface temperature held fixed, substrate preheating (requiring lower laser power) also decreased temperature gradients and increased exposure time. Substrate heating was also shown to result in lower thermal stress resulting from thermal expansion mismatch between the SiNx layer and the silicon substrate. It was shown that appropriate combinations of parameters could be chosen to enable process parameters in the same range as those known to be optimal for conventional belt furnace or RTP methods, which are used to enable hydrogen release and diffusion and to passivate some types of defects such as crystallographic defects. For example with a substrate initial temperature of 300 K, to achieve peak temperatures of ∼1000 K, with exposure time at least 1 s where the temperature is more than 700 K, and with cooling rates in the range 5 K/s to 45 K/s, a laser power of 5.74×10⁷ W/m2 and scanning speed 1 mm/s was shown to be appropriate. (For these settings, the peak temperature was ∼1000 K, the exposure time was 1.2 s and the cooling rate was 29 K/s.) This demonstrates the utility of the methodology to determine appropriate laser parameters to achieve given thermal processing characteristics. The effects of the laser annealing on the expected passivation of B-O defect complexes were then examined in light of recent developments in modelling of the reaction system of this complex. It was demonstrated first that laser parameters to obtain thermal parameters in the regime required for B-O defect passivation could be obtained; for example to obtain temperatures around 600 K and dwell time of 20 s, a laser power of 2.41×10⁶ W/m2 with FWHM of 2000 µm and scanning speed of 0.1 mm/s could be employed. To predict the resulting passivated defect concentrations, the resulting temperature distributions from the thermal model were then coupled with a three-state, four reaction model of B-O the defect complex including rates formation, passivation, dissociation and destabilisation. This model highlighted sensitivities to temperature and processing time, providing clues to designing a laser-processing regime to achieve effective and rapid passivation.
3.7 Concluding remarks
71
Overall, the chapter demonstrates that the availability of detailed space- and time-varying profiles of temperature provided by numerical modelling can be a powerful tool in designing appropriate laser processing methods to achieve hydrogen passivation.
Chapter 4 Diode laser annealing of Copper Zinc Tin Sulphide thin film based solar cells 4.1
Introduction
This chapter presents a numerical study of the laser induced heat transfer phenomena on the processing of the copper zinc tin sulphide (CZTS) based thin film solar cells. Cu2 ZnSnS4 (CZTS) is considered as the ideal material for using as an absorber in the next generation thin film based solar cells due its excellent material properties, such as being cheap, earth abundant and non-toxic [73–78]. In addition, it has the versatile electrical properties which can easily be tuned and tailored to the specific need in a given device structure [79]. In the processing of CZTS thin film based solar cells, it is required to perform thermal treatment on the CZTS absorber layer to alter its physical and chemical properties, and hence improve the structural, optical, surface morphological and electrical properties [80]. Although the thermal treatment can be provided using the conventional methods such as belt furnace and rapid thermal processing (RTP) [81–84], it is not possible to achieve the selective and precise control on the thermal process, which are required to produce high efficiency thin film based solar cells [35]. In view of this, laser annealing can be employed for providing the selective and precise thermal treatment on the CZTS thin film based solar cells, and improve their performance. In the case of laser annealing, the thermal treatment is controlled by the laser parameters. This indicates that the inappropriate settings of the laser annealing parameters can have a significant negative effect on the solar cells efficiency. In addition, the CZTS absorber layer thickness, which is one of the key parameters for designing the CZTS thin film based solar cells [195], may influence the thermal process during laser annealing. Therefore, it is necessary to investigate the thermal behaviour of the CZTS thin film based
74
Diode laser annealing of Copper Zinc Tin Sulphide thin film based solar cells
solar cells when they are treated using laser annealing. Although a number of research works has been conducted for thermal processing of the CZTS thin film based solar cells using the conventional methods [47, 73, 81–85, 196, 197], to the best of our knowledge, the thermal behaviour of solar cells under laser-based thermal treatment has not been understood yet. Investigation of the heat transfer phenomena using the experimental techniques would be very difficult and unwieldy to use as an optimisation tool. This chapter therefore explores a numerical approach to examine the thermal behaviour of the CZTS thin film based solar cells during laser annealing. The outcome of this study will provide an opportunity to use lasers as an effective tool for fabricating of the high efficiency CZTS thin film based solar cells.
4.2
Literature review
Cu2 ZnSnS4 (CZTS) is a promising material for producing low cost non-toxic thin film solar cells (TFSC) [198]. It is a p-type semiconductor with near-optimum direct band-gap, ∼ 1.5 eV, and high absorption co-efficient, ≥ 104 1/cm [198], giving the opportunity to minimise the materials used for cell fabrication [73–78]. The constituents used in the CZTS thin film are earth abundant and non-toxic, allowing fabricating of a thin film based solar cells to be free from problems related to both resource saving and environmental pollution. CZTS is a quarternary compound semiconductor, which is obtained replacing the selenium (Se) with sulfur (S), the rare metal indium (In) with zinc (Zn) and tin (Sn) in copper indium selenide (CIS) ternary compound [198]. Typically, the CZTS compound is categorised into two structures, stannite and kesterite, based on the locations of Cu and Zn in the CZTS crystal structure. The CZTS based solar cells are produced by sulfurisation annealing of CZTS precursors, which can be corresponding mixture of metal sulphides, metals, amorphous/nanocrystalline CZTS. First the amorphous/nanocrystalline CZTS is deposited on the Molybdenum (Mo) coated soda lime glass substrate using different depositions methods such as sputtering, co-evaporation, solution processed nanocrystals and some other methods [199–205]. Then crystallise with the assist of annealing [198]. The annealing process that results in the alternation of material’s physical and chemical properties, and reduction of the detrimental effects of defects modifying the surface properties [206]. During the annealing process, thin film is heated to a temperature which above its transition temperature. The film will be maintained at that temperature for a period of time and then cooled back to the room temperature. In the case of CZTS thin film annealing, the amorphous/nanocrystaline CZTS thin film starts to crystallise as the annealing temperature exceeds the transition temperature of the CZTS film [207], and then further increase in the annealing temperature influences the crystallised CZTS thin film’s optical,
4.2 Literature review
75
surface morphological and electrical properties [80]. It is also well known that the grain size of the crystallised CZTS thin film, which has a substantial effect on the solar light to electrical energy conversion efficiency, depends on the annealing temperature and conditions [75, 208, 209]. A suitable annealing time and temperature influence the diffusion of atoms adsorbed on the substrate and hence stimulate the migration of atoms to energetically suitable positions. This results in the enhancement of the crystallinity and phase purity of the CZTS film [210, 211]. Thermal treatment by means of annealing can be performed using the conventional furnace annealing (FA) [81], the RTP method [81–84] and the laser induced annealing [212– 215]. However, the laser induced annealing is superior to the other two techniques for the following reason [212, 216]. The localised nature of laser processing enables us to heat the film up to a higher temperature over a much shorter time than the RTP method, while allowing the substrate to remain at low temperature with a low ramp-up rate. This results in a short cycle time for reaction [85] and reduction of the thermal exposure. Additionally, the instantaneous conversion of absorbed laser radiation into heat may reduce the chance of deterioration of the absorber layer [217] and formation of the detrimental secondary phases [216], and hence may lead to a better grain quality [218, 219]. In the case of conventional methods, a long processing time is needed for the annealing process, which typically varies from a few minutes to several hours [147]. This long processing time influence for a large thermal budget [212], which eventually impact the cost of producing photovoltaic solar cells. In addition, in the case of conventional methods, several furnaces are required in parallel for a higher throughput introducing more cost compared with laser annealing [220]. Laser annealing may be considered as the absorption of light and instantaneous conversion of heat flow in the material [221]. The absorption depth of photons within the material, which can be derived from material’s dielectric function, depends on the laser beam wavelength and type of the material used. It is well known that the longer wavelength, i.e. lower energy, photons will be absorbed much deeper in the material, which influences the laser induced heat generation and hence propagation of heat flow within the material. Laser annealing of the CZTS thin film can be performed using the pulse laser [213– 215]. However, the effective heating time is not large enough in this mode [212], and is constrained by the pulse width of the laser beam. As a result, the long range atomic diffusion is substantially reduced, which may affect the improvement of the crystalline order of the thin film [212]. Additionally, the pulse laser annealing may also introduce thermal cracking, and secondary phase formation within the multilayer structure [222–224]. On the other hand, the continuous wave (CW) diode laser annealing is free from all of these shortcomings. In
76
Diode laser annealing of Copper Zinc Tin Sulphide thin film based solar cells
addition, the thermal cracking, which may be observed during the CZTS annealing, can be partially avoided by applying substrate heating. CW laser annealing helps to maintain a steady state temperature of the multilayer structure higher than the pulse laser annealing over a longer time. Hence, it provides energy distribution over a longer interval of time, which is considered long enough to drive atomic diffusion without melting of the structure [212]. Also, dewet of the multilayer structure, which may be observed in the case of pulse laser annealing, can be avoided using CW diode laser annealing and at the same time improvements in crystallinity may be observed [212]. The CW laser annealing had already been conducted for processing of the copper indium selenide (CuInSe2 ) based solar cells [149, 212, 225]. In these processing experiments, the Neodymium-doped Yttrium Aluminum Garnet (Nd:YAG) laser at wavelength of 1064 nm was used for the annealing. Although it had been reported that the efficiency of the solar cells could be improved using the considered laser beam, the limited spot size of the laser beam restricted for achieving a significant efficiency improvement. This problem can be easily overcome using the large array of diode lasers [212], which indicates that the CW diode laser annealing can significantly improve the efficiency of solar cells. Although, a number of research works has been conducted for processing of the CZTS thin film based solar cells using the conventional methods, such as the FA and RTP [47, 73, 81–85, 196, 197], the processing of the CZTS thin film based solar cells using the CW diode laser annealing has not been performed yet. In processing and optimisation of the CZTS thin based solar cells using the CW diode laser annealing, it is important to investigate the CW diode laser induced heat transfer phenomena in the CZTS thin film based solar cells. A number of numerical studies has been reported on laser processing of various semiconductor materials to achieve various outcomes. Most relevant to the present chapter are previous studies of crystallisation of the amorphous silicon [193], crystallographic defect removal from the polycrystalline silicon [160], annealing of the cadmium sulphide (CdS) and zinc selenide (ZnSe) [226], crystallisation of the cadmium teluride (CdTe) [35] and some others. However, none of these previous studies investigated the effect of laser induced heat transfer phenomena on the CZTS thin film based solar cells, the focus of the present work.
4.3 Objectives
4.3
77
Objectives
In the case of CW laser annealing, the temperature of the multilayer structure strongly depends on the laser annealing parameters, such as laser power, scanning speeds and substrate initial temperatures. This indicates that similar temperature distributions can be achieved under a variety of different operating conditions, for instance a strongly absorbed light rapidly scanned at high laser intensity can produce similar temperatures compared with using a slow scanning speed with a lower intensity. However, the thermal effects, such as annealing time, heating and cooling rates, associated with these different operating conditions will be completely different. In addition, initial temperature of the multilayer structure can play a big role for generating thermal stress during the laser annealing. This indicates that inappropriate settings of the operating conditions may significantly affect the kinetics of the CZTS material processing. Hence, it is necessary to investigate the heat transfer phenomena during CW laser annealing of the CZTS thin film based solar cells, which will guide us to determine the suitable operating conditions for processing of the CZTS thin film based solar cells. This is therefore the objective of this chapter.
4.4
Numerical procedures
The basic structure used in the numerical simulation consists of the thin film of CZTS deposited on molybdenum (Mo) coated soda lime glass substrate, which is often used for processing of the CZTS thin film based solar cells [199, 227]. The laser system used for the annealing is considered as a CW diode laser with the wavelength (λ ) of 808 nm. The CW diode laser beam is formed into a thin laser sheet having a lateral width of 12 mm [165]. The sheet has a Gaussian profile in the thinner dimension, having full width at half maximum (FWHM) of 170 µm, while the beam profile in the wider dimension is approximately a top-hat function [165]. The dimensions of the CZTS/Mo/glass structure considered are: length (L) of 20 mm, width (W ) of 20 mm, and depth (H) of 3.3 mm. The thicknesses of the CZTS absorber layers are considered as 600 nm, 1 µm, and 2 µm, whereas the thicknesses of the Mo thin film and glass substrate are taken as constant, 600 nm and 3.3 mm respectively. The laser annealing is performed using a variety of annealing parameters, such as laser powers, scanning speeds, and substrate initial temperatures, which are summarised in Table 4.1. It is worth mentioning that the annealing parameters used here, Table 4.1, are the parameters that can be obtained from the mentioned laser systems.
78
Diode laser annealing of Copper Zinc Tin Sulphide thin film based solar cells Table 4.1 Laser annealing parameters used for the CZTS/Mo/glass structure. Power
scanning speed
Substrate initial temperature
(kW/m)
(mm/s)
(K)
1-16
20, 25, 30, 50 and 100
300 and 473
Due to the high aspect ratio of the laser beam, it is approximated in this study as infinitely long, enabling the problem to be simulated and analysed in two dimensions instead of three. A diagram showing the laser annealing process along with the laser beam energy distribution is shown in Fig. 4.1. To obtain the temperature field induced by the laser irradiation, the transient heat conduction equation governing the heat flow in the CZTS/Mo/glass structure may be use [100],
d(ρiC pi Ti ) = ∇.(Ki ∇Ti ) + Qlaseri , dt
(4.1)
here, ρi is the density, C pi is the specific heat, Ki is the thermal conductivity, and Qlaseri is the heat source due to absorbed laser power of layer i. To account for a moving heat source a coordinate systems moving with the laser beam can be employed as shown in Fig. 4.1, which leads to an extra term in the energy equation as follows [94], d(ρiC pi Ti ) dTi = ∇.(Ki ∇Ti ) + ρiC pi v + Qlaseri , dt dx here, v is the scanning speed.
(4.2)
79
4.4 Numerical procedures
(a) 3-D view
(b) 2-D section A-A
(c) Diode laser beam [165]
Fig. 4.1 Schematic of the CW diode laser annealing process of the CZTS/Mo/glass structure, (a) 3-D view, (b) 2-D employed cross section (A-A) and (c) diode laser beam [165]. The laser is supposed fixed and the substrate moving.
80
Diode laser annealing of Copper Zinc Tin Sulphide thin film based solar cells
Since the effect of both convective and radiative heat transfer from all surfaces are negligible [49], the Neumann boundary conditions may be used for the top and side edges of the CZTS/Mo/glass structure. Far away from the heat source, in this case the edge at x = −L/2 in front of the laser beam, the CZTS/Mo/glass structure may not be affected by the heat source, and the temperature may remain unchanged. The glass substrate is thick enough to act as a good heat sink, and hence the Neumann boundary condition also may be used for the bottom of the structure. Therefore, the initial and boundary conditions for the problem may be may be summarised as,
T (x, y, 0) = T0 ,
−Ki
−Ki
∂T = 0, ∂x
∂T = 0, ∂y
x = +L/2,
y=0
Ti (−L/2, y,t) = T0 ,
(4.3)
(4.4)
and y = H,
(4.5)
x = −L/2,
(4.6)
at the interfaces between the layers, temperature and heat flux must be continuous function of position and hence may written as, ∂ Ti+1 ∂ Ti = −Ki+1 . (4.7) Ti (yi ) = Ti+1 (yi ) and − Ki ∂ y yi ∂ y yi Here, i and Ti represent the layer and the initial temperature, respectively. The governing equation, eq. 4.2, and the boundary conditions, eqns. 4.4- 4.7, are used to calculate the temperature distribution of the CZTS/Mo/glass structure. The partitioned method, as mentioned in section 2.6.2, is adopted to solve the multi-region problem. The temporal part of the energy equation, eq. 4.2, is discretised using the Euler implicit scheme whereas a second order accurate central difference scheme is used for the spatial term [93]. The grid spacing was 7.8×10⁻³ µm in the y direction, 5 µm in the x direction, and the time-step was 1 µs. The optical properties of the CZTS/Mo/glass structure, absorption coefficient (α) and reflectivity (R), has been calculated using the finite-difference time-domain method (FDTD) [228– 230]. Since temperature dependency of the thermophysical and optical properties of the considered materials are negligible [160, 231–237], these properties are taken as constant for
4.5 Validation with an experimental reference case
81
the simulations. The thermophysical and optical properties used in the simulations are taken from the published experimental results [160, 231–237], and summarised in Appendix A.
4.5
Validation with an experimental reference case
It is challenging to measure the temperature distribution of the above mentioned multilayer structures using the experimental methods during diode laser annealing, and also beyond the scope of the present thesis. Hence, before conducting numerical simulations for our problem, the numerical model was validated with a similar, previously reported, experimental case involving diode laser annealing of silicon thin-film on glass substrate [160, 236]. In this experiment, the temperature of the glass surface was measured through the silicon film using a high speed pyrometer. The principle of this measurement relies on the fact that the silicon film is transparent at the 5 µm wavelength [183], while the glass is opaque. The thermal emission from the glass therefore emanates from a very thin layer at the surface, which results in a robust proxy measurement of the film temperature. The CW diode laser beam of 808 nm wavelength was scanned over the surface of the silicon film, thickness of 1.8 µm, of the multilayer structure, and the temperature was recorded using the pyrometer. Further details of the experiment may be found in [160, 236]. The similar beam profile as mentioned in section 4.3 was used for the experiment. The dimensions of the structure were: L = 20 mm, W = 20 mm, and H = 3.3018 mm [236], which are also similar to the structure as mentioned in section 4.3. Therefore, the governing equation, eq. 4.2, and the boundary conditions, eqns. 4.4- 4.7, as mentioned in section 4.3 has been employed to calculate the temperature distribution for this structure. The grid spacing and the time step are also taken as similar to the value mentioned in section 4.3. The thermophysical and optical properties of the silicon and the glass substrate are taken from the published experimental results [160], and summarised in Appendix A. Figure 4.2 shows a comparison between the numerical and experimental results for the temperature profile as a function of time at the silicon/glass interface at the laser power density of 8.89 kW/m for the scanning speed of 5 mm/s. The maximum spot temperature as a function of laser energy dose at the exposure time of 6 ms and 12 ms is presented in Fig. 4.3. As can be seen, there is an excellent agreement between the numerical and experimental results.
82
Diode laser annealing of Copper Zinc Tin Sulphide thin film based solar cells
Fig. 4.2 Comparison of the numerical and the experimental temperature profile as a function of time at the silicon/glass interface at the laser power density of 8.89 kW/m for the scanning speed of 5 mm/s.
Fig. 4.3 Comparison of the numerical and the experimental results of maximum spot temperature as a function of energy dose at the exposure time of 6 ms and 12 ms.
4.6 Results and discussions
4.6
83
Results and discussions
Effect of CZTS thickness In CZTS thin film solar cells processing, the grain size and so on the crystallinity of the CZTS thin film strongly depends on the maximum surface temperature of the CZTS/Mo/glass structure [85, 196]. It is well known that the crystallinity of the CZTS thin film starts to improve as the maximum temperature of the CZTS/Mo/glass structure exceeds 773 K. Further increases in temperature results in better grain size which in some cases may be larger than 1 µm, and improved surface morphology of the CZTS thin film [85, 196]. The crystallinity of CZTS thin film continues to improve until temperature reaches 1173 K. Above 1173 K, the CZTS thin film starts to melt, which may lead to dweting of the film and hence may affects the grain growth [85, 238]. Therefore, it is necessary to achieve a maximum temperature in the range of 773 K to 1173 K during diode laser annealing. Figures 4.4-4.6 show the maximum spot temperature on the surface of the CZTS/Mo/glass structure as a function of laser power density for a variety of scanning speeds for the CZTS thin film thicknesses of 600 nm, 1 µm, and 2 µm, at the initial temperature of 473 K. As can be seen, a maximum spot temperature in the desired temperature range can be obtained using a variety of laser power densities and scanning speeds. As expected, for a constant film thickness, increasing the laser power density at a constant scanning speed will also increases the maximum spot temperature. On the other hand, the maximum spot temperature decreases with the increase of scanning speeds for a fixed laser power density. Therefore, as expected, in case of faster scanning speed, such as 100 mm/s, a higher laser power density is needed compared to that of slow scanning speed, such as 20 mm/s, to reach the desired temperature range. It is worth mentioning that processing with high laser power density can induce surface damage, and peeling effect on the CZTS and Mo films [239–241], which in turn results in buckle lines and hence peeling of the films from the glass substrate [242]. The peeling effect is detrimental for the solar cell applications [243].
84
Diode laser annealing of Copper Zinc Tin Sulphide thin film based solar cells
Fig. 4.4 Maximum spot temperature as a function of laser power density for the CZTS/Mo/glass structure for a variety of scanning speeds for the CZTS and Mo layer thicknesses of 600 nm and 600 nm respectively, at T0 = 473 K.
Fig. 4.5 Maximum spot temperature as a function of laser power density for the CZTS/Mo/glass structure for a variety of scanning speeds for the CZTS and Mo layer thicknesses of 1 µm and 600 nm respectively, at T0 = 473 K.
4.6 Results and discussions
85
Fig. 4.6 Maximum spot temperature as a function of laser power density for the CZTS/Mo/glass structure for a variety of scanning speeds for the CZTS and Mo layer thicknesses of 2 µm and 600 nm respectively, at T0 = 473 K. Since annealing of the CZTS thin film solar cells are performed to improve the surface morphology, removal of the structural defects and impurities, and driving of the chemical reactions within the CZTS precursor, the spatial distribution of temperature profiles on the surface and within the depth of the solar cells may significantly influence these processes along with the maximum spot temperature during the laser annealing. In addition, it has been reported that the atomic diffusion and grain growth may be influenced by the spatial variation of temperature within the precursors [85, 149, 196]. Therefore, it is necessary to investigate the spatial distribution of temperature profiles on the surface and within the depth of the CZTS thin film solar cells. Figure 4.7 shows the spatial distribution of temperature profiles on the surface of the CZTS precursor at the laser power density of 5.32 kW/m for the CZTS film thicknesses of 600 nm, 1 µm, and 2 µm, for the scanning speed and initial temperature of 100 mm/s and 473 K, respectively. In this, the laser irradiated spot on the surface of the CZTS precursor is represented by the red rectangle AC, in which A, B, and C represent the points at the front end, centre and rear end of the laser beam, to demonstrate the local temperature variations in the vicinity of the laser irradiated spot. As can be seen, in general, temperature decays sharply in front of the laser beam centre B, i.e. x < 0, whereas a gradual decay of temperature can be observed behind the laser beam centre B, i.e. x > 0. This is because, due to the movement of the workpiece, the energy absorbed from the laser source at a given location is limited to a short period of time, which in turn influences the temperature distributions in the surface vicinity. In the case of CZTS film thickness of 2 µm, the difference in temperatures between the centre and the front edge of the laser beam, i.e. AB, is higher, 166 K, compared
86
Diode laser annealing of Copper Zinc Tin Sulphide thin film based solar cells
to those of CTZS film thicknesses of 600 nm and 1 µm, 146 K and 120 K respectively. In addition, the temperature varies by 82 K between the centre and rear end of the laser beam, i.e. BC, in the case of CZTS film thickness of 2 µm, which is also higher compared to those of CTZS film thicknesses of 600 nm and 1 µm, 71 K and 57 K respectively. This highly inhomogeneous temperature profile, in the case of CZTS film thickness of 2 µm, is expected to generate a high thermal gradient in the irradiated region, which in turn may affect the removal of defects and impurities and hence the surface morphology of the CZTS precursor [149].
Fig. 4.7 The spatial distribution of temperature on the surface of the CZTS precursor at the laser power density of 5.32 kW/m and scanning speed of 100 mm/s for the CZTS film thicknesses of 600 nm, 1 µm, and 2 µm, at T0 = 473 K. The thicknesses of Mo and glass are kept constant, 600 nm and 3.3 mm respectively. The red rectangle AC represents the laser irradiated spot of 170 µm, in which A, B, and C are the front, centre and rear ends of the laser beam, respectively. Figure 4.8-4.10 show the spatial distribution of temperature profiles within the CZTS/Mo/ glass structure at the laser power density of 5.32 kW/m for the CZTS film thicknesses of 600 nm, 1 µm, and 2 µm, for the scanning speed and initial temperature of 100 mm/s and 473 K, respectively. In this case, the spatial distribution of temperature profiles within the depth of the CZTS/Mo/glass structure are represented at the centre of the laser beam B. As can be seen in Fig. 4.8 and 4.10, temperature varies within the CZTS thin film and glass substrate, whereas the temperature distribution is isothermal within the Mo thin film for all of the mentioned thicknesses of CZTS thin film. In the case of CZTS film thickness of 2 µm, the temperature varies by 14 K between the top and the bottom edge of the CZTS thin film, which is higher compared to those of CZTS film thicknesses of 600 nm and 1 µm, 2 K and 5 K respectively. This high value of temperature variation, in the case of CZTS film
4.6 Results and discussions
87
thickness of 2 µm, within the CZTS film may result in an significant spatial variations in the CZTS absorber layer properties, which in turn may lead to a non-uniform device properties and hence limits conversion efficiency of the solar cells [149, 196, 238]. In addition, the temperature variations associated with the CZTS film thickness of 2 µm can generate a higher value of thermal gradient within the CZTS thin film compared to those of CZTS film thicknesses of 600 nm and 1 µm, which may influence the formation of additional detrimental phases and defects, and thermal stresses within the film [85, 149, 196]. The significant variations in the spatial distribution of temperature profiles in the case of CZTS film thickness of 2 µm indicates that the absorber properties may be easily affected by the laser induced thermal treatment when a thick absorber layer is used, such as 2 µm. This in turn may limit processing of the CZTS absorber layer with similar structural properties as compared to furnace annealed absorbers [225].
Fig. 4.8 Temperature distributions within the CZTS/Mo/glass structure for CZTS absorber layer thickness of 600 nm at the laser power density of 5.32 kW/m and scanning speed of 100 mm/s, at T0 = 473 K. The thicknesses of Mo and glass are kept constant, 600 nm and 3.3 mm respectively. Note that the length scale used on the axis is different between the glass and CZTS/Mo substrates.
88
Diode laser annealing of Copper Zinc Tin Sulphide thin film based solar cells
Fig. 4.9 Temperature distributions within the CZTS/Mo/glass structure for CZTS absorber layer thickness of 1 µm at the laser power density of 5.32 kW/m and scanning speed of 100 mm/s, at T0 = 473 K. The thicknesses of Mo and glass are kept constant, 600 nm and 3.3 mm respectively. Note that the length scale used on the axis is different between the glass and CZTS/Mo substrates.
Fig. 4.10 Temperature distributions within the CZTS/Mo/glass structure for CZTS absorber layer thickness of 2 µm at the laser power density of 5.32 kW/m and scanning speed of 100 mm/s, at T0 = 473 K. The thicknesses of Mo and glass are kept constant, 600 nm and 3.3 mm respectively. Note that the length scale used on the axis is different between the glass and CZTS/Mo substrates.
89
4.6 Results and discussions
As can be seen in Fig. 4.8-4.10, the temperature level in the CZTS thin film is strongly affected by the CZTS film thickness, which indicates that thermal stress within the CZTS/Mo/glass structure can be induced during laser annealing. To obtain an insight into this, the thermal stress of the CZTS/Mo/glass structure is calculated for the CZTS film thicknesses of 600 nm, 1 µm, and 2 µm when the laser annealing is performed using the laser power density, scanning speed and substrate initial temperature of 5.32 kW/m, 100 mm/s and 473 K respectively. Since the deposition stress is negligible for soda lime based glass substrate, the stress due to thermal mismatches may lead to delamination at the CZTS/Mo interface [238]. The thermal stress for the CZTS/Mo/glass structure can be calculated using the following equation 1 [193, 238, 244], σstressi = Ei (εstraini − αexpi ∆T ),
(4.8)
here, σstressi is the stress, Ei is the modulus of elasticity, εstraini is the strain, and αexpi is the coefficient of thermal expansion of layer i. The thermal stress generated at the CZTS, Mo and glass substrate is presented as a function of CZTS thickness in Fig. 4.11, during annealing at the laser power density of 5.32 kW/m for the scanning speed of 100 mm/s at T0 = 473 K. It is worth noting that the tensile stresses are developed at the CTZS and Mo films, whereas the compressive stress is developed at the glass substrate as indicated by the negative value of stress in Fig. 4.11c during laser annealing. As can be seen, thermal stress increases with increasing CZTS film thickness. This is because the maximum spot temperature of the CZTS/Mo/glass structure is higher in the case of thick absorber layer, such as 2 µm, compared to that of thin absorber, such as 600 nm. Therefore, it is expected that the higher value of CZTS film thicknesses will more easily lead to a delamination at the CZTS/Mo interface when annealing at the same laser power density and scanning speed.
1 It
is worth mentioning that the analytical method for calculating of the thin film stress can be applied in the cases where (1) thicknesses of the film and substrate are small compared to the lateral dimensions of the substrate, (2) thicknesses of the film are much smaller than the substrate thickness, (3) thicknesses of the films are uniform with good adhesion to the substrate, and (4) the deformation both for the film and the substrate is situated in the elastic domain. In the present case, it can be properly assumed that the geometrical, and the mechanical assumptions [191–193] are verified. Therefore, the analytical method provided by [193, 238, 244] is used to calculate the thermal stress of the CZTS/Mo/glass structure.
90
Diode laser annealing of Copper Zinc Tin Sulphide thin film based solar cells
(a) Stress within CZTS
(b) Stress within Mo
(c) Stress within glass
Fig. 4.11 Thermal stress within (a) CZTS film, (b) Mo film, and (c) glass substrate as a function of CZTS absorber layer thickness at the laser power density of 5.32 kW/m for the scanning speed of 100 mm/s, at T0 = 473 K.
4.6 Results and discussions
91
Effect of scanning speeds Since the atomic diffusion is a thermally activated process, and it has been reported that the rate of atomic diffusion during the crystallisation process can be stimulated by the laser annealing [85, 149, 196], the atomic diffusion within the CZTS thin film may be influenced by the annealing time during the laser annealing. In addition, it has been suggested that the cooling rate may be a critical parameter for the chalcopyrite lattice order [225]. As mentioned in the case of laser annealing the annealing time and the cooling rate are influenced by the laser beam scanning speeds, it is necessary to investigate the effect of scanning speeds on the annealing time and the cooling rate of the CZTS/Mo/glass structure. In view of this, the temperature profiles induced by a variety of laser beam scanning speeds, 20 mm/, 50 mm/s, and 100 mm/s, are calculated using a constant CZTS layer thickness of 1 µm along with the fixed thicknesses of Mo thin film and glass substrate, 600 nm and 3.3 mm respectively. Figure 4.12 shows the temperature profiles as a function of time at the CZTS surface for the laser beam scanning speeds of 20 mm/s, 50 mm/s, and 100 mm/s for the cases in which the CZTS/Mo/glass structure observes the same maximum spot temperature for the laser power densities of 5.32 kW/m, 8 kW/m, and 10.5 kW/m respectively. As can be seen, the annealing time, duration that temperature stays about 773 K or above 2 , decreases along with increasing laser beam scanning speeds. In the case of 20 mm/s scanning speed, a higher value of annealing time, 15.4 ms, is observed compared to those of 50 mm/s and 100 mm/s scanning speeds, 5.6 ms and 2 ms. This high value of annealing time, in the case of 20 mm/s, may take part for the atomic diffusion within the CZTS thin film [196, 225]. The cooling rate associated with the scanning speeds of 20 mm/s, 50 mm/s and 100 mm/s can be calculated using Fig. 4.12. In case of 100 mm/s scanning speed, the CZTS/Mo/glass structure cools down at a rate of 47 K/ms, which is higher compared to those of 20 mm/s and 50 mm/s, about 11 K/ms and 5 K/ms respectively. The high cooling rate, 47 K/ms, associated with the 100 mm/s scanning speed may affect the atomic diffusion and grain growth within CZTS thin film [225]. Figure 4.13 shows the spatial distribution of temperature profiles within the depth of the CZTS/Mo/glass structure for the laser beam scanning speeds of 20 mm/s, 50 mm/s, and 100 mm/s for the cases in which the CZTS/Mo/glass structure observes the same maximum spot temperature for the laser power densities of 5.32 kW/m, 8 kW/m, and 10.5 kW/m respectively. As can be seen, in the case of 100 mm/s scanning speed, temperature decays sharply within the CZTS thin film and the glass substrate compared to those of 20 mm/s and 50 mm/s. This sharp temperature profile, in the case of 100 mm/s, can easily generate a 2 Here,
in order to compare with the thermal process used in the belt furnace and RTP method, the annealing time is referred as the duration that temperature stays about 773 K or above during the laser annealing [196].
92
Diode laser annealing of Copper Zinc Tin Sulphide thin film based solar cells
high value of thermal gradient within the CZTS/Mo/glass structure, and hence may affect the CZTS absorber layer properties. In addition, the sharp temperature gradient within the glass substrate can easily induces a high value of thermal stress, which consequently may lead to a damage of the glass substrate.
Fig. 4.12 Temperature profiles as a function of time at the CZTS surface for the scanning speeds of 20 mm/s, 50 mm/s and 100mm/s for the cases in which the CZTS/Mo/glass structure observes the same maximum spot temperature at the laser power densities of 5.32 kW/m, 8 kW/m, and 10.5 kW/m respectively, at T0 = 473 K. The thicknesses of the CZTS film, Mo film and glass substrate are 1 µm, 600 nm, and 3.3 mm respectively.
4.6 Results and discussions
93
Fig. 4.13 The spatial distribution of temperature profiles within the CZTS/Mo/glass structure for the scanning speeds of 20 mm/s, 50 mm/s and 100mm/s for the cases in which the CZTS/Mo/glass structure observes the same maximum spot temperature at the laser power densities of 5.32 kW/m, 8 kW/m, and 10.5 kW/m respectively, at T0 = 473 K. The thicknesses of the CZTS film, Mo film and glass substrate are 1 µm, 600 nm, and 3.3 mm respectively. Note that the length scale used on the axis is different between the glass and CZTS/Mo substrates.
Effect of substrate heating Having investigated the effect of laser beam scanning speeds on the thermal processes of the CZTS/Mo/glass structure, the effect of substrate heating during laser annealing is studied in this section. It is worth noting that, heating of the CZTS/Mo/glass structure, when the CZTS/Mo/glass structure is in the room temperature, can easily induce thermal stress and hence can damage the CZTS/Mo/glass structure. Therefore, it is necessary to investigate the effect of substrate heating during the laser annealing. Figures 4.14a and b shows the temperature profiles at the CZTS surface and within the depth of the CZTS/Mo/glass structure for the cases when the structure is initially at room temperature (300 K) and when it is at 473 K, for the scanning speed of 100 mm/s and CZTS film thickness of 1 µm. For the two different substrate temperature, different laser powers were used in order to achieve the same maximum temperature. As expected, higher initial temperature of 473 K relaxes the laser power density to achieve the same amount of maximum spot temperature compared to that of room temperature condition, which may be beneficial for the reduction of surface damage of the structure [157]. As may also be seen in Fig. 4.14a, the spot temperature for the initial temperature of 473 K is not rising as sharply as in the case of room temperature. Therefore, the chance of CZTS absorber layer
94
Diode laser annealing of Copper Zinc Tin Sulphide thin film based solar cells
delamination from the Mo layer during the annealing process is reduced [158]. This can be seen in Fig. 4.15, in which the thermal stress distribution within CZTS, Mo and glass are presented for the cases when the structure is initially at room temperature and when it is at 473 K, again for the scanning speed of 100 mm/s and CZTS film thickness of 1 µm. As can be seen in Fig. 4.15, higher thermal stresses are generated within CZTS, Mo and glass in case of annealing at room temperature compared to that of annealing at 473 K. It is also worth noting that in Fig. 4.15b, thermal stress generated within the Mo film exceeds the ultimate point during annealing at room temperature, which indicates that the delamination will occur at the CZTS/Mo interface at this condition. The sharper variation of temperature profile within the glass substrate, in case of room temperature compared to that of 473 K, as can be seen in Fig. 4.14b, also induces a higher value of thermal stress profile within the glass substrate, as can be seen in Fig. 4.15c.
95
4.6 Results and discussions
(a) At CZTS surface
(b) Within CZTS/Mo/glass
Fig. 4.14 Temperature distributions (a) at the CZTS surface and (b) within the CZTS/Mo/glass multilayer systems at the laser power density of 8 kW/ m and 5.32 kW/m for the scanning speed of 100 mm/s at T0 = 300 K and 473 K, respectively.
96
Diode laser annealing of Copper Zinc Tin Sulphide thin film based solar cells
(a) Stress distribution within CZTS film
(b) Stress distribution within Mo film
(c) Stress distribution within glass substrate
Fig. 4.15 Thermal stress distribution within (a) CZTS film, (b) Mo film, and (c) glass substrate at the laser power density of 8 kW/ m and 5.32 kW/m for the scanning speed of 100 mm/s at T0 = 300 K and 473 K, respectively.
4.7 Concluding remarks
4.7
97
Concluding remarks
In conclusion, the heat transfer phenomena during diode laser annealing of the CZTS thin film deposited on the Mo coated glass substrate was investigated using numerical simulations. The numerical model, based on the conjugate heat transfer process, was developed by solving transient heat conduction equation. The numerical simulations were carried out for the CZTS absorber layer thicknesses of 600 nm, 1 µm, and 2 µm; whereas the thicknesses of Mo film and glass substrate were kept constant, 600 nm and 3.3 mm respectively. The effect of key laser annealing parameters and thicknesses of the absorber layers on the heat transfer process were investigated. The specific conclusions derived from the present study can be listed as follows: 1. Though the optimal temperature range for crystallisation of CZTS thin films can be obtained using a variety of laser power densities and scanning speeds for the CZTS absorber layers thicknesses of 600 nm, 1 µm, and 2 µm, it was shown, for a constant laser power density and scanning speed, the thermal stress within the films and substrate increases with the CZTS absorber layer thickness. This indicates that, a thick absorber layer may easily induce delamination at the CZTS and Mo interface during laser annealing. 2. It was observed that, in the case of CZTS absorber layer thickness of 2 µm, a highly inhomogeneous temperature profile can be generated on the irradiated surface compared to those of 600 nm and 1 µm thickness during the annealing. The significant variation of the temperatures in the irradiated region, in the case of CZTS absorber layer thickness of 2 µm, may take an active part for affecting the surface morphology and hence limit the solar cells performance. 3. During the laser annealing, the Mo thin film was isothermal, whereas the spatial variation of temperatures within the CZTS thin film and the glass substrate were observed. Compared to the CZTS film thicknesses of 600 nm and 1 µm, a higher value of temperature variation was observed within the CZTS thin film in the case of CZTS film thickness of 2 µm, which may result in an significant spatial variations in absorber layer properties and hence may lead to the non-uniform device properties. On the other hand, the CZTS absorber layer thicknesses of 600 nm and 1 µm may be used to process laser annealed absorbers with similar properties compared to using the conventional methods. 4. The annealing time reduces significantly when a fast scanning speed is used, such as 100 mm/s, compared to those of slow scanning speeds, such as 20 mm/s and 50
98
Diode laser annealing of Copper Zinc Tin Sulphide thin film based solar cells mm/s, which may affect the atomic diffusion and grain growth within the CZTS film. In addition, in the case of 100 mm/s scanning speed, a sharp decay in the spatial distribution of temperature profile within the CZTS film and the glass substrate can be observed compared to those slow laser beam scanning speed, such 20 mm/s and 50 mm/s. This sharp temperature profile, in the case of 100 mm/s scanning speed, within the CZTS film may significantly affect the CZTS absorber layer properties. In addition, the sharp decay of temperature at the glass substrate may induce a high thermal stress, and hence may lead to a damage of the glass substrate. 5. The thermal stress generated at the Mo thin film, due to laser annealing when the CZTS/Mo/glass structure’s initial temperature is in the room temperature condition, can easily exceeds the ultimate point of the Mo thin film, and hence may lead to delamination at the CZTS/Mo interface. This indicates that the CZTS/Mo/glass structure’s initial temperature can be a key parameter for reducing thermal stress within the CZTS/Mo/glass structure, and hence improve performance of the solar cells.
Chapter 5 Dynamics of laser induced melting and solidification of silicon wafers for solar cells processing 5.1
Introduction
This chapter reports a numerical study of the dynamics of pulse laser-induced melting and solidification of silicon wafers used in solar cell processing. The localised nature of laser processing allows the depositing of a precise amount of energy in a short time into the surface area without heating the bulk. Under suitable conditions, irradiation leads to the melting and subsequent re-solidification of the heated region which enables a number of applications, such as dopant diffusion [23–30], junction formation [27, 29, 39–41], and damage removal from the ion-implanted layer [23, 27]. For such applications, it is important to achieve well controlled melting and solidification processes to reduce various types of detrimental defects and mechanical stress formation [26, 29, 43–50]. In the case of pulse laser processing, the melting and solidification processes are strongly influenced by the laser pulse characteristics, such as pulse duration, pulse energy, and distribution of pulse energy i.e. the pulse shaping. While a number of studies have been conducted to investigate various aspects of laser-induced solar cell processing, such as dopant diffusion, junction formation and damage removal [29, 39, 245–261], and generation of various types of pulse shapes [30, 262–272], the effect of pulse shaping on the heat transfer phenomena and the associated melting dynamics has been less extensively studied for solar cells processing. A detailed understanding of the thermal process and its fluctuations and the associated melting dynamics due to pulse shaping can be useful to achieve a better control on these
100
Dynamics of laser induced melting and solidification of silicon wafers for solar cells processing
processes, and conducting optimisation of the existing pulse shapes. In view of this, here the numerical simulations have been carried out with the objective of investigating the thermal process and the melting dynamics associated with the pulse shapes widely used for solar cells processing, and to determine optimal pulse shapes depending on the desired characteristics of the laser-processing application.
5.2
Literature review
Material modification by means of local laser-induced melting, followed by solidification, is widely employed method in various solar cell processing applications. The melted phase of the material enables for high atomic mobilities and solubilities, which together with the localised and high-rate nature of laser processing enable lasers to be employed in several ways. For example, lasers can melt damaged surface regions, and the subsequent rapid epitaxial resolidification can be used to restore crystalline order. Exploiting the high mobility and solubility of dopants in the liquid phase can enable regions to be locally doped at concentration levels orders of magnitude higher than the equilibrium solubility limit in the solid phase. This enables many “laser-doping” applications including the formation of large area emitters [86, 87], selective emitters [273–276] and back surface fields [87, 88]. Local heating and melting of silicon and a metal can be used to create laser-fired Ohmic contacts [277]. Finally, lasers are also used in several processes involving ablative material removal, which also involves melting prior to ablation, such as laser drilling [278], grooving [17], texturing [273, 279], etc. Heat treatment associated with the pulsed laser processing results in a phase-change process in the near surface region of the irradiated material. The basic sequence that occurs is always the same: melting of the near surface region and redistribution of atoms in the melt, followed by rapid solidification. Parameters that characterise this process, such as the melting duration, melt depth and the re-solidification velocity are important in typical solar cell processing applications, such as the laser doping process [24, 26]. These melting parameters are influenced by the heat transfer process, which may be characterised by temperature, heating and cooling rate. In turn, the heat transfer and phase change processes are obviously dependent on the pulse irradiation parameters including wavelength, pulse duration and shape of the pulse. Inappropriate settings of these parameters can result in non-optimal process outcomes [26, 29, 43–50]. It has been reported that a number of defects can be generated during the laser processing if the melting parameters are not well controlled [24, 26]. The reported defects are mostly generated from the quenching process due to the fast cooling and re-solidification of the
5.2 Literature review
101
irradiated layer, and are concentrated in the vicinity of the surface layer [24, 26]. Thus, it is necessary to control the re-solidification velocity. One way to achieve this is to use a slightly longer pulse [251]. However, changing the pulse duration for a laser system is not a straightforward task [102, 252]. The pulse duration is a unique property of the laser itself; hence, variation of it requires implementing additional processes, such as pulse extender optics [102, 252]. It has been suggested that the substrate heating of the wafer can control the cooling rate and the re-solidification velocity [29]. However, this may affect the thermal energy budget during the laser annealing, as the whole wafer has to be heated and cooled [251]. To control the thermal process, and hence the melting parameters [280], the pulse shaping can be performed using a variety of methods, such as using light-loop controlled optical modulation [265], a transparent mirror for splitting the beam [30], variation of input current to the laser system [267] etc. The pulse shaping is characterised by the transient character of the initiated heat transfer phenomena, which indicates that analysing and characterising of this heat transfer phenomena will guide for optimising a chosen application, and developing a new laser system. Pulse shaping is potentially an attractive alternative to the above-mentioned options [265, 267, 280]. It can be considered as a technique used for temporal distribution of energy within a single pulse. There are various methods to achieve pulse-shaping, for example by varying the power supplied to a laser [281], by using light-loop controlled optical modulation [265], by using transparent mirror for splitting the beam [30] etc. As the pulse shaping allows a variable but controlled release of energy during the laser processing, the melting behaviour of the material can be controlled and defects potentially limited. While extensive research has been conducted to study the material effects and laser induced damage based on the laser power [24, 47], pulse width [39, 102, 260, 272], pulse frequency and pulse repetition [251, 282], very little research has considered the detailed effects of pulse-shaping on the heat transfer and melting behaviour. In designing and optimisation of a pulse shape, it is important to understand how energy distributions within the pulse controls the thermal process and hence the melting dynamics. Although a number of publications provided information for the generation of different types of pulse shapes [30, 262–272], the influence of pulse shaping and its effect on the heat transfer phenomena and the associated melting dynamics has not been yet completely understood for silicon wafers. To obtain the understanding of the induced heat transfer and phase change required for pulse-shape optimisation, experimental or numerical methods could be employed. Experimentally, there are several studies of pulse-shaping which report the final outcomes in terms of the resulting material properties after the laser processing [248], however without fully
102
Dynamics of laser induced melting and solidification of silicon wafers for solar cells processing
understanding the reasons behind those outcomes, optimal outcomes are not guaranteed. There have been a few attempts to experimentally measure important parameters during the process of pulse laser-material interaction, such as surface temperatures [283, 284], surface phases [248], melting depth and duration [124] etc. While valuable, these measurements are quite difficult, and typically only measure quantities at the surface; therefore they are unable to measure quantities of interest such as resolidification velocities, internal cooling rates, etc. Numerical approaches offer a valuable alternative. Several relevant numerical studies of melting and solidification during pulsed laser material interactions have been reported. Matsuno investigated the effect of pulse duration [39] on the melting depth, Gonda et al. [251] and Hackenberg et al. [282] investigated the effect of pulse repetition on the melting depth and duration, the effect of substrate heating on the resolidification velocity was examined by Young et al. [29], Aziz et al. [121] investigated the effect of wavelength on the melting depth and duration, Cole et al. [285] examined effect of laser power on the melting depth. However, none of these studies considered the effect of varying pulse shapes. As already noted, pulse shaping potentially offers interesting control of key parameters such as the resolidification velocity and melting duration. This therefore motivates the present numerical study of pulse laser melting and solidification.
5.3
Objectives and problem descriptions
In view of the above background, the objectives of this chapter are to investigate how the transient processes of heat transfer, melting, and resolidification are influenced by the pulse shape, and to determine the optimal pulse shape given desired process parameters. Pulse shapes are not infinitely variable, therefore five different widely used pulse shapes are investigated Gaussian [120, 121, 286], Gate [30, 286–288], Weibull [116], Asymmetric Gaussian [268, 289] and Q-switched [89, 286, 288–290]. The temporal pulse shapes of Gaussian, Gate, Weibul, Asymmetric Gaussian (referred henceforth as simply Asymmetric), and Q-switched were constructed based on the shapes provided by [30, 89, 89, 116, 120, 121, 268, 286–291]. Figure 5.1 shows the temporal pulse shapes for the investigated pulses having the same R full width at half maximum (FWHM) and laser energy, F(t)dt, where F(t) is the temporal shape function. As can be seen, the Gate pulse shape, which is the simplest and most extensively used laser pulse shape within industry and academia [267], can be considered as having two transient intervals at the fore and rear ends corresponding to the switch-on and the turn-off of the pulse, while the energy density remains constant in between. The other shapes all involve continuously varying energy density. The Gaussian pulse shape has
5.3 Objectives and problem descriptions
103
a symmetric profile, i.e. the ramp-up gradient (α ′ = dF/dt| f ) and ramp-down gradient (β = dF/dt|t ) are the same. On the contrary, compared to the Gaussian pulse shape, a different value of α ′ , and β can be observed for the Weibull, Asymmetric and Q-switched pulse shapes. The variation of gradients between the ramp-up and ramp-down stages of pulse repetition can be used to characterise the distribution of heat in the pulse. Figure 5.2 shows the ratio of α ′ and β , r = α ′ /β , and the pulse rise time, tr , associated with the Gate 1 , Gaussian, Weibull, Asymmetric and Q-switched pulse shapes. In terms of the ratio of ramp-up to ramp-down ratios, the ordering of the pulses is Gaussian/Gate, Weibull, Asymmetric, and Q-switched, i.e. the latter shapes tend to distribute comparatively more energy in the ramp-down phase than in the ramp-up phase. The ordering for the pulse rise time is, as a consequence, opposite. The type of the laser beam was taken as a nanosecond KrF excimer with a wavelength (λ ) of 248 nm, which is often used for processing of solar cells [259, 292–294]. It was assumed that the laser power density is constant over the considered surface; hence the simulations can be performed in one spatial dimension [49, 116] 2 . To compare the thermal processes R and the associated melting dynamics for the various pulse shapes, the laser fluence F(t)dt of the different pulse shapes was kept constant, along with the pulse width, i.e. the FWHM, at 32 ns. The laser fluences were chosen low enough so that the vaporisation temperature of silicon would not be reached. An schematic of the problem modelled in the simulation is presented in Fig. 5.3. The laser is assumed to be normally incident on the surface. The melt front is directed inwards of the wafer and considered as positive, whereas the solidification velocity is considered as negative in the chosen coordinates.
1 Although
the Gate pulse has an infinite ramp-up and ramp-down rate in the present idealisation, the ratio of the two rates is taken as unity by symmetry. 2 The minimum spot diameter of a typical pulse laser beam, focused by a 5 cm focal lens along with a beam divergence of 0.01 rad, is about 0.05 cm [116].
104
Dynamics of laser induced melting and solidification of silicon wafers for solar cells processing
(a) Gaussian pulse shape showing ramp-up stage, ramp-down stage and FWHM
(b) Gaussian, Gate, Weibull, Asymmetric, and Q-switched pulse R shapes at the same laser energy, F(t)dt, and FWHM
Fig. 5.1 (a) Temporal pulse shape of Gaussian showing the ramp-up stage, ramp-down stage and FWHM, and (b) the pulse Rshapes of Gaussian, Gate, Weibul, Asymmetric, and Q-switched at the same laser energy, F(t)dt, and full width at half maximum (FWHM). t1 is the time at which the pulse delivers its maximum intensity.
5.3 Objectives and problem descriptions
105
Fig. 5.2 Ratio of the ramp-up and ramp-down gradient, r = α ′ /β , and the pulse rise times, tr , associated with the pulse shapes of Gaussian, Weibull, Asymmetric and Q-switched.
Fig. 5.3 Schematic diagram of the laser irradiated silicon wafer. The X coordinate is shown only to improve clarity. The simulated problem is one dimensional.
106
5.4
Dynamics of laser induced melting and solidification of silicon wafers for solar cells processing
Numerical procedures
To obtain the temperature field and capture the propagation of melting front due to laser irradiation, an energy-based formulation of the heat conduction equation, taking into account the enthalpy of melting and solidification, was used. The energy-based formulation of the heat conduction equation may be written as [98],
dH = ∇.(K∇T ) + Qlaser , dt
(5.1)
here, H is the total enthalpy, K is the thermal conductivity, and Qlaser is the heat source due to the absorbed laser power, which is calculated using the method mentioned in section 2.3. The total enthalpy in the energy equation, eq. 5.1, consists of the sensible enthalpy and the latent heat of fusion when melting and solidification is considered. Therefore, H may be expressed as [98],
Z T
H = h + γρL f =
Tre f
ρC p dT + γρL f .
(5.2)
Here, h is the sensible enthalpy, L f is the latent heat of fusion, Tre f is the reference temperature, C p is the specific heat, ρ is the density, and γ is the phase fraction. Substituting eq. 5.2 into eq. 5.1 leads to the following form of the energy equation,
d(ρC p T ) dγ = ∇.(K∇T ) + Qlaser − ρL f . dt dt
(5.3)
The liquid fraction in the energy equation, eq. 5.3, is a Heaviside step function which may be written as,
γ = 1,
when T > TM ,
γ = 0,
when T < TM ,
and
(5.4)
where, TM is the melting temperature. To complete the mathematical description of the problem, the boundary and initial conditions are specified. Since the effect of both convective and radiative heat transfer from the front surface, y = 0, is negligible [49], the Neumann boundary condition may be used. At the bottom of the wafer, y = d, the Dirichlet boundary condition may be employed, as the
107
5.5 Validation
wafer is thick enough to act as a good heat sink and temperature at the bottom of the surface remains unchanged. Here, d is the depth of the wafer. Therefore, the initial and boundary conditions for the problem may be summarised in the following, T (y, 0) = T0 , dT −K = 0, dy y=0 T (d,t) = T0 ,
(5.5)
and
(5.6)
(5.7)
here, T0 is the initial temperature. The coupled equations, eqns. 5.3 and 5.4, along with the boundary and initial conditions, eqns. 5.5-5.7, are solved using the implicit enthalpy method detailed in section 2.6.2. A second-order accurate central difference scheme is used for the spatial term, and the Euler implicit method is used for the temporal discretisation. The temperature dependent thermophysical and optical properties of the silicon wafer are taken from the published experimental results [49, 100, 120, 124–127], and are summarised in Appendix A. The spatial grid spacing was dy = 1.5 × 10⁻⁴ µm and the time step was dt = 0.01 ns. In the inner iteration on the phase fraction, convergence was judged to be achieved when the convergence criteria was γnew −γ satisfied, γold old ≤ 1 × 10⁻⁵ , where γnew and γold are the present and previous iterative max values, respectively.
5.5
Validation
Experimental data for the all of the test cases examined in this chapter was not available. Therefore, before conducting the numerical investigations to reveal the effect of pulse shaping on the thermal processes and the associated melting dynamics, the numerical model is validated with experimental data reported by Unamuno et al. [120] and Aziz et al. [121]. These experiments report the maximum melting depths as a function of laser energy for the Gaussian pulse shape with other parameters (FWHM and laser wavelength) the same as adopted in the present work 3 When dopants are introduced into silicon via ion implantation, silicon atoms are often displaced. This results in disruptions of the crystallographic structures of the silicon, which 3 In
the experiments, the laser beam had an approximately uniform intensity of a 3×3 cm2 area, while the present model is fully one dimensional.
108
Dynamics of laser induced melting and solidification of silicon wafers for solar cells processing
are referred to dislocation loops [122, 123]. The melting and resolidification that occurs during the laser processing removes these dislocations. The experiments took advantage of this by measuring, from transmission electron microscopy (TEM) images, the maximum depth at which dislocation loops created by a low dose ion-implantation were removed. Figure 5.4 shows a comparison between the numerical and experimental results for the melting depth. As can be seen, there is an excellent agreement between the model and experiment. As can also be seen, as expected, melting depth of the wafer increases with laser fluence, corresponding the great amount of energy available to effect phase change.
Fig. 5.4 Comparison of the numerical and the experimental results presented by Unamuno et al. [120] and Aziz et al. [121] for the melt depth as a function of laser energy, for λ = 248 nm and FWHM = 32 ns.
5.6 Results and discussions
5.6 5.6.1
109
Results and discussions Surface temperature evolution
Having validated the numerical models with the available experimental data, the effect of pulse shaping on the surface temperature evolutions is now investigated. First, the surface temperature profiles resulting from the Gaussian pulse shape are investigated for a variety of laser fluences. After that, the effects of the energy distributions at different stages of a single pulse system on the surface temperature profiles are investigated between different pulses considered. To demonstrate the effect of phase transition on time evolution of the temperature profiles, the surface temperature profiles as a function of time for a variety of laser fluences are presented in Fig. 5.5 for the Gaussian pulse shape. As expected, temperature of the wafer increases along with laser fluence. The surface temperature of the wafer increases rapidly from the initial temperature, which is considered here as 300 K, to the melting point, as can be seen in Region A in Fig. 5.5. In this region, the silicon wafer remains in the solid state. When temperature of the wafer reaches the melting point, a sharp decrease in the rate of temperature rise is observed, as can be seen in Region B in Fig. 5.5. The slowing of the temperature rise rate is due mainly to energy being absorbed near the surface as latent rather than sensible heat, but also to the appearance of a surface film of liquid, which has a higher reflectivity. If the incident laser fluence is above a certain threshold and sufficient time has elapsed, the surface temperature of the wafer starts rising again, although not as rapidly as before, until it reaches its maximum, as can be seen in Region C in Fig. 5.5.
110
Dynamics of laser induced melting and solidification of silicon wafers for solar cells processing
Fig. 5.5 Temperature profiles on the surface of the wafer as a function of time for a variety of laser fluences for the Gaussian pulse shape. τ presents the time at which temperature reaches the maximum value.
It is worth noticing that the surface temperature of the wafer reaches its maximum at a time, τ, greater than the time, t1 , at which the pulse delivers its maximum intensity, as can be seen in the pulse shape presented in Fig. 5.1a. The time difference, i.e. the times at which the maximum pulse intensity and the maximum temperature occur, is referred as the time delay ∆ = τ − t1 [286]. It may be observed in Fig. 5.5 that this time delay is nearly independent of the laser fluence. After the maximum value, the surface temperature of the wafer starts to decrease, and it continues until the freezing point is reached where the latent heat is removed, as can be seen in Region D in Fig. 5.5. Finally, in Region E, the solidified wafer slowly cools. Figure 5.6 shows the surface temperature profiles as a function of time for the investigated pulse shapes for the same laser fluence of 1.6 J/cm2 . As can be seen, surface temperature of the wafer increases rapidly until it reaches to the maximum value, for all of the mentioned pulse shapes. As can be seen, the temperature profiles go through the same basic sequence for all of the pulse shapes, A-F. During phase A, the initially rapid temperature rise, the rate of temperature rise increases with decreasing rise time tr , i.e. the Gate has the fastest temperature rise and the Gaussian profile has the slowest. The behaviour in phase B, the short hiatus as the melting temperature is reached, is quite similar among the different pulses, but occurs at a different time.
5.6 Results and discussions
111
Figure 5.6 shows that in phase D, the cooling back to the melting temperature occurs with different timescales for the different pulses. The trend is the same as for phase C, with the Gate pulse shape having the shortest cool down and the Q-switched pulse shape having an exceptionally long cool down. The length of the hiatus of cooling in phase E, where the surface hovers at the melting temperature, is also dependent on the pulse shape, while the cool down period phase F is similar amongst the shapes. Clearly, there are significant differences in the total amount of time the surface is melted, again with Gate and Q-switched being the outliers for the shapes with the shortest and longest melting duration, respectively. Overall the analysis of the temperature profiles during phases A-F for the different shapes can be principally attributed to the differences in the rates of energy deposition in the fore and rear ends of the pulse. This analysis therefore points to this distribution as a key variable in the optimisation of pulse shapes [295].
Fig. 5.6 Temperature profiles on the surface of the wafer as a function of time for the pulse shapes of Gaussian, Gate, Weibull, Asymmetric, and Q-switched for the same laser fluence and FWHM of 1.6 J/cm2 and 32 ns, respectively. Figure 5.7 shows the time delay, pulse rise time, and r associated with the various pulse shapes. The information of this time delay can be used for conducting optimisation of the existing pulse shapes, as the pulse shape can be completely specified if the associated time delay is known [295]. In addition, when the consecutive pulses are used, the time delay can be a key factor for providing the required time between two consecutive pulses.
112
Dynamics of laser induced melting and solidification of silicon wafers for solar cells processing
Fig. 5.7 The time delay ∆, pulse rise time tr , and r = α ′ /β associated with the pulse shapes of Gate, Gaussian, Weibull, Asymmetric and Q-switched.
5.6.2
Dynamics of melting and solidification
Having investigated the effect of pulse shaping on the surface temperature evolution, the melting and solidification dynamics for the various pulse shapes are now studied. The melting and solidification dynamics are first studied for the Gaussian pulse shape before comparing the dynamics for different pulses. To illustrate the dynamics of laser-induced melting and solidification of silicon wafer, the melt depth, the surface temperature (where equal to and above the melting point), and melt-front velocity, i.e. propagation of solid-liquid interface into the wafer, are presented in Fig. 5.8 for the Gaussian pulse shape and the laser fluence of 1.6 J/cm2 . As can be seen, the melt front progresses in three stages, which are discussed below.
Stage 1
When surface temperature of the wafer reaches the melting point, TM , the melt front, the solid-liquid phase boundary y = γ(t), starts to propagate from the surface into the depth of the wafer with a velocity given by,
v(t) =
dy . dt
(5.8)
113
5.6 Results and discussions
The temperature at the solid-liquid interface, y = γ(t), remains constant, and is equal to the melting temperature,
Tl (y = γ(t),t) = Ts (y = γ(t),t) = TM .
(5.9)
Here, Tl and Ts are the liquid and solid phase temperatures at the phase boundary, y = γ(t), respectively. The melt front propagation within the wafer is influenced by the thermal gradient corresponds in the liquid and solid phases, which can be expressed as, dT [y = γ(t)], dy dT = −Ks [y = γ(t)], dy = ρL f v(t).
ql = −Kl qs ql − qs
(5.10) and
(5.11) (5.12)
In this phase, Region 1 in Fig. 5.8a, the melt front propagates into the wafer along with the increasing surface temperature with time. As can be seen in Fig. 5.8a, the melt depth of the wafer varies from γ = 0 at t = tm up to γ = γ0 at t = τ, whereas surface temperature of the wafer varies from the melting temperature TM to the maximum temperature Tmax , which can be seen in Fig. 5.8b. Here, tm and τ denote the time differnce at which the melt front starts to propagate and that at which the temperature reaches to its maximum, respectively, while γ0 is the melt depth when T = Tmax . Due to the rapid rise of surface temperature with time, the thermal gradient increases rapidly, resulting in a high heat flux to the melt front. This, in turn, results in a high melt front velocity in this region, as can be seen in Fig. 5.8c. (The melt-front velocity was post-processed from the simulations by differentiating the melt-front location; this introduced some noise, so the melt-front velocities were smoothed for presentation purposes here and elsewhere in this chapter.) Stage 2
After time t > τ, when the surface temperature starts to decrease, as can be seen in Fig. 5.8b, the melt layer continues to propagate into the wafer, as can be seen in Fig. 5.8a. This is due to the excess enthalpy stored in the melt layer during heating of the wafer. As can be seen in Fig. 5.8a, the melt depth increases from its initial value γ0 up to maximum value of γmax at t = tmax , whereas the surface temperature decreases from maximum value of Tmax to a value of Ts , which can be seen in Fig. 5.8b.
114
Dynamics of laser induced melting and solidification of silicon wafers for solar cells processing In this region, the melt front propagation into the wafer is accompanied by a decrease of surface temperature with time. The melt front velocity decreases along with the decreasing thermal gradient, which is influenced by the rate of surface temperature change. At time t = tmax , the melt front stops, as can be seen in Fig. 5.8c, and the thermal gradient becomes zero at the melt front, i.e. dT /dy = 0.
Stage 3 Finally, at t > tmax re-solidification starts where the melt depth decreases from its maximum value γ = γmax at t = tmax to γ = 0 at t = ts , as can be seen in Region 3 in Fig. 5.8a. Here, ts is the time when complete re-solidification takes place. At this stage, surface temperature of the wafer decreases from Ts to the melting temperature TM , as can be seen in Fig. 5.8b, and the rate of which influences the initial re-solidification velocity, analogous to eq. 5.12 given by, ql − qs = ρL f v(t).
(5.13)
When surface temperature of the wafer falls back to the melting temperature TM , the temperature within melt layer is equalised to the melting temperature, and the melt front continues to move back to the surface until the complete re-solidification occurs. At time ts , the complete re-solidification occurs, and the re-solidification velocity becomes zero, as can be seen in Fig. 5.8a and 5.8c.
115
5.6 Results and discussions
(a) Melting front evolution
(b) Surface temperature as a function of time for T ≥ TM
(c) Melt front velocity
Fig. 5.8 (a) Melting front evolution, (b) corresponding surface temperature profile on and above the melting point, and (c) melt-front velocity as a function of time at the laser fluence of 1.6 J/cm2 , for the Gaussian pulse shape.
116
Dynamics of laser induced melting and solidification of silicon wafers for solar cells processing
The melt front evolution, γ(t), as a function of time for a variety of laser fluence is presented in Fig. 5.9, for the Gaussian pulse shape. As can be seen, the melt front penetrates rapidly into the wafer along with the increasing laser fluences before it recedes back more slowly to the surface. While this occurs, the initial melt depth, γ0 , the maximum melt depth, γmax , and the melting duration increases with the increase of laser fluence, as expected
Fig. 5.9 Melt front evolution as a function of time for a variety of laser fluences for the Gaussian pulse shape. Figure 5.10 shows the melt front evolution as a function of time for the Gaussian, Gate, Weibull, Asymmetric and Q-switched pulse shapes, for the same laser fluence of 1.6 J/cm2 . As can be seen, variation of pulse shape significantly alters the melt front penetration within the wafer. In this case, the Asymmetric pulse results in the highest maximum penetration (with the Gate profile a close second) whilst the Q-switched pulse produces the lowest melting depth amongst all of the pulse shapes. On the contrary, in case of Q-switched pulse shape a higher value of melt duration is obtained compared to the Gaussian, Gate, Asymmetric and Weibull pulse shapes. This can also be seen in Fig. 5.11, in which the melting depth and the melt duration are shown for various pulse shapes, for the same laser fluence of 1.6 J/cm2 .
5.6 Results and discussions
117
Fig. 5.10 Melt front evolution as a function of time for the pulse shapes of Gaussian, Gate, Weibull, Asymmetric, and Q-switched at the same laser fluence and FWHM of 1.6 J/cm2 and 32 ns, respectively.
Fig. 5.11 Melting depth and melt duration for the pulse shapes of Gaussian, Gate, Weibull, Asymmetric, and Q-switched at the same laser fluence and FWHM of 1.6 J/cm2 and 32 ns, respectively.
118
Dynamics of laser induced melting and solidification of silicon wafers for solar cells processing
These alterations of melting depth and melt duration are influenced by the variation of surface temperature evolutions associated with the different pulse shapes. A rapid rise of surface temperature with time induces a high value of thermal gradient at the melt front, which in turn results in an increase of the melt depth along with a fast melt-front velocity. This can be seen in Fig. 5.12, in which the initial melting depth γ0 as a function of heating rate, d(Tmaxdt−TM ) , i.e. rate of temperature change from the melting point TM to the maximum value of Tmax , associated with the various pulse shapes is presented for the same laser fluence of 1.6 J/cm2 . In the case of Gate pulse shape, the thermal gradient at the melt front increases rapidly along with the rapid rise of surface temperature with time, which produces a higher melting depth γ0 along with a fast melt-front velocity compared to those of other pulse shapes. This can also be seen in Fig. 5.13, in which the melt front velocity as a function of time is presented for the various pulse shapes for the same laser fluence of 1.6 J/cm2 . On the contrary, in the case of Q-switched pulse shape, the slow heating rate along with a lower value of maximum surface temperature, compared to the other pulse shapes, results in a low value of thermal gradient at the melt-front, which influences the initial melting depth γ0 and the melt front velocity, as can be seen in Fig. 5.12 and 5.13.
Fig. 5.12 The melt depth γ0 as a function of heating rate associated with the pulse shapes of Gaussian, Gate, Weibull, Asymmetric, and Q-switched at the same laser fluence and FWHM of 1.6 J/cm2 and 32 ns, respectively.
5.6 Results and discussions
119
Fig. 5.13 The melt front velocity as a function of time for the pulse shapes of Gaussian, Gate, Weibull, Asymmetric, and Q-switched at the same laser fluence and FWHM of 1.6 J/cm2 and 32 ns, respectively. As mentioned, after the initial melting depth at the beginning of phase 2, γ0 the melt front further penetrates into the wafer, due to existence of a thermal gradient within the melt layer, until it reaches to the maximum value γmax , and then starts to re-solidify. These processes, i.e. the penetration of the melt front from γ0 to γmax and the re-solidification, are influenced by the cooling rates of the wafer. To investigate the effect of cooling rate on these processes, the increase of melt depth after γ0 , ∆γ = γmax − γ0 , and the duration, ∆tγ = tγ − τ, that the wafer remains at the melted depth of γ0 are shown as a function of cooling rate in Fig. 5.14 associated with the various pulse shapes, for the same laser fluence of 1.6 J/cm2 . Here, tγ is the time at which the melting depth moves back to γ0 from the maximum melting depth of γmax . As can be seen, the melting depth ∆γ and duration ∆tγ increases with the decrease of cooling rate of the wafer. In the case of the Gate pulse shape, the remarkably high cooling rate induces a rapid change of thermal gradient at the melt front, which eventually affects the increase of melting depth ∆γ, and hence generates a high re-solidification velocity, as can be seen in Fig. 5.13. Conversely, in the case of Q-switched pulse shape, the slow cooling rate influences the thermal gradient at the melt front to change gradually. This gradual change of thermal gradient at the melt front takes an active part in further increasing the melting depth ∆γ slowly, which consequently controls the re-solidification velocity, as can be seen in Fig. 5.13. As a result, the wafer stays a longer time at the melted depth of γ0 in the case of Q-switched pulse shape compared to those of other shapes.
120
Dynamics of laser induced melting and solidification of silicon wafers for solar cells processing
Fig. 5.14 The propagation of melt front ∆γ after γ0 and the time that liquid phase remains at a depth of γ0 as a function of cooling rate associated with the pulse shapes of Gaussian, Gate, Weibull, Asymmetric, and Q-switched at the same laser fluence and FWHM of 1.6 J/cm2 and 32 ns, respectively.
5.6.3
Temperature along depth of the wafer
Having investigated the surface temperature evolution and its effect on the melting and solidification dynamics, the temperature distributions within the wafer induced by the various pulse shapes are studied in this section. High temperature gradients in the solid phase are known to induce thermal stress, therefore the focus is on the temperature gradients in the solid phase. Figure 5.15 shows the temperature distributions within the wafer induced by the Gaussian pulse shape for the laser fluence of 1.6 J/cm2 , at the heating times of 34 ns, 55 ns, and 60 ns. As can be seen, the temperature profile decays sharply at the early heating periods, whereas the gradual decay occurs as the heating time progresses. This is because, at the early heating period, the internal energy gain of the wafer is higher compared to those of conduction losses, and consequently more heat is accumulated at the surface vicinity. As the heating time progresses, the temperature differential across the surface vicinity and the region next to the surface vicinity increases, which eventually increases the diffusional energy transport from the surface region. This can also be seen in Fig. 5.16, in which the temperature gradients within the wafer are shown for the heating times of 34 ns, 55 ns and 60 ns. In this, the value of temperature gradient at the surface vicinity, which was high at the early heating periods, decreases along with the increasing heating times. Also, it is worth to observe that, in general, the thermal gradient within the wafer decreases until it reaches to the minimum, and then increases to attain almost zero. In this case, the behaviour of the thermal gradient within the
5.6 Results and discussions
121
wafer may be distinguished into three regions, which are indicated in Fig. 5.16 for the heating time of 55 ns. In the first region, the internal energy gain of the wafer is higher compared to that of diffusional energy transport, i.e. the heat gain dominates the conduction processes. In the second region, where the thermal gradient reaches to the minimum value, an energy balance occurs among the absorbed energy, the internal energy gain, and the diffusional energy transport. The location of this minimum temperature gradient, in general, moves away from the surface as the heating time progresses. In the third region, the diffusional energy transport dominates over the internal energy gain, and hence the thermal gradient increases until it reaches to zero.
Fig. 5.15 Temperature distribution within the depth of the wafer at the heating times of 34 ns, 55 ns and 60 ns at the laser fluence of 1.6 J/cm2 for the Gaussian pulse shape.
122
Dynamics of laser induced melting and solidification of silicon wafers for solar cells processing
Figure 5.17 and 5.18 show the temperature distributions and the associated thermal gradients within the wafer for the Gaussian pulse shape at the heating time of 55 ns, for a variety of laser fluences. As can be seen, as expected, temperature within the wafer increases with the increase of laser fluences, and, consequently, a large value of thermal gradient accumulated at the near surface region.
Fig. 5.16 Temperature gradient within the depth of the wafer at the heating times of 34 ns, 55 ns and 60 ns at the laser fluence of 1.6 J/cm2 for the Gaussian pulse shape.
Fig. 5.17 Temperature distribution within the depth of the wafer at the heating time of 55 ns for a variety of laser fluences for the Gaussian pulse shape.
5.6 Results and discussions
123
Having investigated the temperature distributions within the wafer for the Gaussian pulse shape, the temperature profiles and the associated thermal gradients within the wafer are presented in Fig. 5.19 and 5.20, for the Gaussian, Gate, Weibul, Asymmetric and Qswitchedvarious pulse shapes for the same laser fluence of 1.6 J/cm2 . Here, the temperature profiles and the associated thermal gradientsprofiles within the wafer are shown at times when the wafer starts to melt, and when the solidification ends in Fig. 5.19 and 5.20, respectively. The trends at the beginning of the melting phase shown in Fig. 5.19 are much the same as those earlier reported for the temperature rise rates, as anticipated. The Gate pulse features the highest gradient, corresponding to its rapid deposition of energy, while the Gaussian profile has the lowest gradient. Conversely the Q-switched profile has the lowest temperature gradient 5.20, which could be expected owing to its relatively longer timescale for deposition of energy in the ramp-down phase.
Fig. 5.18 Temperature gradient within the depth of the wafer at the heating time of 55 ns for a variety of laser fluences for the Gaussian pulse shape. As can be seen in Fig. 5.19, when the wafer starts to melt, the temperature within the wafer decays gradually in case of Gaussian pulse shape compared to those of Gate, Weibull, Asymmetric and Q-switched pulsed shapes. Consequently, in the case of Gaussian pulse shape, the thermal gradient at the time of melting is less compared to those of other pulse shapes. This is because, the ramp-up gradient is gradual at the beginning of the pulse in the case of Gaussian pulse shape. The gradual increase of the ramp-up gradient results in a gradual increase of the internal energy gain by the wafer, which eventually provides sufficient time for diffusion of heat from the surface vicinity to the deeper part of the wafer. On the contrary, in the case of Gate pulse shape, the temperature decays sharply within
124
Dynamics of laser induced melting and solidification of silicon wafers for solar cells processing
the wafer compared to those of other pulse shapes. In addition, compared to the Gaussian, Weibull, Asymmetric and Q-switched pulse shapes, the wafer observes a high value of thermal gradient at the near surface region in the case of Gate pulse shape. In this case, the jump-like change in intensity at the leading edge of the Gate pulse shape generates a near surface zone of the maximum temperature gradients, which eventually affects the diffusion of heat from the surface region.
125
5.6 Results and discussions
(a) Temperature within the depth
(b) Gradient within the depth
Fig. 5.19 (a) Temperature distribution, and (b) thermal gradient within the depth of the wafer for the pulse shapes of Gaussian, Gate, Weibull, Asymmetric and Q-switched at time when the solidification ends for the same laser fluence and FWHM of 1.6 J/cm2 and 32 ns, respectively. A different scenario can be observed in decays of the temperature profiles and the associated thermal gradients within the wafer at times when the solidification ends, as can be seen in Fig. 5.20. In this case, compared to the pulse shapes of Gaussian, Gate, Weibull and Asymmetric, temperature decays gradually within the wafer in the case of Q-switched pulse shape. The gradual cooling on the surface of the wafer provides enough time for the absorbed energy to spreads around the wafer. Additionally, the prolonged melting duration,
126
Dynamics of laser induced melting and solidification of silicon wafers for solar cells processing
compared to those of other pulse shapes, takes an active part for the gradual decrease of thermal gradient within the melt layer, which eventually influences the diffusion of more heat into the solid bulk.
(a) Temperature within the depth
(b) Gradient within the depth
Fig. 5.20 (a) Temperature distribution, and (b) thermal gradient within the depth of the wafer for the pulse shapes of Gaussian, Gate, Weibul, Asymmetric and Q-switched at time when the wafer ends to melt for the same laser fluence and FWHM of 1.6 J/cm2 and 32 ns, respectively.
5.7 Concluding remarks
5.7
127
Concluding remarks
In this chapter, the numerical simulations were performed to investigate the effect of pulse shaping on the thermal fields and its impact on the melting and solidification dynamics of the silicon wafers. The numerical simulations were carried out using the developed numerical model, based on the implicit enthalpy method, in OpenFOAM. The silicon wafers were irradiated with the widely used pulse shapes of Gaussian, Gate, Weibull, Asymmetric and Q-switched. It was observed that the temporal variation of laser energy, by means of using these pulse shapes, significantly affected the transient behaviour of the heat transfer phenomena, i.e. the surface temperature, heating and cooling rate, which eventually controls the melting depth and duration as well as the conductive heat losses from the surface of the wafer. This suggests that pulse-shaping could be used to optimise the heat transfer and melting dynamics. This indicates that, in order to optimise the existing pulse system and/or designing of a new pulse shape, the care has to be taken for the distribution of laser energy and hence the controlling of heat transfer phenomena within a single pulse system. The results suggest that if the objective was to achieve a rapid melting and resolidification process with a high melt depth, the Gate pulse would be optimal, since the ramp-up rate is very fast and all of the energy is delivered within a short time window. In contrast, if the objective was to achieve a long melt duration with relatively lower resolidification velocity and solid-phase thermal gradients, the pulses that ramp up quickly but deliver energy more slowly in the latter ramp-down half of the pulse would be beneficial, such as the Q-switched pulse.
Chapter 6 Summary 6.1
Summary of the present work
The primary aim of thesis was to investigate laser-induced heat transfer phenomena in solar cell manufacturing processes. To this end, a detailed numerical heat transfer model was developed in OpenFOAM, an open-source computational fluid dynamics platform written in C++. The developed numerical model was then implemented to investigate laser-induced heat transfer phenomena in three key laser processing steps used in fabrication of solar cells: (1) hydrogen passivation of defects in silicon wafers, (2) laser annealing of a CZTS absorber layer, and (3) pulse laser melting and solidification of silicon wafers.
6.1.1
Development of the methodology
The physical heat transfer and phase change problems arising in the considered laserprocessing operations were first described in chapter 2, and the governing equations presented. Following that, the finite volume solution approach and its implementation in the OpenFOAM framework were explained. To simulate the multi-layer system in the case of the CZTS application, a partitioned approach was employed. In this case, each region was solved separately on its corresponding meshes and the coupling between different regions at the boundaries was implemented using the flux forward, temperature back (FFTB) method. To simulate the melting and solidification dynamics required for the pulse laser melting application, an implicit enthalpy method was developed. Finally, validation of the developed OpenFOAM code was discussed. It was observed that the code performs well, and an excellent agreement was observed between the model and several reference test cases.
130
Summary
6.1.2
Hydrogen passivation
In the first of the considered applications, laser-induced hydrogen passivation of silicon wafers was modelled in chapter 3. Passivation of defects such as crystallographic and boronoxygen (B-O) defects is one the key challenges to fabricate high efficiency silicon wafer based solar cells. Hydrogenation is widely considered to be effective in achieving this task. Laser-processing can be used to heat the wafer, providing a means to release hydrogen from the dielectric layer, diffuse it through the substrate and increase rates of defect passivation. The objective of the chapter was to understand how the laser parameters affect the resulting thermal treatment, and in turn the anticipated passivation levels. A diode laser beam in CW mode was considered to anneal the silicon wafers containing the dielectric layers of SiNx:H. The following were the principal findings: • As anticipated, it was determined that increased laser power, decreased scanning speed, and increased initial temperature all resulted in increased maximum surface temperatures. When the maximum surface temperature was held fixed by varying the scanning speed and laser power at the same time, both lower scanning speeds (requiring higher laser powers) and substrate heating (requiring lower laser power) produced longer exposure times and lower temperature gradients within the wafer. Substrate heating was also demonstrated to produce lower stress arising from thermal expansion mismatch between the silicon wafer and the SiNx layer. • Appropriate combinations of parameters were determined that result in process characteristics in a similar range to those believed to be optimal for conventional belt furnace or RTP methods, which are used to enable hydrogen release and diffusion and to passivate some types of defects such as crystallographic defects. For example for an initially room temperature wafer, to achieve maximum temperatures of ∼1000 K, with exposure time at least 1 s, and with cooling rates in the range 5 K/s to 45 K/s, a laser power of 5.74 × 10⁷ W/m2 and scanning speed 1 mm/s was shown to be appropriate. (For these settings, the peak temperature was ∼1000 K, the exposure time was 1.2 s and the cooling rate was 29 K/s.) This demonstrates the utility of the methodology to determine appropriate laser parameters to achieve given thermal processing characteristics. • Laser parameters were determined to obtain thermal characteristics in the regime required for B-O defect passivation; for example to obtain temperatures around 600 K and dwell time of 20 s, a laser power of 2.41 × 10⁶ W/m2 with FWHM of 2000 µm and scanning speed of 1 mm/s could be employed.
6.1 Summary of the present work
131
• The resulting temperature distributions from the thermal model were coupled with a three-state, four reaction model of B-O the defect complex including rates formation, passivation, dissociation and destabilisation, enabling a prediction of the passivated defect concentrations. This model underlined sensitivities to temperature and processing time, providing hints to optimising a laser-processing regime to achieve rapid and effective passivation.
6.1.3
CZTS absorber layer annealing
CZTS is a promising material for fabrication of the thin film based solar cells. In the processing of these solar cells, thermal treatment of the CZTS absorber layer is required to improve its properties. In chapter 4, laser-induced thermal treatment resulting from CW diode laser annealing of the CZTS thin film deposited on Mo coated glass substrate was investigated. The numerical simulations were performed for a variety of CZTS absorber layer thicknesses, such as 600 nm, 1 µm, and 2 µm, and the effect key annealing parameters on the thermal processes in these absorber layers were investigated. The main conclusions and contributions of this chapter are: 1. Laser power and scanning speeds were first studied for different absorber layer thicknesses. It was observed that the optimal temperature range for crystallisation of CZTS thin films could be obtained using variety of laser power densities and scanning speeds. In general, peak temperatures were increased by higher laser power, lower scanning speed, and thicker absorbers. 2. It was observed that the Mo was approximately isothermal during the annealing, whereas spatial variation of temperatures within the CZTS thin film and the glass substrate were observed. The spatial variation of temperatures within the CZTS film and the substrate were influenced by the CZTS absorber layer thicknesses, with increasing thickness leading to higher temperature gradients. 3. For a constant laser power density and scanning speed, it was found that the thermal stresses within the film and substrate increase with the CZTS absorber layer thicknesses, suggesting that thicker absorber layers are more likely to result in damage during thermal treatment. The stress was highest in the Mo layer. With a laser power of 5.32 kW/m, scanning speed of 100 mm/s and initial temperature of 473 K, the predicted thermal stress in the Mo layer varied from 260 MPa to 380 MPa for thickness of 600 nm to 3 µm, compared with the ultimate strength of 500 MPa. Since delamination
132
Summary probably occurs at stresses lower than the ultimate strength, such high levels of stress in the thicker absorber layers would be concerning.
4. With peak temperature held fixed by simultaneously varying scanning speed and laser power, the annealing time was found to be longer for higher speeds, as expected. Temperature gradients were also decreased with lower scanning speeds. Substrate heating was found to have a similar effect: with peak temperature held fixed by varying laser power, substrate heating increases the annealing time, and decreases temperature gradients and thermal stresses.
6.1.4
Pulse laser-induced melting and solidification
Various solar cell laser-processing operations are influenced by melting and solidification dynamics, such as dopant diffusion, junction formation, and damage removal from the ion-implanted layer. Pulse shaping can be a promising option to control these dynamics, and hence improve the cell’s performance. In chapter 5, the effect of pulse shaping on the thermal fields and its impact on the melting and solidification dynamics was described. The numerical simulations were performed considering the cases in which the silicon wafers were irradiated by five widely used pulse shapes: Gate, Gaussian, Weibull, Asymmetric, and Q-switched. The main conclusions and contributions of this chapter are: 1. It was demonstrated that the transient behaviour of the heat transfer phenomena, parameterised by surface temperature, cooling and heating rate, was significantly influenced by the temporal variation of laser energy within the pulse. In turn, these parameters were demonstrated to have significant effects on the melting and solidification dynamics, as characterised by variables such as the melting duration and depth. 2. The results suggested that if the objective was to achieve a rapid melting and resolidification process with a high melt depth, the Gate pulse would be optimal, since the ramp-up rate is very fast and all of the energy is delivered within a short time window. 3. In contrast, if the objective was to achieve a long melt duration with relatively lower resolidification velocity and solid-phase thermal gradients, the pulses that ramp up quickly but deliver energy more slowly in the latter ramp-down half of the pulse would be beneficial, such as the Q-switched pulse. Overall, the thesis demonstrates that the availability of detailed space- and time-varying profiles of temperature provided by numerical modelling can be a powerful tool in designing and optimising laser-processing methods used in solar cell manufacturing.
6.2 Future works
6.2
133
Future works
During this thesis a number of topics were identified for the future work. Principally, the author suggests that the highest priority should be putting the developed tool in the hands of potential end-users, i.e. those working on development of the technology. Efforts will be made in this direction by the author. It is hoped that the availability of this tool will enable more rapid progress in the design and optimisation of the considered processes, and indeed other related laser-processing fabrication steps. In addition, there are a number of possible directions for improvement of the numerical modelling, outlined below: 1. The hydrogenation study considered a simple approximation for the B-O defect concentrations where the thermal model was not directly coupled to the B-O defect reaction model. To provide a tool that is more useful in the study and optimisation of the hydrogenation, these two models should be coupled. In addition, models for carrier concentration and possibly diffusion of hydrogen in various charge states could be added. 2. The heat transfer phenomena during laser annealing of CZTS thin film based solar cells was examined. In this case, the architecture of the CZTS thin film based solar cells was considered as the CZTS thin film was deposited on the Mo coated glass substrate. The capping layer on top of the CZTS thin film was not considered. The numerical simulation couldan be extended to determine the effect of capping layer on the thermal processes within the CZTS thin film. This will guide further improvement of the CZTS thin film based solar cell architecture. 3. To provide a tool that is more useful to studies of laser doping, at a minimum dopant diffusion needs to be added so that the outcomes for junction formation can be assessed. 4. To provide a tool that is useful for laser material removal such as is the objective in laser grooving, drilling, and edge isolation, and also can occur in laser doping, at a minimum a model of ablation should be added. In some circumstances, fluid flow effects, driven by recoil forces arising from ablation could also be important. Modelling this would require a free-surface CFD model of the liquid region, and possibly the gas region as well making the modelling a challenging three-phase problem. 5. The heat transfer phenomena during laser annealing of CZTS thin film based solar cells was examined. In this case, the architecture of the CZTS thin film based solar cells was considered as the CZTS thin film was deposited on the Mo coated glass
134
Summary substrate. The capping layer on top of the CZTS thin film was not considered. The numerical simulation can be extended to find out the effect of capping layer on the thermal processes within the CZTS thin film. This will guide for further improvement of the CZTS thin film based solar cells architecture.
References [1] USEIA, US Energy information Administration. https://www.eia.gov/ last assessed April 20, 2016, 2016. [2] IPCC, Intergovernmental panel on climate Change. http://www.ipcc.ch/ last assessed April 20, 2016, 2016. [3] G. Spiro, Chemistry of the environment. Prentice Hall, 2003. [4] IPCC, Fourth assessment report (AR4). IPCC Cambridge United Kingdom and New York, USA, 2007. [5] A. Brandt and A. Farrell, “Scrapping the bottom of the barrel: greenhouse gas emission consequences of a transition to low-quality and synthetic petroleum resources,” Climatic Change, vol. 84, no. 3-4, pp. 241–263, 2007. [6] I. Fraunhofer, Current and future costs of photovoltaics: Long term scenarios for market development, system prices and LCOE of utility-scale PV systems. IFraunhofer ISE„ 2015. [7] BP, Statistical review of world energy historical data workbook BP. BP, 2015. [8] SPE, Global market outlook for solar power 2015-2019. Solar Power Europe, 2015. [9] DB, 2014 outlook: let the second gold rush begin. Deutsche Bank Market Research, 2014. [10] M. Green, Commercial Progress and Challenges. Nature Energy, 2016. [11] S. Wenham, M. Green, M. Watt, and R. Corkish, Applied Photovoltaics. Earthscan, UK, 2007. [12] A. Niyibizi, B. Ikua, P. Kioni, and P. Kihato, “Laser material processing in crystalline solar photovoltaic,” Proceedings of the Mechanical Engineering Conference on Sustainable Research and Innovation, vol. 4, pp. 69–74, 2012. [13] R. Hendel, B. Lehner, and C. Ruttimann, “Faster and reliable joining of solar cells biwavelength laser welding for photovoltaic module integration,” Laser Technik Journal, vol. 9, no. 1, pp. 20–23, 2012. [14] D. Carlson, “Laser processing of solar cells,” Proceeding of SPIE, vol. 8473, pp. 1–8, 2012.
136
References
[15] C. Dunsky, “The promise of solar energy: applications and opportunities for laser processing in the manufacturing of solar cells,” Proceeding of SPIE, vol. 6459, pp. 1– 12, 2012. [16] B. Hallam, S. Wenham, H. Lee, E. Lee, H. Lee, J. Kim, and J. Shin, “Effect of edge junction isolation on the performance of laser doped selective emitter solar cells,” Solar Energy Materials and Solar Cells, vol. 95, no. 12, pp. 3557 – 3563, 2011. [17] S. Wenham, C. Honsberg, and M. Green, “Buried contact silicon solar cells,” Solar Energy Materials and Solar Cells, vol. 34, no. 1–4, pp. 101 – 110, 1994. [18] U. Besu-Vetrella, L. Pirozzi, E. Salza, G. Ginocchietti, F. Ferrazza, L. Ventura, A. Slaoui, and J. C. Muller, “Large area, screen printed silicon solar cells with selective emitter made by laser over doping and rta spin-on glasses,” Proceedings of the 26th IEEE Photovoltaic Specialists Conference, pp. 135–138, Sep 1997. [19] M. Abbott and J. Cotter, “Optical and electrical properties of laser texturing for highefficiency solar cells,” Progress in Photovoltaics: Research and Applications, vol. 14, no. 3, pp. 225–235, 2006. [20] A. Knorz, M. Peters, A. Grohe, C. Harmel, and R. Preu, “Selective laser ablation of sinx layers on textured surfaces for low temperature front side metallizations,” Progress in Photovoltaics: Research and Applications, vol. 17, no. 2, pp. 127–136, 2009. [21] L. Song, A. Wenham, S. Wang, P. Hamer, M. S. Ahmmed, B. Hallam, L. Mai, M. Abbott, E. R. Hawkes, C. M. Chong, and S. Wenham, “Laser enhanced hydrogenation passivation of silicon wafers,” International Journal of Photoenergy, vol. 2015, no. 193892, pp. 1–13, 2015. [22] M. S. Ahmmed, M. Talei, E. R. Hawkes, L. Song, and S. Wenham, “Thermal simulation of laser annealing for hydrogenation of c-si in silicon solar cells,” Proceedings of 52nd Annual Conference of the Australian Solar Council, Melbourne, Australia, 2014, pp. 1–10, 2014. [23] P. Baeiri, S. Campisano, G. Foti, and E. Rimini, “A melting model for pulsed laser annealing of implanted semiconductors,” Journal of Applied Physics, vol. 50, pp. 778– 797, 1979. [24] A. Barhdadi, B. Hariti, and J. Muller, “Active defects generated in silicon by laser doping process,” The African Review of Physics, vol. 6, no. 0027, pp. 229–238, 2011. [25] E. Fogarassy, R. Stuck, J. Grob, and P. Siffert, “Silicon solar cells realized by laser induced diffusion of vacuum deposited dopants,” Journal of Applied Physics, vol. 52, pp. 1076–1082, 1981. [26] Z. Hameiri, T. Puzzar, L. Mai, A. Sproul, and S. Wenham, “Laser induced defects in laser doped solar cells,” Progress in Photovoltaic, vol. 19, no. 4, pp. 391–405, 2011. [27] J. Narayan, R. T. Young, and R. Wood, “p-n junction formation in boron-deposited silicon by laser induced diffusion,” Applied Physics Letters, vol. 33, pp. 338–340, 1978.
References
137
[28] J. Poate and J. Mayer, Laser annealing of semiconductors. Academic Press, 1982. [29] R. Young, R. Wood, J. Narayan, and R. Wood, “Electrical and structural characteristics of laser-induced epitaxial layers in silicon,” Applied Physics Letters, vol. 35, pp. 447– 479, 1979. [30] T. Sameshima and S. Usui, “Laser beam shaping system for semiconductor processing,” Optics Communications, vol. 88, pp. 59–62, 1992. [31] A. Hauser, G. Hahn, M. Spiegel, H. Feist, O. Breitenstein, J. Rakotoniaina, P. Fath, and E. Bucher, “Comparison of different techniques for edge isolation,” 17th European Photovoltaic Solar Energy Conference, pp. 1739–1742, 2001. [32] K. Stolberg, P. Oesterlin, and G. Eberhardt, New Lasers Advance Efficiency and Manufacture of Silicon Wafer Based Photovoltaic in Solar Cells. Penn Well Publishing, 2010. [33] A. Compann, I. Matulionis, and S. Nakade, “Laser scribbing of polycrystalline thin films,” Optics Laser Engineering, vol. 34, no. 1, pp. 14–45, 2000. [34] M. Rekow, R. Murison, C. Dinkel, T. Panarello, S. Nikumb, and W. Sampath, “CIGS P1, P2, P3 scribbing processes using a pulse programmable industrial fiber laser,” 35 IEEE Photovoltaic Specialists Conference, pp. 179–174, 2010. [35] N. Kim, C. Park, and H. Lee, “Microstructure, stress and optical properties of cdte thin films laser annealed by using an 808-nm diode laser; effect of the laser scanning velocity,” Journal of Korean Physical Society, vol. 63, no. 2, pp. 229–235, 2013. [36] J. Dore, D. Ong, S. Varlamov, R. Egan, and M. Green, “Progress in laser crystallised thin film poly-crystalline silicon solar cells: intermediate layers, light trapping, and mettalization,” IEEE Journal of Photovoltaics, vol. 4, no. 1, pp. 33–39, 2014. [37] E. Schneller, N. Dhere, and A. Kar, “Overview of laser processing in solar cell fabrication,” Proceedings of SPIE, vol. 9180, no. 918002, pp. 1–10, 2014. [38] M. Pinarbarsi, S. Aksu, J. Freitag, T. Boone, H. Zolla, J. Vasquez, D. Nayak, E. Lee, T. Wang, J. Abushama, and B. Meting, “Flexible cells and modules produced using roll-to-roll electroplating approach,” 35 IEEE Photovoltaic Specialists Conference, pp. 000169–000174, 2010. [39] A. Matsuno, “Pulse duration effect on laser anneal shallow junction,” Proceedings of the 2nd International Semiconductor Technology Conference, vol. 2002-17, pp. 148– 156, 2002. [40] R. Young, R. Wood, and J. Narayan, “Pulsed laser techniques for solar cells processing,” IEEE Transactions of electron devices, vol. 27, no. 4, pp. 807–815, 1980. [41] J. Muller, E. Fograssy, D. Salles, R. Stuck, and P. Siffert, “Laser processing in the preparation of silicon solar cells,” IEEE Transactions of electron devices, vol. 27, no. 4, pp. 815–821, 1980.
138
References
[42] S. Wenham, “Buried-contact silicon solar cells,” Progress in Photovoltaics, vol. 1, no. 1, pp. 3–10, 1993. [43] J. Benton, C. Doherty, S. Ferris, D. Flamm, D. Kimberling, and H. Leamy, “Hydrogen passivation of point defects in silicon,” Applied Physics Letters, vol. 36, no. 8, pp. 670– 671, 1980. [44] M. Flemings, Solidification Processing. New York, N.Y.: McGraw-Hill Inc., 1974. [45] S. Kou, Welding Metallurgy. John Wiley & Sons, 1987. [46] W. Kurz and D. Fisher, Fundamentals of Solidification. 3rd Ed. Aedermannsdorf, Switzerland: Trans Tech Publications, 1992. [47] F. Liu, K. Sun, W. Li, C. Yan, H. Cui, L. Jiang, X. Hao, and M. A. Green, “Enhancing the Cu2ZnSnS4 solar cell efficiency by back contact modification: Inserting a thin TiB2 intermediate layer at Cu2ZnSnS4/Mo interface,” Applied Physics Letters, vol. 104, no. 5, pp. –, 2014. [48] M. Toulemonde, S. Unamuno, R. Heddache, M. Lampert, M. Hage-Ali, and P. Siffert, “Time resolved reflectivity and melting depth measurements using pulsed ruby laser on silicon,” Applied Physics A, vol. 36, pp. 31–36, 1985. [49] R. Wood and G. Geist, “Modelling of non equilibrium melting and solidification in laser-irradiated materials,” Physical Review B, vol. 34, pp. 2606–2619, 1986. [50] S. Zhvavyi and G. Ivlev, “Influence of the initial temperature of silicon on crystallization of a layer melted by nanosecond laser heating,” Journal of Engineering Physics and Thermophysics, vol. 69, no. 5, pp. 608–611, 1996. [51] R. Hall, “Electron-hole recombination in germanium,” Physical Reviews, vol. 87, no. 2, pp. 387–387, 1952. [52] M. Rahman and S. Khan, “Advances in surface passivation of c-si solar cells,” Materials for Renewable and Sustainable Energy, vol. 1, no. 1, pp. 1–11, 2012. [53] W. Shockley and W. Read, “Statistics of the re-combinations of holes and electrons,” Physical Reviews, vol. 87, no. 2, pp. 835–842, 1952. [54] N. Nickel, N. Johnson, and W. Jackson, “Hydrogen passivation of grain boundary defects in ploycrystalline silicon thin films,” Applied Physics Letters, vol. 62, no. 25, pp. 3285–3287, 1993. [55] S. Pearton and A. Tavendale, “Hydrogen passivation of gold-related deep levels in silicon,” Physical Review B, vol. 26, no. 12, pp. 7105–7108, 1982. [56] J. I. Hanoka, C. H. Seager, D. J. Sharp, and J. K. G. Panitz, “Hydrogen passivation of defects in silicon ribbon grown by edge-defined film-fed growth process,” Applied Physics Letters, vol. 42, no. 7, pp. 618–620, 1983. [57] C. Seager and D. Ginley, “Passivation of grain boundaries in ploycrystalline silicon,” Applied Physics Letters, vol. 34, no. 5, pp. 337–340, 1979.
References
139
[58] R. Bousbih, W. Dimassi, I. Haddadi, S. Slema, P. Rava, and H. Ezzaouia, “Silicon lifetime enhancement by SiNx:H anti-reflection coating deposed by PECVD using SiH4 and N2 reactive gas,” Solar Energy, vol. 86, no. 5, pp. 1300–1305, 2012. [59] M. Stavola, F. Jiang, A. Rhotagi, J. Holt, H. Atwater, and J. Kalejs, “Hydrogenation of Si from SiNx:H films: how much hydrogen is really in the Si,” 3rd World Conference on Photovoltaic Energy Conversion, Osaka, Japan, 2003, 2003. [60] C. Seager and R. Anderson, “Real-time observations of hydrogen drift and diffusion in silicon,” Applied Physics Letters, vol. 53, pp. 1181–1183, 1986. [61] F. Jiang, M. Stavola, A. Rohatgi, D. Kim, J. Holt, H. Atwater, and J. Kalejs, “Hydrogenation of Si from SiNx(H) films: Characterization of H introduced into the Si,” Applied Physics Letters, vol. 83, no. 5, pp. 931–933, 2003. [62] B. Sopori, X. Deng, J. Benner, J. Rohatgi, P. Sana, S. Estreicher, Y. Park, and M. Roberson, “Hydrogen in silicon: A discussion of diffusion and passivation mechanisms,” Solar Energy Materials and Solar Cells, vol. 41, no. 42, pp. 159–169, 1996. [63] R. Hezel and R. Schoerner, “Plasma silicon nitride- a promising dielectric to achieve high-quality silicon MIS/IL solar cells,” Journal of Applied Physics, vol. 52, no. 4, pp. 3076–3079, 1981. [64] A. Rohatgi, P. Doshi, J. Moschner, T. Lauinger, A. G. Aberle, and D. Ruby, “Comprehensive study of rapid, low-cost silicon surface passivation technologies,” IEEE Transactions on Electron Devices, vol. 47, no. 5, pp. 987–993, 2000. [65] A. Aberle, “Overview on sin surface passivation of crystalline silicon solar cells,” Solar Energy Materials and Solar Cells, vol. 65, no. 1, pp. 239–248, 2001. [66] F. Duerinckx and J. Szlufcik, “Defect passivation of industrial multicrystalline solar cells based on PECVD silicon nitride,” Solar Energy Materials and Solar Cells, vol. 72, no. 1-4, pp. 231–246, 2002. [67] B. Hallam, A. Sugianto, L. Mai, G. Xu, C. Chan, M. Abbott, S. Wenham, A. Uruena, E. Cornagliotti, and M. Aleman, “Hydrogen passivation of laser induced defects for laser doped silicon solar cells,” IEEE Journal of Photovoltaics, vol. 4, no. 6, pp. 1413–1420, 2014. [68] A. Rohatgi, V. Yelundur, J. Jeong, A. Ebong, M. Rosenblum, and J. Hanoka, “Fundamental understanding and implementation of al-enhanced PECVD SiNx hydrogenation in silicon ribbons,” Solar Energy Materials and Solar Cells, vol. 74, no. 1–4, pp. 117 – 126, 2002. [69] V. Yelundur, A. Rohatgi, J. Jeong, A. Gabor, J. Hanoka, and R. Wallace, “PECVD SINx induced hydrogen passivation in string ribbon silicon,” Proceedings of the 28th IEEE Photovoltaic Specialists Conference, pp. 91–94, Dec 2000. [70] J. Jiang, H. Lindelov, L. Gerward, K. Staahl, J. Recio, S. Mori, S. Carlson, M. Mezouar, E. Dooryhee, A. Fitch, and D. Frost, “Compressibility and thermal expansion of cubic silicon nitride,” Physical Review B, vol. 65, p. 161202, 2002.
140
References
[71] B. J. Hallam, S. Wenham, P. Hamer, M. Abbott, A. Sugianto, C. Chan, A. Wenham, M. Eadie, and G. Xu, “Hydrogen passivation of B-O defects in czochralski silicon,” Energy Procedia, vol. 38, pp. 561–570, 2013. [72] B. J. Hallam, P. Hamer, S. Wenham, M. Abbott, A. Sugianto, A. Wenham, C. Chan, G. Xu, J. Kraiem, J. Degoulange, and R. Einhaus, “Advanced bulk defect passivation for silicon solar cells,” IEEE Journal of Photovoltaics, vol. 4, no. 1, pp. 88–95, 2014. [73] H. Katagiri, N. Sasaguchi, S. Hando, S. Hoshino, J. Ohashi, and T. Yokota, “Preparation and evaluation of Cu2ZnSnS4 thin films by sulfurization of eb evaporated precursors,” Solar Energy Materials and Solar Cells, vol. 49, no. 1–4, pp. 407 – 414, 1997. [74] S. Seol, S. Lee, J. Lee, H. Nam, and K. Kim, “Electrical and optical properties of Cu2ZnSnS4 thin films prepared by rf magnetron sputtering process,” Solar Energy Materials and Solar Cells, vol. 75, no. 1–2, pp. 155 – 162, 2003. [75] K. Tanaka, N. Moritake, and H. Uchik, “Preparation of thin films by sulfurizing sol–gel deposited precursors,” Solar Energy Materials and Solar Cells, vol. 91, no. 13, pp. 1199 – 1201, 2007. [76] J. Chen, D. Yang, Z. Xi, and T. Sekiguchi, “Electron-beam-induced current study of hydrogen passivation on grain boundaries in multicrystalline silicon: Influence of GB character and impurity contamination,” Physica B: Condensed Matter, vol. 364, no. 1–4, pp. 162 – 169, 2005. [77] P. Fernandes, P. Salomé, and A. Cunha, “Precursors’ order effect on the properties of sulfurized Cu2ZnSnS4 thin films,” Semiconductor Science and Technology, vol. 24, no. 10, pp. 105013:1–7, 2009. [78] J. P. Leitão, N. M. Santos, P. A. Fernandes, P. M. P. Salomé, A. F. da Cunha, J. C. González, G. M. Ribeiro, and F. M. Matinaga, “Photoluminescence and electrical study of fluctuating potentials in Cu2ZnSnS4-based thin films,” Phys. Rev. B, vol. 84, p. 024120, 2011. [79] X. Song, X. Ji, M. Li, W. Lin, X. Luo, and H. Zhang, “A review on development prospect of czts based thin film solar cells,” International Journal of Photoenergy, vol. 2014, pp. 1–11, 2014. [80] M. Byeon, E. Chung, J. Kim, T. Hong, J. Jin, E. Jeong, J. Bae, Y. Kim, S. Park, W. Oh, Y. Huh, S. Chang, S. Lee, I. Jung, and J. Hwang, “The effects for the deposition temperature onto the structural, compositional and optical properties of pulsed laser ablated Cu2ZnSnS4 thin films grown on soda lime glass substrates,” Thin Solid Films, vol. 546, pp. 387 – 392, 2013. [81] X. Wang, S. Li, W. Kim, S. Yoon, V. Craciun, J. Howard, S. Easwaran, O. Manasreh, O. Crisalle, and T. Anderson, “Investigation of rapid thermal annealing on Cu(In,Ga)Se2 films and solar cells,” Solar Energy Materials and Solar Cells, vol. 90, no. 17, pp. 2855 – 2866, 2006.
References
141
[82] K. Siemer, J. Klaer, I. Luck, J. Bruns, R. Klenk, and D. Bräunig, “Efficient CuInS2 solar cells from a rapid thermal process (RTP),” Solar Energy Materials and Solar Cells, vol. 67, no. 1–4, pp. 159 – 166, 2001. [83] L. Oliveira, T. Todorov, E. Chassaing, D. Lincot, J. Carda, and P. Escribano, “CIGSS films prepared by sol–gel route,” Thin Solid Films, vol. 517, no. 7, pp. 2272 – 2276, 2009. [84] V. Probst, J. Palm, S. Visbeck, T. Niesen, R. Tölle, A. Lerchenberger, M. Wendl, H. Vogt, H. Calwer, W. Stetter, and F. Karg, “New developments in Cu(In,Ga)(S,Se)2 thin film modules formed by rapid thermal processing of stacked element layers,” Solar Energy Materials and Solar Cells, vol. 90, no. 18–19, pp. 3115–3123, 2006. [85] K. Maeda, K. Tanaka, Y. Fukui, and H. Uchiki, “Dependence on annealing temperature of properties of Cu2ZnSnS4 thin films prepared by sol-gel sulfurization method,” Japanese Journal of Applied Physics, vol. 50, pp. 01BE10:1–5, 2011. [86] M. Ametowobla, B. Esturo, J. Kohler, and J. Werner, “Laser processing of crystalline silicon solar cells,” 31 IEEE Photovoltic Specialists Conference, pp. 1277–1280, 2005. [87] B. Ester, M. Ametowobla, J. Kohler, and J. Werner, “Laser doping for crystalline solar cell emitters,” 20 European Photovoltaic Solar Energy Conference, pp. 851–854, 2005. [88] V. Besi, G. Arabito, V. Barbarossa, E. Salza, F. Artuso, M. Grilli, M. Belardinelli, and L. Priozzi, “A novel method to get localized bsf in silicon solar cells,” 2nd World Conference and Exhibition on Photovoltaic Solar Energy Conversion, pp. 1562–1565, 1998. [89] Z. Hameiri, Laser-doped selective emitter and local back surface field solar cells with rear passivation. PhD Thesis, The University of New South Wales, Sydney, AUS, 2010. [90] B. Tjahjono, J. Guo, Z. Hameiri, L. Mai, A. Sugianto, S. Wang, and S. Wenham, “High efficiency solar cells structures through the use of laser doping,” 22nd European Photovoltaic Solar Energy Conference, pp. 966–969, 2007. [91] M. Abott, J. Cotter, and K. Fisher, “N-type bifacial solar cells with laser doped contacts,” 4th IEEE World Conference on Photovoltaic Energy Conversion, pp. 988– 991, 2006. [92] L. Mai, Z. Hameiri, B. Tjahjono, S. Wenham, A. Sugianto, and M. Edwards, “Rear junction laser doped solar cells on Cz n-type silicon,” 34th IEEE Photovoltaic Specialists Conference, pp. 1811–1815, 2009. [93] H. Weller, G. Tabor, H. Jasak, and C. Fureby, “A tensorial approach to computational continuum mechanics using object oriented programming,” Computers in Physics, vol. 12, no. 6, pp. 620–631, 1998. [94] D. Bauerle, Laser processing and Chemistry. 3rd Edition, Springer-Verlag, Berlin, 2000.
142
References
[95] M. Allmen, Laser beam interactions with materials: Physical principles and applications. Springer-Verlag, Berlin, 1987. [96] W. Steen, Laser Material Processing. Springer, London, 1991. [97] L. R. Migliore, Laser Materials Processing. Marcel Dekker Inc, New York, USA, 1996. [98] V. Voller, “Fast implicit finite difference method for the analysis of phase change problems,” Numerical Heat Transfer, Part B: Fundamentals, vol. 17, no. 2, pp. 155– 169, 1990. [99] D. Rosenthal, The theory of moving sources of heat and its application of metal treatments. ASME, 1946. [100] C. Grigoropoulos, R. Buckholz, and G. Domoto, “A heat transfer algorithm for the laser-induced melting and recrystallization of thin silicon layers,” Journal of Applied Physics, vol. 60, pp. 2304–2309, 1986. [101] R. Santbergen and R. v. Zolingen, “The absorption factor of crystalline silicon PV cells: A numerical and experimental study,” Solar Energy Materials and Solar Cells, vol. 92, no. 4, pp. 432–444, 2008. [102] A. Fell, D. Kray, and G. Willeke, “Transient 3D/2D simulation of laser-induced ablation of silicon,” Applied Physics A, vol. 92, no. 4, pp. 987–991, 2008. [103] E. Hecht, Optics. Addison Wiley, San Fransisco, 4th Edn., 2002. [104] H. Macleod, Thin-film optical filters. Adam Hilger Ltd, Bristol,2 ed., 1986. [105] J. Ferziger and M. Peric, Computational methods for fluid dynamics. Springer, Berlin, Germany, 1996. [106] F. Moukalled, L. Mangani, and M. Darwish, The Finite Volume Method in Computational Fluid Dynamics: An Advanced Introduction with OpenFOAM and Matlab. Springer, 2015. [107] H. Versteeg and W. Malalasekera, An Introduction to Computational Fluid Dynamics. Longman Scientific and Technical, 1995. [108] Y. Saad, Iterative methods for sparse linear systems. Society for Industrial and Applied Mathematics, 2nd Ed., 2003. [109] B. Gschaider, swak4Foam. openfoamwiki.net/index.php/Contrib/swak4Foam, 2010. [110] E. Divo, E. Steinthorsson, F. Rodriguez, A. Kassab, and J. Kapat, “Glenn HT/BM conjugate heat transfer solver for large scale turbo machinery models,” NASA Gleen Rearch Center, NASA/CR, vol. 13, no. 4, pp. 403–414, 2009. [111] W. Minkowycz and E. Sparrow, Computational Fluid Dynamics with Moving Boundaries. Taylor and Francis, 1996.
References
143
[112] A. Hassan, M. El-Nicklway, M. El-Adawi, and A. Hemida, “A general problem of pulse laser heating of a slab,” Optics and Laser Technology, vol. 25, no. 3, pp. 155–162, 1993. [113] R. A. Ghez and R. A. Laff, “Laser heating and melting of thin films on low conductivity substrates,” Journal of Applied Physics, vol. 46, no. 5, pp. 2103–2110, 1975. [114] M. ElAdawi and E. Elshehawey, “Heating a slab induced by a time-dependent laser irradiance-an exact solution,” Journal of Applied Physics, vol. 60, no. 1, pp. 2250– 2255, 1986. [115] H. Carslaw and J. Jaeger, Conduction of heat in solids. Clarendon Oxford, 1959. [116] J. Ready, “Effects due to absorption of laser radiation,” Journal of Applied Physics, vol. 36, no. 2, pp. 462–468, 1965. [117] S. Zubair and M. Chaudhury, “Heat conduction in a semi-infinite solid due to timedependent laser source,” International Journal of Heat and Mass Transfer, vol. 39, no. 14, pp. 3067–3074, 1996. [118] S. Zubair and M. Chaudhury, “Heat conduction in a semi-infinite solid when subjected to spatially decaying instantaneous laser source,” Warme-und Stoffubertragung, vol. 28, pp. 425–431, 1993. [119] C. Swaminathan and V. Voller, “A general enthalpy method for modelling solidification processes,” Metallurgical Transactions B, vol. 23 B, no. 5, pp. 651–664, 1992. [120] S. D. Unamuno and E. Fogarassy, “A thermal description of the melting of c- and a-silicon under pulsed excimer lasers,” Applied Surface Science, vol. 36, no. 1-4, pp. 1–11, 1989. [121] M. Aziz, C. White, J. Narayan, and B. Stritzker, “Melting of crystalline and amorphous silicon by ruby, xecl and krf laser irradiation,” in: Proceedings of E-MRS, pp. 231–236, 1985. [122] S. Sze, Physics of semiconductor devices. John Wiley and Sons, New York, 1981. [123] S. Earles, Nonmelt laser annealing of boron implanted silicon. The University of Florida, 2002. [124] S. Unamuno, M. Toulemonde, and P. Siffert, Laser processing and diagnostics. Springer, Berlin, 1984. [125] M. A. Green, “Self-consistent optical parameters of intrinsic silicon at 300k including temperature coefficients,” Solar Energy Materials and Solar Cells, vol. 92, no. 11, pp. 1305 – 1310, 2008. [126] A. Goldsmith, T. Waterman, and Hirschhhorn, Handbook of Thermophysical properties of solid materials. Pergamon, New York, 1961. [127] V. Glasov, S. Chizhevskya, and N. Glagoleva, Liquid semiconductor. Pergamon, New York, 1969.
144
References
[128] H. F. W. Dekkers, G. Beaucarne, M. Hiller, H. Charifi, and A. Slaoui, “Molecular hydrogen formation in hydrogenated silicon nitride,” Applied Physics Letters, vol. 89, no. 21, pp. 211914:1–3, 2006. [129] A. Aberle, “Overview on sin surface passivation of crystalline silicon solar cells,” Solar Energy Materials and Solar Cells, vol. 65, no. 1-4, pp. 239–248, 2001. [130] J. Hong, W. Kessels, W. Scope, A. Weeber, W. Arnoldbik, and M. V. D. Sanden, “Influence of the high-temperature firing step on high-rate plasma deposited silicon nitride films used as bulk passivating antireflection coatings on silicon solar cells,” Journal of Vaccum Science and Technology B, vol. 21, pp. 2123–2132, 2013. [131] J. Guangzhi, L. Honggang, and C. Hudong, “Annealing optimization of hydrogenated amorphous silicon sub-oxide film for solar cell application,” Journal of Semiconductors, vol. 32, no. 5, pp. 052002:1–3, 2011. [132] C. Dubé and J. I. Hanoka, “Hydrogen passivation of dislocations in silicon,” Applied Physics Letters, vol. 45, no. 10, pp. 1135–1137, 1984. [133] F. J. Stützler and H. J. Queisser, “Charged defect states at silicon grain boundaries,” Journal of Applied Physics, vol. 60, no. 11, pp. 3910–3915, 1986. [134] G. Hahn and A. Schonecker, “New crystalline silicon ribbon materials for photovoltaics,” Journal of Physics: Condensed Matter, vol. 16, no. 50, pp. 1615–1648, 2004. [135] R. Ludemann, “Hydrogen passivation of multicrystalline silicon solar cells,” Materials Science and Engineering B, vol. 58, no. 1, pp. 86–90, 1999. [136] W. Soppe, H. Rieffe, and A. Weeber, “Bulk and surface passivation of silicon solar cells accomplished by silicon nitride deposited on industrial scale by microwave PECVD,” Progress in Photovoltaic Research and Application, vol. 13, no. 7, pp. 551–569, 2005. [137] R. Einhaus, F. Duerinckx, E. Van Kerschaver, J. Szlufcik, P. Durand, F. and. Ribeyron, J. Duby, D. Sarti, G. Goaer, and G. A. Le, “Hydrogen passivation of newly developed EMC-multi-crystalline silicon,” Materials Science and Engineering B, vol. 58, no. 1, pp. 81–85, 1999. [138] A. Tavendale and S. Pearton, “Deep level, quenched-in defects in silicon doped with gold, silver, iron, copper or nickel,” Journal of Physical Chemistry:Solid State Physics, vol. 16, no. 9, pp. 1665–1673, 2000. [139] K. Munzer, “Hydrogenated silicon nitride for regeneration of light induced degradation,” Proceedings of 24 European Photovoltaic Solar Energy Conference Hamburg Germany, pp. 1558–1561, 2009. [140] G. Krugel, W. Wolke, J. Geilker, S. Rein, and R. Preu, “Impact of hydrogen concentration on the regeneration of light induced degradation,” Energy Procedia, vol. 38, pp. 561–570, 2013.
References
145
[141] S. Wenham, P. Hamer, B. Hallam, A. Sugianto, C. Chan, L. Song, P. Lu, A. Wenham, L. Mai, C. Chong, G. Xu, and M. Edwards, “Advanced hydrogenation of silicon solar cells,” WO2013173867A1, pp. 0–0, 2013. [142] S. Wilking, A. Herguth, and G. Hahn, “Influence of hydrogen on the regeneration of boron-oxygen related defects in crystalline silicon,” Journal of Applied Physics, vol. 113, no. 19, pp. 1–6, 2013. [143] P. Hamer, B. Hallam, M. Abbott, C. Chan, N. Nampalli, and S. Wenham, “Investigations on accelerated processes for the Boron-Oxygen defect in p-type czochraslski silicon,” Solar Energy Materials and Solar Cells, vol. 145, pp. 440–446, 2016. [144] B. Hallam, M. Abott, N. Nampalli, P. Hamer, and S. Wenham, “Implications of accelerated recombination-active defect complex formation for mitigating carrier induced degradation in silicon,” IEEE Journal of Photovoltaics, vol. 6, no. 1, pp. 92– 99, 2016. [145] V. Wieringen and N. Warmoltz, “On the permeation of hydrogen and helium in single crystal silicon and germanium at elevated temperatures,” Physica, vol. 12, pp. 849–865, 1956. [146] A. Rohatgi and J. Jeong, “High-efficiency screen-printed silicon ribbon solar cells by effective defect passivation and rapid thermal processing,” Applied Physics Letters, vol. 82, no. 2, pp. 224–226, 2003. [147] M. Kemel, M. Ritala, and M. Leskela, “Thin film deposition methods for cuinse2 solar cells,” Solid State, vol. 30, pp. 1–31, 2005. [148] A. Bhatia, H. Meadows, A. Crossay, P. Dale, and M. Scarpulla, “Continuous wave solid phase laser annealing of single-pot electrodepositied CuInSe2 thin films: effects of Cu/In stoichiometry,” Journal of Applied Physics, vol. 114, pp. 044904:1–8, 2013. [149] H. Meadows, D. Regesch, M. Thevenin, J. Sendler, T. Schuler, T. Schuler, S. Misra, B. Simonds, M. Scrapulla, V. Gerliz, L. Gutay, L. Guillot, and P. Dale, “Cuinse2 semiconductor formation by laser annealing,” Thin Solid Films, vol. 582, pp. 23–26, 2015. [150] R. Devine, “Defect reactivation and structural relaxation in deposited amorphous sio2,” Journal of Applied Physics, vol. 70, no. 7, pp. 3542–3550, 1991. [151] S. Glunz and S. Rein, “Analysis of the defect passivation in cz silicon by temperature dependent bias-induced degradation of solar cells,” 3rd World Conference on Photovoltaic Energy Conversion, pp. 919–922, 2003. [152] H. Morikawa, D. Niinobe, K. Nishimura, S. Matsuno, and S. Arimoto, “Processes for over 18.5 percent high-efficiency multi-crystalline silicon solar cell,” Proceedings of the International Renewable Energy Conference and Exhibition, vol. 10, no. 2, pp. s210–s214, 2008.
146
References
[153] B. Hallam, M. Abbott, N. Nampalli, P. Hamer, and S. Wenham, “Influence of the formation and passivation rate of boron-oxygen defects for mitigating carrier induced degradation in silicon within a hydrogen-based model,” Journal of Applied Physics, vol. 119, no. 6, pp. 1–9, 2016. [154] P. Hammer, B. Hallam, S. Wenham, and M. Abbott, “Manipulation of hydrogen charge states for passivation of p-type wafers in photovoltaics,” IEEE Journal of Photovoltaics, vol. 4, no. 5, pp. 1252–1260, 2014. [155] P. Hammer, B. Hallam, A. Wenham, A. Sugianto, M. Abbott, and S. Wenham, “Hydrogen passivation mechanisms in silicon solar cells,” 28th European Photovoltaic Solar Energy Conference and Exhibition, pp. 982–987, 2014. [156] L. Song, L. Mai, and S. Wenham, “Laser induced localised hydrogen passivation,” Solar Energy, vol. 2015, pp. 341–346, 2015. [157] R. Stanowski, O. Voznyy, and J. Dubowski, “Finite element model calculations of temperature profiles in nd: Yag laser annealed gaas/algaas quantum well microstructures,” Journal of Laser Micro/Nanoengineering, vol. 01, no. 1, pp. 17–21, 2006. [158] A. Byelyayev, “Stress diagnostics and crack detection in full-size silicon wafers using resonance ultrasonic vibrations,” Doctoral Dissertation in Electrical Engineering, University of South Florida: Tampa, FL, 2005, 2005. [159] P. Hamer, B. Hallam, S. Wenham, and M. Abott, “Manipulation of hydrogen charge states for passivation of p-type wafers in photovoltaics,” IEEE Journal of Photovoltaics, vol. 4, no. 5, pp. 1252–1260, 2014. [160] E. Bonne, V. Sergye, and A. Martin, “Large-area diode laser defect annealing of polycrystalline silicon solar cells,” IEEE Transaction on Electron Devices, vol. 59, pp. 2838–2841, 2012. [161] E. Schneiderlochner, R. Preu, R. Ludemann, and S. Glunz, “Laser fired contacts for crystalline silicon solar cells,” Progress in Photovoltaics: Research and Applications, vol. 10, pp. 29–34, 2001. [162] A. Rohatgi, M. Hilali, and K. Nakayashiki, “High-efficiency screen-printed solar cell on edge-defined film-fed grown ribbon solar through optimized rapid belt co-firing of contacts and high-sheet resistance emitter,” Applied Physics Letters, vol. 84, no. 17, pp. 3409–3411, 2004. [163] B. Hallam, “High efficiency laser-doped silicon solar cells with advanced hydrogenation,” School of Photovoltaic and Renewable Energy Engineering, UNSW Australia, 2014. [164] N. Nampalli, B. Hallam, C. Chan, M. Abbott, and S. Wenham, “Influence of hydrogen on the mechanism of permanent passivation of Boron-Oxygen defects in p-type czochralski silicon,” IEEE Journal of Photovoltaics, vol. 5, no. 6, pp. 1580–1585, 2015.
References
147
[165] B. A. Revermann, M. and J. Meinschien, “Line length scalable high power diode laser with power densities 100 kW/cm2 for industrial si-annealing applications,” Proceedings of Society of Photographic Instrumentation Engineers, vol. 6879, no. 68790R, pp. 1–7, 2008. [166] S. Wen, Y. Tan, S. Shi, W. Dong, D. Jiang, J. Liao, and Z. Zhu, “Thermal contact resistance between the surfaces of silicon and copper crucible during electron beam melting,” International Journal of Thermal Sciences, vol. 74, pp. 37–43, 2013. [167] C. Madhusudana, Thermal Contact Conductance. Springer, 2014. [168] C. Madhusudana, “Thermal contact conductance and rectification at low joint pressures,” International Communication Heat Mass Transfer, vol. 20, pp. 123–132, 1993. [169] M. Yovanovich, J. Culham, and P. Teertsra, Electronics Cooling. In Tech, 2004. [170] S. Mesnyankin, A. Vikulov, and D. Vikulov, “Solid-solid thermal contact problems: current understanding,” Physics-Uspekhi, vol. 52, no. 9, pp. 891–914, 2009. [171] M. Cooper, B. Mikic, and M. Yovanovich, “Thermal contact conductance,” International Journal of Heat and Mass Transfer, vol. 12, pp. 279–300, 1969. [172] I. Savija, M. Yovanovich, and J. Culham, “Thermal joint resistance of conforming rough surfaces with grease-filled interstitial gaps,” Journal of Thermo-physics and Heat Transfer, vol. 17, no. 2, pp. 278–282, 2003. [173] T. Bergman, A. Lavine, F. Incropera, and D. Dewitt, Fundamentals of Heat and Mass Transfer. Wiley, 2011. [174] Y. Ohsone, G. Wu, J. Dryden, F. Zok, and A. Majumder, “Optical measurement of thermal contact conductance between wafer like thin solid samples,” Transaction of ASME, vol. 121, pp. 954–963, 1999. [175] E. Marotta and L. Fletcher, “Thermal contact conductance for aluminum and stainless steel contacts,” Journal of Thermophysics and Heat Transfer, vol. 12, no. 3, pp. 374– 381, 1998. [176] M. Grujicic, C. Zhao, and E. Dusel, “Effect of thermal contact resistance on heat management in the electronic packaging,” Applied Surface Sciences, vol. 246, pp. 290– 302, 2005. [177] A. Herguth and G. Hahn, “Kinetics of the boron-oxygen relate defect in theory and experiment,” Journal of Applied Physics, vol. 108, no. 11, pp. 1–7, 2010. [178] K. Bothe and S. Jan, “Electronically activated boron-oxygen-related recombination centres in crystalline silicon,” Journal of Applied Physics, vol. 66, no. 1, 2006. [179] S. Wilking, C. Beckh, S. Ebert, A. Herguth, and G. Hahn, “Influence of bound hydrogen states on bo-regeneration kinetics and consequences for high speed regeneration processes,” Solar Energy Materials and Solar Cells, vol. 131, pp. 2–8, 2014.
148
References
[180] T. T. Rantala and J. Levoska, “A numerical simulation method for laser induced temperature distribution,” Journal of Applied Physics, vol. 65, no. 12, pp. 4475–4479, 1989. [181] H. W. Lo and A. Compaan, “Raman measurements of temperature during cw laser heating of silicon,” Journal of Applied Physics, vol. 51, no. 3, pp. 1565–1568, 1980. [182] P. Schvan and R. E. Thomas, “Time dependent heat flow calculation of cw laser induced melting of silicon,” Journal of Applied Physics, vol. 57, no. 10, pp. 4738– 4741, 1985. [183] G. E. Jellison and F. A. Modine, “Optical absorption of silicon between 1.6 and 4.7 ev at elevated temperatures,” Applied Physics Letters, vol. 41, no. 2, pp. 180–182, 1982. [184] S. Estreicher and J. Hastings, “Defect-induced dissociation of h2 silicon,” Physical Review B, vol. 12663, pp. 57–59, 1998. [185] N. Fukat, K. Murakami, K. Ishioka, K. Nakamura, M. Kitajima, S. Fujimura, and J. Kikuchi, “Thermal stability of hydrogen molecule in crystalline silicon,” Material Science Forum, vol. 211-216, pp. 258–263, 1997. [186] P. Hamer, B. Hallam, M. Abbott, and S. Wenham, “Accelerated formation of the Boron-Oxygen complex in p-type czochralski silicon,” Physica Status Solidi RRL, pp. 1–4, 2015. [187] B. Gorka, “Hydrogen passivation of polycrystalline si thin film solar cells,” PhD Thesis:Helmholtz-Zentrum Berlin fur Materialien und Energie, Germany, 2011. [188] M. Sheroan, D. Kim, A. Rohtagi, H. Dekkers, G. Beaucarne, M. Young, and M. Asher, “Hydrogen diffusion in silicon from pecvd silicon nitride,” IEEE Photovolatic Specialists Conference, vol. 33, pp. 1–4, 2000. [189] Y. Liu, N. Jehanathan, and J. Dell, “Thermally induced damages of PECVD SiNx films,” Materials Research Society, vol. 26, no. 19, pp. 2552–2557, 2011. [190] C. Hsuch, “Thermal stresses in elastic multilayer systems,” Thin solid films, vol. 418, pp. 182–188, 2002. [191] M. Besland, M. Laeyarde, F. Delmotte, and G. Hollinger, “Interpretation of stress variation in silicon nitride films deposited by electron cyclotron resonance plasma,” Journal of Vacuum Science Technology A, vol. 22, no. 5, pp. 1962–1970, 2004. [192] T. Retajczyk and A. Sinha, “Elastic stiffness and thermal expansion coefficients of various refractory silicides and silicon nitride films,” Thin Solid Films, vol. 70, no. 2, pp. 241–247, 1980. [193] T. Pliewischkies, T. Schmidt, I. Hoger, J. Bergmann, A. Gawlik, G. Andra, and F. Falk, “Thermal stresses and cracking behavior during laser crystallisation of silicon on glass for thin film solar cells,” Physica Status Solidi A, pp. 1–6, 2014. [194] R. B. Gold and J. F. Gibbons, “Calculation of solid phase reaction rates induced by a scanning cw laser,” Journal of Applied Physics, vol. 51, no. 2, pp. 1256–1258, 1980.
References
149
[195] E. Jarzembowski, M. Maiberg, F. Obereigner, and K. Kaufmann, “Optical and electrical characterization of Cu(In,Ga)Se2 thin film solar cells with varied absorber layer thickness,” Thin Solid Films, vol. 576, pp. 75–80, 2015. [196] L. Vauche, J. Dubois, A. Laparre, M. Pasquinelli, S. Bodnar, P. Grand, and S. Jaime, “Rapid thermal processing challenges for large scale cu2znsns4 thin films,” Physica Status Solidi A, vol. 212, no. 1, pp. 103–108, 2015. [197] H. Cui, X. Liu, N. Song, N. Li, F. Liu, and X. Hao, “Impact of rapid thermal annealing of mo coated soda lime glass substrate on device performance of evaporated Cu2ZnSnS4 thin film solar cells,” Materials Letters, vol. 125, pp. 40–43, 2014. [198] S. Vanalakar, S. Shin, G. Agawane, M. Suryawanshi, K. Gurav, P. Patil, and J. Kim, “Effect of post-annealing atmosphere on the grain-size and surface morphological properties of pulsed laser deposited {CZTS} thin films,” Ceramics International: Part B, vol. 40, no. 9, pp. 15097–15103, 2014. [199] S. Shin, S. Pawar, C. Park, J. Yun, J. Moon, J. Kim, and J. Lee, “Studies on Cu2ZnSnS4 (czts) absorber layer using different stacking orders in precursors thin films,” Solar Energy Materials and Solar Cells, vol. 95, pp. 3202–3206, 2011. [200] K. Moriya, K. Tanaka, and H. Uchiki, “Cu2ZnSnS4 thin films annealed in H2S atmosphere for solar cell absorber prepared by pulsed laser deposition,” Japanese Journal of Applied Physics, vol. 47, no. 1, pp. 602–604, 2008. [201] L. Sun, J. He, Y. Chen, F. Yue, P. Yang, and J. Chu, “Comparative study on Cu2ZnSnS4 thin films deposited by sputtering and pulsed laser deposition from a single quaternary sulfide target,” Journal of Crystal Growth, vol. 361, pp. 147–151, 2012. [202] R. Touati, M. Rabeh, and M. Kanzari, “Structural and optical properties of the new absorber Cu2ZnSnS4 thin films grown by vacuum evaporation method,” Energy Procedia, vol. 44, pp. 44–51, 2014. [203] K. Gurav, S. Pawar, S. Shin, M. Suryawanshi, G. Agawane, P. Patil, J. Moon, J. Yun, and J. Kim, “Electrosynthesis of czts films by sulfurization of czt precursor: effect of soft annealing treatment,” Applied Surface Science, vol. 283, pp. 74–80, 2013. [204] V. Akhavan, B. Goodfellow, M. Panthani, C. Steinhagen, T. Harvey, C. Stolle, and B. Korge, “Colloidal cigs and czts nanocrystals: a precursor route to printed photovoltaics,” Journal of Solid State Chemistry, vol. 189, pp. 2–12, 2012. [205] S. Abermann, “Non-vacuum processed next generation thin film photovoltaics: towards marketable efficiency and production of czts based solar cells,” Solar Energy, vol. 94, pp. 37–70, 2013. [206] P. J. Dale, A. P. Samantilleke, G. Zoppi, I. Forbes, and L. M. Peter, “Characterization of CuInSe2 material and devices: comparison of thermal and electrochemically prepared absorber layers,” Journal of Applied Physics D: Applied Physics, vol. 41, no. 8, p. 085105, 2008.
150
References
[207] J. Scragg, L. Choubrac, A. Lafond, T. Ericson, and C. Bjorkman, “A low-temperature order-disorder transition in Cu2ZnSnS4 thin films,” Applied Physics Letters, vol. 104, pp. 041911–041914, 2014. [208] T. Todorov, O. Gunawan, T. Gokemen, and D. Mitzi, “Solution-processed Cu(In,Ga)(S,Se)2 absorber yielding a 15.2% efficient solar cell,” Progress in Photovoltaics, vol. 21, no. 1, pp. 82–87, 2013. [209] P. Joshi and K. Sharma, “Effects of grain boundaries on the performance of polycrystalline silicon solar cells,” Indian Journal of Pure and Applied Physics, vol. 50, pp. 661–669, 2012. [210] M. Venkatachalam, M. Kannan, S. Jayakumar, R. Balasundaraprabhu, and N. Muthukumarasamy, “Effect of annealing on the structural properties of electron beam deposited CIGS thin films,” Thin Solid Films, vol. 516, no. 20, pp. 6848 – 6852, 2008. [211] O. Singh, N. Muhunthan, V. Singh, and B. Singh, “Effect of annealing time on the composition, microstructure, and band gap of copper zinc tin sulphide,” Advanced Material Letters (in press), pp. 0–0, 2015. [212] A. Bhatia, H. Meadows, A. Crossay, P. J. Dale, and M. A. Scarpulla, “Continuous wave solid phase laser annealing of single-pot electrodeposited CuInSe2 thin films: Effects of Cu/In stoichiometry,” Journal of Applied Physics, vol. 114, no. 4, p. 044904, 2013. [213] A. Bhatia, H. Meadows, A. Crossay, P. J. Dale, and M. A. Scarpulla, “Pulsed and continuous wave solid phase laser annealing of electrodeposited CuInSe2 thin films,” Proceedings of SPIE, vol. 8473, no. 84730F, pp. 0–0, 2012. [214] A. Bhatia, P. Dale, M. Nowell, and M. Scarpulla, “Pulsed laser processing of electrodeposited CuInSe2 photovoltaic absorber thin films,” MRS Proceedings (MRS Springs), vol. 1268, pp. 103–109, 2010. [215] A. Bhatia, H. Meadows, W. Oo, P. Dale, and M. Scarpulla, “Pulsed laser processing of electrodeposited CuInSe2 photovoltaic absorber thin films,” Photovoltaic Specialists Conference (PVSC), 2011 37th IEEE, vol. 37, pp. 000329–000332, 2011. [216] C. Hongtao, X. Liu, N. Song, N. Li, F. Liu, and X. Hao, “Impact of rapid thermal annealing of mo coated soda lime glass substrate on device performance of evaporated Cu2ZnSnS4 thin film solar cells,” Materials Letters, vol. 125, pp. 40–43, 2014. [217] S. Pawar, A. Moholkar, I. Kim, S. Shin, J. Moon, J. Rhee, and J. Kim, “Effect of laser incident energy on the structural, morphological and optical properties of Cu2ZnSnS4 (CZTS) thin films,” Current Applied Physics, vol. 10, no. 2, pp. 565 – 569, 2010. [218] T. Ericson, J. S. Jonathan, K. Tomas, T. Tobias, and P. Charlotte, “Annealing behavior of reactively sputtered precursor films for Cu2ZnSnS4 solar cells,” Thin Solid Films, vol. 535, pp. 22 – 26, 2013.
References
151
[219] J. Cha, K. Ashok, N. J. S. Kissinger, Y. Ra, J. Sim, J. Kim, and C. Lee, “Effect of thermal annealing on the structure, morphology, and electrical properties of mo bottom electrodes for solar cell applications,” Journal of the Korean Physical Society, vol. 59, no. 3, pp. 2280–2285, 2011. [220] H. Meadows, D. Regesch, M. Thevenin, J. Sendler, T. Schuler, T. Schuler, S. Misra, B. Simonds, M. Scrapulla, V. Gerliz, L. Gutay, L. Guillot, and P. Dale, “Single second laser annealed cuinse2 semiconductor from electrodeposited precursors as absorber layers for solar cells,” The Journal of Physical Chemistry, vol. 118, pp. 1451–1460, 2014. [221] J. R. Meyer, F. J. Bartoli, and M. R. Kruer, “Optical heating in semiconductors,” Phys. Rev. B, vol. 21, pp. 1559–1568, 1980. [222] M. C. Joliet, C. Antoniadis, R. Andrew, and L. D. Laude, “Laser induced synthesis of thin CuInSe2 films,” Applied Physics Letters, vol. 46, no. 3, pp. 266–267, 1985. [223] M. Joliet, C. Antoniadis, and L. Laude, “Laser-induced synthesis of thin CuInSe2 films,” Thin Solid Films, vol. 126, no. 1–2, pp. 143 – 148, 1985. [224] D. Bhattacharyya, S. Bocking, and M. Carter, “Detection of binary phases in CuInSe2 films formed by laser annealing of stacked elemental layers of in, cu and se,” Journal of Materials Science, vol. 31, no. 20, pp. 5451–5456, 1996. [225] S. Jost, R. Schurr, F. Hergert, R. Hock, J. Schulze, A. Kirbs, T. Vob, M. Purwins, J. Palm, and I. Mys, “The formation of cuinse2 thin-film solar cell absorbers by laser annealing eletrodeposited precursors,” Solar Energy Materials and Solar Cells, vol. 92, pp. 410–417, 2008. [226] G. Chen and C. L. Tien, “Thermally induced optical nonlinearity during transient heating of thin films,” ASME Journal of Heat Transfer, vol. 116, pp. 311–316, 1994. [227] W. Zhao, W. Zhou, and X. Miao, “Numerical simulation of czts thin film solar cell,” 7th IEEE International Conference on Nano/Micro Engineered and Molecular Systems (NEMS), pp. 502–505, 2012. [228] J. Lacombe, K. Chakanga, S. Geissendorfer, K. von Maydell, and C. Agert, “Optical modelling of light trapping in thin film silicon solar cells using the fdtd method,” 35th IEEE Photovoltaic Specialists Conference, pp. 001535–001539, 2010. [229] A. Arjmand and D. McGuire, “Complete optoelectronic simulation of patterned silicon solar cells,” Numerical Simulation of Optoelectronic Devices (NUSOD), 13th International Conference, pp. 13–14, 2013. [230] K. Yee, “Numerical solution of initial boundary value problems involving maxwell’s equations in isotropic media,” Antennas and Propagation, IEEE Transactions on, vol. 14, no. 3, pp. 302–307, 1996. [231] H. Yang, L. A. Jauregui, G. Zhang, Y. P. Chen, and Y. Wu, “Nontoxic and abundant copper zinc tin sulfide nanocrystals for potential high-temperature thermoelectric energy harvesting,” Nano Letters, vol. 12, no. 2, pp. 540–545, 2012.
152
References
[232] A. Nagaoka, K. Yoshino, K. Aoyagi, T. Minemoto, Y. Nose, T. Taniyama, K. Kakimoto, and H. Miyake, “Thermo-physical properties of Cu2ZnSnS4 single crystal,” Journal of Crystal Growth, vol. 393, pp. 167 – 170, 2014. [233] S. Levcenko, M. G. Gurieva, and A. Nateprov, “Optical constants of Cu2ZnSnS4 bulk crystals,” Moldavian Journal of Physical Sciences, vol. 8, pp. 173–177, 2009. [234] N. Ghoneim, “Assessment of high temperature refractory metals,” in APEX Meeting, Sandia National Laboratory, pp. 0–0, 1988. [235] M. Ordal, R. J. Bell, R. W. Alexander, L. A. Newquist, and M. Querry, “Optical properties of Al, Fe, Ti, Ta, W, and Mo at submillimeter wavelength,” Applied Optics, vol. 27, pp. 1203–1209, 1988. [236] E. Bonne, “Diode laser processing of silicon thin films solar cells,” School of Photovoltaic and Renewable Energy Engineering, UNSW Australia, 2012. [237] R. Kitamura, L. Pilon, and M. Jonasz, “Optical constants of silica glass from extreme ultraviolet to far infrared at near room temperature,” Applied Optics, vol. 46, no. 33, pp. 8118–8133, 2007. [238] J. Johnson, H. Nukala, E. Lund, W. Oo, A. Bhatia, L. Rieth, and M. Scarpulla, “Effects of 2nd phases, stress, and Na at the Mo/Cu2ZnSnS4 interface,” Material Research Society Symposium Proceedings, vol. 1268, 2010, 2010. [239] R. Stanowski, O. Voznyy, and J. Dubowski, “Finite element model calculations of temperature profiles in nd:yag laser annealed gaas/algaas quantum well structure,” Journal of Laser Micro/Nanoengineering, vol. 1, no. 1, pp. 17–22, 2006. [240] R. Zhu, R. Wang, and X. Cheng, “Laser induced damage of gaas/ge solar cells by 532 nm,” Proceedings of SPIE, vol. 9543, no. 954301, pp. 1–8, 2014. [241] V. Teixeria and M. Andritschky, “Influence of sputter gas pressure and substrate bias on intrinsic stress and crystallinity of coatings produced by magnetron sputtering,” in Multicomponent and Multilayered Thin Films for Advanced Microtechnologies: Techniques, Fundamentals and Devices, ed. Springer, pp. 121–127, 1993. [242] S. Karthikeyan, L. Zhang, and S. Campbell, “In-situ stress and thermal stability studies of molybdenum bilayer back contacts for photovoltaic applications,” 40th IEEE Photovoltaic Specialists Conference, pp. 0387–0389, 2014. [243] J. H. Scofield, A. Duda, B. L. Albin, D.and Ballard, and P. P. K., “Sputtered molybdenum bilayer back contact for copper indium diselenide-based polycrystalline thin-film solar cells,” Thin Solid Films, vol. 260, pp. 26–31, 1995. [244] C. Hsueh, “Thermal stresses in thin elastic multilayer systems,” Thin Solid Films, vol. 418, pp. 182–188, 2002. [245] D. Liu, Y. Huang, X. Zhu, X. Wang, M. Chen, and H. Zhu, “Effect of laser fluence on the properties of micro-structured silicon cells,” 2011 International Conference on Physics Science and Technology (ICPST 2011), vol. 22, pp. 464–470, 2011.
References
153
[246] S. Nakano, X. Chen, B. Gao, and K. Kakimoto, “Numerical analysis of cooling rate dependence on dislocation density on multicrystalline silicon solar cells,” Journal of Crystal Growth, vol. 318, no. 1, pp. 280–282, 2011. [247] A. Barhdadi and B. Hariti, “Pulsed lasers in photovoltaic technology,” Proceeding of SPIE, vol. 8011, pp. 801120–801120–10, 2011. [248] B. Solis and C. N. Afonso, “Early stages of melting in si under nanosecond laser pulse irradiaiton: A time-resolved study,” Journal of Applied Physics, vol. 69, no. 4, pp. 2105–2111, 1991. [249] T. Nagahori and S. Matsumoto, “Optical measurement of the melt depth during pulsed laser irradiation,” Japanese Journal of Applied Physics, vol. 28, no. 9A, p. L1657, 1989. [250] A. Fell and F. Granek, “Influence of pulse duration on the doping quality in laser chemical processing (LCP)-a simulative approach,” Applied Physics A, vol. 110, pp. 643–648, 2013. [251] V. Gonda, J. Venturini, C. Sabatier, D. Van, and L. Nanver, “Thermal budget considerations for excimer laser annealing of implanted dopants,” Journal of Optoelectronics and Advanced Materials, vol. 12, no. 3, pp. 466–469, 2010. [252] V. Gonda, J. Slabbekoorm, and L. Nanver, “Silicon laser annealing by two-pulse laser system with variable pulse offsets,” 15 International Conference on Advanced Thermal Processing of Semiconductors, pp. 257–261, 2007. [253] T. Li, “Computational and experimental study of nanosecond laser ablation of crystalline silicon,” International Communications in Heat and Mass Transfer, vol. 38, pp. 1041–1043, 2011. [254] R. J. Schulz, H. Anja, R. Richard, H. Luis, and L. Stephen, “Influence of the pulse width for visible pulsed laser doping for crystalline solar cells using phosphosilicate glass,” Journal of Laser Micro/Nanoengineering, vol. 6, no. 1, pp. 64–68, 2011. [255] G. Poulin, D. Blanc, B. Semmache, Y. Pellegrin, and M. Lemiti, “Finite element simulation of laser-induced diffusion in silicon,” Energy Procedia, vol. 8, pp. 587–591, 2011. [256] M. Hackenberg, M. Rommel, M. Rumler, J. Lorenz, P. Pichler, K. Huet, R. Negru, G. Fisicaro, A. Magna, N. Taleb, and M. Quillec, “Melt depth and time variations during pulsed laser thermal annealing with one and more pulses,” Proceedings of The European Solid-State Device Research Conference (ESSDERC), pp. 214–217, 2013. [257] A. a. Fell, “Simulation of phase changes and dopant diffusion in silicon for the manufacturing of selective emitters via laser chemical processing,” 23rd European Photovoltaic Solar Energy Conference, pp. 272–274, 2008. [258] T. Sameshima and S. Usui, “Analysis of dopant diffusion in molten silicon induced by a pulsed excimer laser,” Japanese Journal of Applied Physics, vol. 26, no. 7, pp. 1208–1210, 1987.
154
References
[259] H. Azuma, A. Takeuchi, T. Ito, T. Fukushima, H.and Motohiro, and M. Yamaguchi, “Pulsed krf excimer laser annealing of silicon solar cells,” Solar Energy Materials and Solar Cells, vol. 74, pp. 289–294, 2002. [260] J. Bovatsek, “Effects of pulse duration on the ns-laser pulse induced removal of thin film materials used in photovoltaics,” Proceedings of the SPIE, pp. 1–13, 2009. [261] L. Grad and J. Mozina, “Laser pulse shape influence on optically induced dynamic process,” Applied Surface Science, vol. 127-129, pp. 999–1004, 1998. [262] J. Bovatsek and R. Patel, “High power, nanosecond-pulse q-switch laser technology with flattop beam shaping technique for efficient laser processing,” Proceedings of ICALEO 2009 Conference, Orlando, pp. 1–7, 2009. [263] A. Tamhankar, J. Bovatsek, G. Guadano, and R. Patel, “Advantages of using dpss nanosecond laser with a gaussian beam shape for scribing thin film photovoltaic panels,” Proceedings of ICALEO 2009 Conference, Orlando, pp. 1–9, 2009. [264] D. Marti and C. Arnold, “Bessel and annular beams for materials processing,” Laser and Photonics Reviews, vol. 6, no. 5, pp. 607–621, 2012. [265] X. Peng, B. Jordens, A. Hooper, B. Baird, W. Ren, L. Xu, and L. Sun, “Generation of programmable temporal pulse shape and applications in micromachining,” Proceedings of SPIE, vol. 7193, pp. 1–9, 2009. [266] U. Jager, P. Oesterlin, A. Kimmerle, and R. Preu, “Beam shaping- the key to high throughput selective emitter laser processing with a single laser system,” Proceedings 35th IEEE Photovoltaic Specialists Conference, pp. 1401–1405, 2010. [267] K. Mumtaz and N. Hopkinson, “Selective laser melting of thin wall parts using pulse shaping,” Journal of Materials Processing Technology, vol. 210, pp. 279–287, 2010. [268] A. Adikaari, N. Mudugamuwa, and S. Silva, “Use of an asymmetric pulse profile for higher crystalline volumes from excimer laser crystallization of amorphous silicon,” Applied Physics Letters, vol. 90, no. 171912, pp. 171912:1–3, 2007. [269] D. Shealy and J. Hoffnagle, “Laser beam shaping profiles and propagation,” SPIE Conference Laser Beam Shaping, vol. 45, no. 21, pp. 5118–5131, 2006. [270] J. Ren, S. Orlev, and L. Hesselink, “Nanosecond laser silicon micromachining,” Proceedings of SPIE, vol. 5339, pp. 382–393, 2004. [271] C. Carr, J. Trenholme, and M. Spaeth, “The effect of temporal pulse shape on optical damage,” Applied Physics Letters, vol. 90, no. 4, pp. 041110:1–3, 2006. [272] J. Venturini, “Long pulse laser thermal processing: annealing duration trade off for next generation semiconductors hot processes,” 13th IEEE International Conference on Advanced Thermal Processing of Semiconductors- RTP, pp. 1–7, 2005. [273] L. Pirozzi, U. Vetrella, and E. Salza, “Innovative applications of laser technology in photovoltaics,” Laser Applications in Microelectronic and Optoelectronic Manufacturing, vol. 2, pp. 119–128, 1997.
References
155
[274] L. Ventura, J. Schunk, J. Muller, S. Barthe, U. Vetrella, L. Pirozzi, and E. Salza, “Influence of baking conditions of doped spined-on glass sources on the formation of laser assisted selective emitters,” 25 IEEE Photovoltic Specialists Conference, pp. 577–580, 1996. [275] M. Grilli, G. Arabito, F. Artuso, V. Barbarossa, M. Belardinelli, V. Besi, F. Ferrazza, G. Ginocchietti, R. Nacci, E. Salza, and L. Pirozzi, “Screen printing on laser doped selective emitter for large area production silicon solar cells,” 2nd World Conference and Exhibition on Photovoltaic Solar Energy Conversion, pp. 1854–1857, 1998. [276] V. Besi, L. Pirozzi, E. Salza, G. Ginocchietti, F. Ferrazza, L. Ventura, A. Slaoui, and J. Muller, “Large area, screen printed silicon solar cells with selective emitter made by laser overdopping and rta spin on glass,” 26 IEEE Photovoltic Specialists Conference, pp. 135–138, 1997. [277] E. Schneiderlochner, R. Preu, R. Ludemann, and S. Glunz, “Laser-fired contacts for crystalline solar cells,” Progress in Photovoltaics Research and Applications, vol. 10, pp. 29–34, 2002. [278] K. Van, R. Einhaus, J. Szlufcik, J. Nijs, and R. Mertens, “A novel silicon solar cell structure with both external polarity contacts on the back surface,” 2nd World Conference on Photovoltaic Solar Energy Conversion, pp. 1479–1482, 1998. [279] D. Kray, S. Baumann, K. Mayer, A. Eyer, and G. Willeke, “Novel techniques for low-damage microstructuring of silicon,” 20th European Photovoltaic Solar Energy Conference, pp. 156–159, 2005. [280] J. Lin and T. George, “Laser generated electron emission from surfaces: Effect of the pulse shape on temperature and transient phenomena,” Journal of Applied Physics, vol. 54, no. 1, pp. 382–387, 1983. [281] K. Kanzler, How much energy are you throwing away? Photonics Spectra, July, 2006. [282] M. Hackenberg, P. Pichler, K. Huet, R. Negru, J. Venturini, A. Pakfar, C. Tavernier, and A. Magna, “Enthalpy based modelling of pulsed excimer laser annealing for process simulation,” Applied Surface Science, vol. 258, pp. 9347–9351, 2012. [283] S. Moon, “In-situ temperature measurement of silicon films during excimer laser annealing,” Engineering Materials, vol. 326, pp. 195–198, 2006. [284] Z. Li, H. Zhang, Z. Shen, and X. Ni, “Time-resolved temperature measurement and numerical simulation of millisecond laser irradiated silicon,” Journal of Applied Physics, vol. 114, pp. 033104:1–8, 2013. [285] K. D. Cole and W. A. McGahan, “Theory of multilayers heated by laser absorption,” ASME Journal of Heat Transfer, vol. 115, pp. 767–771, 1993. [286] J. Lin and T. George, “Laser-generated electron emission from surfaces: Effect of the pulse shape on temperature and transient phenomena,” Journal of Applied Physics, vol. 54, no. 1, pp. 382–387, 1983.
156
References
[287] V. Mazhukin, M. Lobok, and I. Smurov, “Transient effects in pulsed laser irradiation,” Applied Surface Science, vol. 253, pp. 7744–7748, 2007. [288] J. F. Li, L. Li, and F. H. Stott, “Comparison of volumetric and surface heating sources in the modeling of laser melting of ceramic materials,” International Journal of Heat and Mass Transfer, vol. 47, pp. 1159–1174, 2004. [289] Y. Han, Study of laser pulse duration on the laser doping. Undergraduate Thesis, Australian National University, AUS, 2013. [290] J. Degnan, “Theory of the optimally coupled q-switched laser,” IEEE Journal of Quantum Electronics, vol. 25, pp. 214–220, 1989. [291] W. Koechner, Solid-State Laser Engineering. Springer, 2006. [292] P. Smith, P. Carey, and T. Sigmon, “Excimer laser crystallisation and doping of silicon films on plastic substrates,” Applied Physics Letters, vol. 70, no. 3, pp. 342–344, 1997. [293] J. Shida, N. Kobayashi, and H. Kusama, “Poly silicon tft annealing with xecl excimer laser,” Review Laser Engineering, vol. 28, no. 1, pp. 24–28, 2000. [294] F. Takeuchi, Y. Takizawa, S. Noda, and Y. Mishima, “Transient thermal analysis of excimer laser annealed poly crystalline si films,” International Workshop on ActiveMatrix Liquid-Crystal Displays (AM-LCD99), pp. 24–28, 1999. [295] B. S. Yilbas, “Analytical solution for the heat conduction mechanism appropriate to the laser heating process,” International Communications in Heat and Mass Transfer, vol. 20, no. 4, pp. 545–555, 1993. [296] S. Shuja, B. Yilbas, and S. Khan, “Laser consecutive pulses heating in relation to melting: influence of duty cycle on melting,” Heat and Mass Transfer, vol. 45, no. 6, pp. 793–803, 2009. [297] X. Long and S. Khanna, “Modelling of electrically enhanced friction stir welding process using finite element method,” Science and Technology of Welding and Joining, vol. 10, no. 4, pp. 482–487, 2005. [298] R. Nandan, G. Roy, T. Lienert, and T. Debroy, “Numerical modelling of 3d plastic flow and heat transfer during friction stir welding of stainless steel,” Science and Technology of Welding and Joining, vol. 11, no. 5, pp. 526–537, 2006. [299] M. Bahrami, J. Culham, M. Yovanovich, and G. Scneider, “Thermal contact resistance of nonconforming rough surfaces, part 1: contact mechanics model,” Journal of Thermophysics and Heat Transfer, vol. 18, no. 2, pp. 209–217, 2004. [300] M. Bahrami, J. Culham, M. Yovanovich, and G. Scneider, “Thermal contact resistance of nonconforming rough surfaces, part 2: thermal model,” Journal of Thermophysics and Heat Transfer, vol. 18, no. 2, pp. 218–227, 2004. [301] P. VanderMeer, L. Giling, and S. Kroon, “The emission coefficient of silicon coated with Si3N4 or SiO2 layers,” Journal of Applied Physics, vol. 47, no. 2, pp. 652– 655, 1976.
References
157
[302] V. Mikron, Mikron Vertretung Schweiz. Mikron Instrument Company Inc, 2012. [303] Z. S. Bacar, Y. Leory, F. Antoni, A. Slaoui, and E. Fogarassy, “Modelling of CW laser diode irradiation of amorphous silicon films,” Applied Surface Science, vol. 257, pp. 5127–5131, 2011.
Appendix A Thermophysical and optical properties Silicon
Fig. A.1 Thermal conductivity of silicon [49, 100, 126, 127].
160
Thermophysical and optical properties
Fig. A.2 Product of specific heat (C p ) and density (ρ) of silicon [49, 100, 126, 127].
Fig. A.3 Relation of enthalpy density and temperature for silicon [102, 282].
161 Table A.1 Optical properties of silicon . αliquid n
Rsolid
Rliquid
−
−
−
1.76 × 10⁸ [120]
−
0.65[120]
0.65[120]
1.48 × 10⁸ [120]
1.53 × 10⁸ [120]
−
0.587[120]
0.734[120]
7.77 × 10⁴ (T /300)1.2 [125]
−
3.663(T /300)0.024 [125]
−
−
λ
αsolid
nm
m−1
m−1
248
1.70 × 10⁸ [120]
308 808
162
Thermophysical and optical properties
Steel Table A.2 Thermal conductivity, and product of density and specific heat of steel [173, 296– 298] T (K) K(W m−1 K −1 ) ρC p (Jm−3 K −1 )
.
300
14.9
3.82×10⁶
400
16.6
4.10×10⁶
600
19.8
4.38×10⁶
800
22.6
4.52×10⁶
1000
25.4
4.68×10⁶
1200
28
4.84×10⁶
1500
31.7
5.05×10⁶
163
Thermal joint conductance Table A.3 Properties used for calculating thermal joint conductance
.
Properties
Value
Ref.
σr (µm)
0.8
[168]
mas
0.076σr0.52
[299, 300]
Ym (µm)
2 ≤ Ym /σr ≤ 4.75
[172]
Pcont Hc
0.005
[167]
kg (W m−1 K −1 )
7.42 × 10⁻⁵ + 0.0037
[168]
g (µm)
2.2
[168]
εsilicon
0.7
[301]
εsteel
0.74
[302]
164
Thermophysical and optical properties
CZTS Table A.4 Thermal and optical properties of CZTS film
.
ρ
K
Tm
Cp
n
k
(kgm−3 )
W m−1 K −1
K
Jkg−1 K −1
λ = 808nm
λ = 808nm
4560 [231]
2.95 [231]
1263 [232]
410 [233]
2.92 [233]
0.244 [233]
Mo Table A.5 Thermal and optical properties of Mo
.
ρ
K
Tm
Cp
n
(kgm−3 )
W m−1 K −1
K
Jkg−1 K −1
10280 [234]
138 [234]
2896 [234]
250 [234]
k
λ = 808nm λ = 808nm 3.6 [235]
3.34 [235]
Glass
ρ
Table A.6 Thermal and optical properties of Glass . K Tm Cp
(kgm−3 )
W m−1 K −1
K
Jkg−1 K −1
2230 [160, 303]
1.3 [160, 303]
1673 [160, 303]
700 + 0.299T [303]
n
k
λ = 808nm λ = 808nm 1.46 [237]
-