Professor Yue Ying Lau. Professor Alec ... generation of NGPD research group
members. ..... 46. 3.7. Schematic of the planar Bohm sheath geometry. . . . . . . . . . .
. 48 ix ..... m mass [kg]. ˙m mass flow rate [kg s ]. λMFP. Mean free path [m] xvii .....
The nude Faraday probe is the simplest of probe devices, consisting of a current.
Computational Simulation of Faraday Probe Measurements
by Jeremiah J. Boerner
A dissertation submitted in partial fulfillment of the requirements for the degree of Doctor of Philosophy (Aerospace Engineering) in The University of Michigan 2008
Doctoral Committee: Professor Professor Professor Professor
Iain D. Boyd, Chair Yue Ying Lau Alec D. Gallimore Michael Keidar, George Washington University
“Thou dost not see the humor of it? Yet there is humor in all things, even in this!”
W. S. Gilbert and Sir Arthur Sullivan, Yeomen of the Guard
©
Jeremiah J. Boerner All Rights Reserved
2008
Dedicated to my teachers through all the years.
ii
ACKNOWLEDGEMENTS
First and foremost, I am indebted to my advisor Iain D. Boyd. Without his initial and continuing support I would have given up on grad school long ago. Iain provided a comfortable and challenging research environment, and shielded me from the vagaries of funding. He provided much needed insight and guidance when the course of my research changed, and handled my lengthening stay at Michigan with aplomb. All the while he maintained the understanding attitude and soft touch that allowed me to pursue other interests far beyond the scope of aerospace engineering. I cannot thank him enough, and will always look to him as a model advisor. All the members of my committee have been understanding and generous with their time, and I thank them heartily for that. Each of them invested in me during my time at Michigan, whether it was teaching the science of plasma physics or the art of teaching. Y.Y. Lau taught one of the best introductory plasma courses I could imagine, and imparted a gut-level understanding and intuition of the physics of plasmas. With that in place, the mathematics comes naturally. His challenging particle kinetic lectures paved the way for my understanding and application of kinetic sheath models. Michael Keidar asked many valuable questions and encouraged countless refinements of my conference presentations through the years. His insight into how plasma sheath models actually work has been very helpful. Alec Gallimore lead me through my first electric propulsion course, and later iii
took me on as a GSI for his Aero 225 class. From taking his classes I learned the fundamental differences between undergrad and grad student understanding, along with the fascinating science of space propulsion. From teaching with him I began to understand exactly how challenging it is to teach well. His easygoing style and friendly personality extend far beyond the classroom, and have earned my deep respect. There are many other faculty members at the university that I want to thank for helping me along the way: Professor Gilgenbach of NERS taught me the practical use of probe diagnostics, and revealed the arcana of electron plasma measurements. Professor Drake of AOSS showed me the rich and varied complexity of MHD plasmas, and convinced me that pulling a rabbit out of a hat does not count as a valid derivation. Professors Bernal, Dahm, and VanLeer taught me how to see something from the varied viewpoints of empirical relation, mathematical formalism, and physical intuition, and that having all three starts to feel like comprehension. There are professionals in many places that I want to thank for the support, guidance, and great stories I shared in. Lee Johnson and JPL supported my research and gave critical guidance early on. John "Mike" Fife, Doug VanGilder, and Matt Gibbons introduced me to summer consulting at the Edwards AFRL modeling group. Matt Santi, Shannon Cheng, and Lubos Brieda taught me code-fu on the COLISEUM team. Then there are all the friends and adopted family who provided me with support, moral and otherwise. Over the years I lived, worked, and played with more than a generation of NGPD research group members. I got started in recreational DSMC in Kooj’s basement with the likes of Matt McNenly, Jerry Emhoff, John Yim, and Anton VanderWyst; ran MONACO with Chunpei Cai; climbed rock walls with Jose
iv
Padilla; and diversified to practical molecular dynamics at Colonial Lanes with Tyler Huismann, Ethan Eagle, Tim Deschenes, Andy Porwitzky, and all their special lady friends. Outside of aerospace I trod the boards of Lydia Mendelssohn in the company of Lori Gould, Lawrence Bryk, and Matt Grace. So much of the warmth and happiness that I know in Ann Arbor comes from them, and I can only hope I reflect it back as brightly. Last but never least, I have the most amazing family. Even hundreds of miles away, my parents have been close and supportive. Dad is always practical, dependable, and quick to make light of things. Mom cares and worries and prays for the best, and doesn’t let me forget the greats in my past. Josh, Nate, Zach, and Ashley have given me fond memories, quiet inspiration, reminders to be humble, and a reason for trying harder. I wouldn’t have gotten here, and I wouldn’t even be me, without them.
v
TABLE OF CONTENTS
DEDICATION . . . . . . . . . . . . . . . . . . . . . . . . . . . . . . . . . .
ii
ACKNOWLEDGEMENTS . . . . . . . . . . . . . . . . . . . . . . . . . .
iii
LIST OF FIGURES . . . . . . . . . . . . . . . . . . . . . . . . . . . . . . .
ix
LIST OF TABLES . . . . . . . . . . . . . . . . . . . . . . . . . . . . . . . . xv LIST OF NOMENCLATURE . . . . . . . . . . . . . . . . . . . . . . . . xvi CHAPTER I. Introduction and Overview . . . . . . . . . . . . . . . . . . . . .
1
1.1 Sheaths and other probe disturbances . . . . . . . . . . . . . 1.2 Objectives of this work . . . . . . . . . . . . . . . . . . . . . 1.2.1 Develop computational models of the plasma flow . 1.2.2 Quantify the plasma-probe interactions . . . . . . . 1.2.3 Make recommendations for Faraday probe design and use . . . . . . . . . . . . . . . . . . . . . . . . . 1.3 Organization . . . . . . . . . . . . . . . . . . . . . . . . . . .
3 7 7 8 10 10
II. Background and Motivation . . . . . . . . . . . . . . . . . . . . .
14
2.1 Electric propulsion . . . . . . . . . . . . . . . . . 2.1.1 Types of electric propulsion . . . . . . . 2.1.2 Advantages and limitations . . . . . . . 2.2 Experimental investigation of electric propulsion 2.2.1 Ongoing Research . . . . . . . . . . . . 2.2.2 Vacuum facilities . . . . . . . . . . . . 2.2.3 Probe diagnostics . . . . . . . . . . . . 2.3 Computational modeling of electric propulsion . 2.3.1 Computational techniques . . . . . . . 2.3.2 Ongoing research . . . . . . . . . . . . 2.4 Need for simulation of plasma probes . . . . . . .
vi
. . . . . . . . . . .
. . . . . . . . . . .
. . . . . . . . . . .
. . . . . . . . . . .
. . . . . . . . . . .
. . . . . . . . . . .
. . . . . . . . . . .
14 15 16 20 20 22 23 24 24 26 27
III. Governing Equations and Analytical Sheath Models . . . . . 3.1 Plasma concepts and theories . . . . . . . . . 3.1.1 Kinetic description . . . . . . . . . 3.1.2 Fluid description . . . . . . . . . . 3.2 Geometric Shadowing Model . . . . . . . . . 3.2.1 The Vlasov equation and shadowing 3.2.2 Results and Discussion . . . . . . . 3.3 Collisionless Planar Bohm Sheath . . . . . . 3.3.1 Fluid equations and a solution . . . 3.3.2 The Bohm criterion . . . . . . . . . 3.3.3 Results and Discussion . . . . . . . 3.4 Comparison of model results . . . . . . . . .
. . . . . . . . . . . . . . . . . . . . solution . . . . . . . . . . . . . . . . . . . . . . . . . . . . . .
. . . . . . . . . . .
. . . . . . . . . . .
30 30 34 37 37 41 47 47 51 53 56
IV. Hybrid Fluid PIC-DSMC Numerical Model . . . . . . . . . . .
61
4.1 Ion and neutral particle models . . . . . . . . . . . . . . 4.1.1 Particle In Cell . . . . . . . . . . . . . . . . . 4.1.2 Direct Simulation Monte Carlo . . . . . . . . . 4.2 Electron fluid models . . . . . . . . . . . . . . . . . . . 4.2.1 Derivation from electrostatic MHD equations . 4.2.2 Boltzmann model . . . . . . . . . . . . . . . . 4.2.3 Non-neutral detailed model . . . . . . . . . . . 4.2.4 Poisson-consistent detailed model . . . . . . . 4.2.5 Summary of the electron fluid model equations 4.3 Hybrid fluid PIC model iteration cycle . . . . . . . . . . 4.4 Discretization and ADI solver . . . . . . . . . . . . . . . 4.4.1 Finite difference operators . . . . . . . . . . . 4.4.2 Solution technique for differential equations . . 4.4.3 ADI solver . . . . . . . . . . . . . . . . . . . . 4.5 ADI accuracy and stability for the detailed models . . . 4.5.1 One dimensional non-neutral detailed model . 4.5.2 One dimensional Poisson-consistent model . .
. . . . . . . . . . .
. . . . . . . . . . . . . . . . .
62 62 64 66 66 70 71 73 74 75 76 76 80 83 84 84 87
V. Faraday Probe Simulations . . . . . . . . . . . . . . . . . . . . .
89
5.1 Basis for simulation . . . . . . . . . . . . . . . 5.1.1 Hall thruster plume properties . . . . 5.1.2 Faraday probe . . . . . . . . . . . . . 5.2 Simulation geometry and numerical parameters 5.2.1 Computational domain . . . . . . . . 5.2.2 Time step and global iteration . . . . 5.2.3 Boundary conditions . . . . . . . . . 5.3 Hybrid PIC Boltzmann model studies . . . . .
vii
. . . . . . . .
. . . . . . . .
. . . . . . . .
. . . . . . . .
. . . . . . . .
. . . . . . . . . . . . . . . . .
. . . . . . . . . . .
29
. . . . . . . .
. . . . . . . . . . . . . . . . .
. . . . . . . .
. . . . . . . .
90 90 91 92 92 94 94 96
5.3.1 Quasi one dimensional study . . . . . . . . . 5.3.2 Two dimensional study . . . . . . . . . . . . 5.3.3 Multiple component studies . . . . . . . . . . 5.3.4 Guard ring bias study . . . . . . . . . . . . . 5.3.5 Bias voltage sweep study . . . . . . . . . . . 5.3.6 Comparison with experiment . . . . . . . . . 5.4 Hybrid PIC Non-neutral detailed model study . . . . . 5.5 Hybrid PIC Poisson-consistent detailed model studies 5.5.1 Bohm sheath validation case . . . . . . . . . 5.5.2 Multiple component plasma studies . . . . . 5.6 Conclusions and implications for probe design . . . . .
. . . . . . . . . . .
. . . . . . . . . . .
. . . . . . . . . . .
. . . . . . . . . . .
97 104 110 117 123 126 126 132 132 137 144
VI. Multigrid Methods . . . . . . . . . . . . . . . . . . . . . . . . . . 147 6.1 Time profiling . . . . . . . . . . . . . . . . . . . . . . . . . . 148 6.2 Multigrid technique . . . . . . . . . . . . . . . . . . . . . . . 149 6.3 Validation and speedup assessment of multigrid version . . . 151 VII. Reversed Faraday Probe Simulations . . . . . . . . . . . . . . . 157 7.1 Flow conditions . . . . . . . . . . . . . . . . 7.2 Simulation domain and numerical parameters 7.2.1 Computational domain . . . . . . . 7.2.2 Computational grid . . . . . . . . . 7.2.3 Boundary conditions . . . . . . . . 7.3 Geometric shadowing DSMC model . . . . . 7.4 Hybrid PIC Boltzmann model . . . . . . . . 7.5 Hybrid PIC Poisson-consistent detailed model 7.6 Exchange frequency results . . . . . . . . . . 7.7 Conclusions for model usage and probe design VIII. Conclusion
. . . . . . . . . .
. . . . . . . . . .
. . . . . . . . . .
. . . . . . . . . .
. . . . . . . . . .
. . . . . . . . . .
. . . . . . . . . .
. . . . . . . . . .
. . . . . . . . . .
158 160 160 162 163 165 168 174 178 182
. . . . . . . . . . . . . . . . . . . . . . . . . . . . . . . 185
8.1 Summary and Review . . . . . . . . . . . . . . . 8.1.1 One dimensional analytic models . . . . 8.1.2 Two dimensional computational models 8.1.3 Faraday probe simulations . . . . . . . 8.1.4 Multigrid methods . . . . . . . . . . . . 8.1.5 Reversed Faraday probe simulations . . 8.2 Implications for probe design and technique . . . 8.3 Contributions . . . . . . . . . . . . . . . . . . . . 8.4 Future work . . . . . . . . . . . . . . . . . . . .
. . . . . . . . .
. . . . . . . . .
. . . . . . . . .
. . . . . . . . .
. . . . . . . . .
. . . . . . . . .
. . . . . . . . .
185 186 187 189 192 193 195 198 199
BIBLIOGRAPHY . . . . . . . . . . . . . . . . . . . . . . . . . . . . . . . . 202
viii
LIST OF FIGURES
Figure 1.1
Schematic of plasma properties in the collisionless sheath. . . . . . .
3
1.2
Photograph of a Hall thruster plume interacting with a Faraday probe.
5
1.3
Experimental contours of plasma potential around a Faraday probe, courtesy Allen Victor. . . . . . . . . . . . . . . . . . . . . . . . . . .
6
Schematic of an arcjet, demonstrating an electrothermal propellant acceleration mechanism. . . . . . . . . . . . . . . . . . . . . . . . .
16
Schematic of an ion engine, demonstrating an electrostatic propellant acceleration mechanism. . . . . . . . . . . . . . . . . . . . . . . . .
17
Schematic of a pulsed plasma thruster, demonstrating an electromagnetic propellant acceleration mechanism. . . . . . . . . . . . . .
18
2.4
Large Vacuum Test Facility at the University of Michigan. . . . . .
22
3.1
Schematic of the geometric shadowing model, showing the regions of the flow and the distribution function. . . . . . . . . . . . . . . . .
39
Profiles of the local distribution function in the shadowing sheath solution. . . . . . . . . . . . . . . . . . . . . . . . . . . . . . . . . .
42
3.3
Profile of ion number density in the shadowing sheath solution. . . .
43
3.4
Profile of ion mean velocity in the shadowing sheath solution. . . . .
44
3.5
Profile of ion temperature in the shadowing sheath solution. . . . .
45
3.6
Profile of plasma potential in the shadowing sheath solution. . . . .
46
3.7
Schematic of the planar Bohm sheath geometry. . . . . . . . . . . .
48
2.1
2.2
2.3
3.2
ix
3.8
Profile of plasma potential in the Bohm sheath solution. . . . . . . .
51
3.9
Profiles of ion and electron number density in the Bohm sheath solution. . . . . . . . . . . . . . . . . . . . . . . . . . . . . . . . . . .
52
3.10
Profile of potential from the Bohm sheath. . . . . . . . . . . . . . .
54
3.11
Profiles of ion and electron density from the Bohm sheath. . . . . .
55
3.12
Profile of ion velocity from the Bohm sheath. . . . . . . . . . . . . .
56
3.13
Profiles of ion density from the Bohm sheath and the best-fit shadowing sheath. . . . . . . . . . . . . . . . . . . . . . . . . . . . . . .
59
Profiles of potential from the Bohm sheath and the best-fit shadowing sheath. . . . . . . . . . . . . . . . . . . . . . . . . . . . . . . . .
59
4.1
A typical computational node and its surroundings. . . . . . . . . .
77
4.2
ADI solutions of the 1D non-neutral model potential equation . . .
86
4.3
ADI solutions of the 1D Poisson-consistent model number density equation . . . . . . . . . . . . . . . . . . . . . . . . . . . . . . . . .
88
5.1
Faraday probe used in experimental BHT-200 measurements. . . . .
92
5.2
Computational domain for Faraday probe simulations. . . . . . . . .
93
5.3
Contours of plasma potential for the one dimensional cold ion case.
99
5.4
Profiles of plasma potential for the one dimensional cold ion case. .
99
5.5
Contours of electron number density for the one dimensional cold ion case. . . . . . . . . . . . . . . . . . . . . . . . . . . . . . . . . . 100
5.6
Profiles of electron number density for the one dimensional cold ion case. . . . . . . . . . . . . . . . . . . . . . . . . . . . . . . . . . . . 100
5.7
Contours of ion number density for the one dimensional cold ion case.101
5.8
Profiles of ion number density for the one dimensional cold ion case. 101
5.9
Profiles of plasma potential for the one dimensional hot ion case. . . 102
3.14
x
5.10
Profiles of electron number density for the one dimensional hot ion case. . . . . . . . . . . . . . . . . . . . . . . . . . . . . . . . . . . . 103
5.11
Profiles of ion number density for the one dimensional hot ion case.
5.12
Contours of plasma potential for the cold ion case. . . . . . . . . . . 105
5.13
Profiles of plasma potential near the centerline for the cold ion case. 105
5.14
Contours of electron number density for the two dimensional cold ion case. . . . . . . . . . . . . . . . . . . . . . . . . . . . . . . . . . 106
5.15
Profiles of electron number density near the centerline for the cold ion case. . . . . . . . . . . . . . . . . . . . . . . . . . . . . . . . . . 106
5.16
Contours of ion number density for the two dimensional cold ion case.107
5.17
Profiles of ion number density near the centerline for the cold ion case.107
5.18
Profiles of plasma potential near the centerline for the hot ion case.
5.19
Profiles of electron number density near the centerline for the hot ion case. . . . . . . . . . . . . . . . . . . . . . . . . . . . . . . . . . 109
5.20
Profiles of ion number density near the centerline for the hot ion case.109
5.21
Profiles of ion number density near the centerline for the beam component case. . . . . . . . . . . . . . . . . . . . . . . . . . . . . . . . 113
5.22
Profiles of ion number density near the centerline for the CEX component case. . . . . . . . . . . . . . . . . . . . . . . . . . . . . . . . 113
5.23
Profiles of total and component ion number density near the centerline for the beam-CEX case. . . . . . . . . . . . . . . . . . . . . . . 114
5.24
Contours of percent difference in beam ion number density for the beam-CEX case. . . . . . . . . . . . . . . . . . . . . . . . . . . . . . 115
5.25
Contours of percent difference in CEX ion number density for the beam-CEX case. . . . . . . . . . . . . . . . . . . . . . . . . . . . . . 115
5.26
Profiles of ion number density near the centerline for the double component case. . . . . . . . . . . . . . . . . . . . . . . . . . . . . . 116
xi
103
108
5.27
Profiles of total and component ion number density near the centerline for the beam-CEX-double composite case. . . . . . . . . . . . . 117
5.28
Contours of plasma potential for the guard ring bias of -10 V. . . . 118
5.29
Contours of charge density for the guard ring bias of -10 V. . . . . . 119
5.30
Contours of plasma potential for the guard ring bias of 0 V.
5.31
Contours of charge density for the guard ring bias of 0 V. . . . . . . 120
5.32
Streamlines of current for the guard ring bias of -10 V. . . . . . . . 121
5.33
Streamlines of current for the uniform bias of -5 V. . . . . . . . . . 121
5.34
Streamlines of current for the guard ring bias of 0 V. . . . . . . . . 122
5.35
Simulated collected current as a function of guard ring bias. . . . . 123
5.36
Simulated collected current over a range of probe bias. . . . . . . . 124
5.37
Contours of plasma potential for the cold ion case. . . . . . . . . . . 127
5.38
Profiles of plasma potential near the centerline for the cold ion case. 128
5.39
Contours of electron number density for the cold ion case. . . . . . . 129
5.40
Contours of ion number density for the cold ion case. . . . . . . . . 129
5.41
Profiles of electron number density near the centerline for the cold ion case. . . . . . . . . . . . . . . . . . . . . . . . . . . . . . . . . . 130
5.42
Profiles of ion number density near the centerline for the cold ion case.131
5.43
Contours of plasma potential for the cold ion case. . . . . . . . . . . 133
5.44
Profiles of plasma potential near the centerline for the cold ion case. 134
5.45
Contours of electron number density for the cold ion case. . . . . . . 135
5.46
Profiles of electron number density near the centerline for the cold ion case. . . . . . . . . . . . . . . . . . . . . . . . . . . . . . . . . . 135
5.47
Contours of ion number density for the cold ion case. . . . . . . . . 136
xii
. . . . 119
5.48
Profiles of ion number density near the centerline for the cold ion case.136
5.49
Profiles of plasma potential near the centerline for the hot composite case. . . . . . . . . . . . . . . . . . . . . . . . . . . . . . . . . . . . 139
5.50
Profiles of plasma potential near the centerline for the cold composite case. . . . . . . . . . . . . . . . . . . . . . . . . . . . . . . . . . . . 139
5.51
Profiles of electron number density near the centerline for the hot composite case. . . . . . . . . . . . . . . . . . . . . . . . . . . . . . 140
5.52
Profiles of electron number density near the centerline for the cold composite case. . . . . . . . . . . . . . . . . . . . . . . . . . . . . . 141
5.53
Profiles of total and component ion number density near the centerline for the hot composite case. . . . . . . . . . . . . . . . . . . . . 142
5.54
Profiles of total and component ion number density near the centerline for the cold composite case. . . . . . . . . . . . . . . . . . . . . 142
5.55
Normalized distribution functions for the hot composite and cold composite cases. . . . . . . . . . . . . . . . . . . . . . . . . . . . . . 143
6.1
Contours of potential for the original and multigrid composite simulations. . . . . . . . . . . . . . . . . . . . . . . . . . . . . . . . . . 152
6.2
Contours of electron number density for the original and multigrid composite simulations. . . . . . . . . . . . . . . . . . . . . . . . . . 153
6.3
Contours of charge density for the original and multigrid composite simulations. . . . . . . . . . . . . . . . . . . . . . . . . . . . . . . . 154
7.1
Schematic of the wake behind a reversed Faraday probe, with the leading expansion ray and the streamline for particles with the fastest radial speed. . . . . . . . . . . . . . . . . . . . . . . . . . . . . . . . 161
7.2
Computational domain for reversed Faraday probe simulations. . . . 162
7.3
Contours of ion density for the reversed Faraday probe case. . . . . 166
7.4
Profiles of ion number density at the outer edge of the probe. . . . . 167
7.5
Streamlines of current for the reversed Faraday probe case. . . . . . 168
xiii
7.6
Contours of ion density for the reversed Faraday probe case. . . . . 169
7.7
Contours of electron density for the reversed Faraday probe case. . . 170
7.8
Contours of plasma potential for the reversed Faraday probe case. . 171
7.9
Streamlines of current for the reversed Faraday probe case. . . . . . 171
7.10
Profiles of ion number density at the outer edge of the probe. . . . . 173
7.11
Contours of ion density for the reversed Faraday probe case. . . . . 175
7.12
Contours of electron density for the reversed Faraday probe case. . . 175
7.13
Contours of potential for the reversed Faraday probe case. . . . . . 177
7.14
Streamlines of current for the reversed Faraday probe case. . . . . . 177
7.15
Profiles of ion number density at the outer edge of the probe. . . . . 178
7.16
Profiles of simulated exchange frequency calculated using the shadowing DSMC model. . . . . . . . . . . . . . . . . . . . . . . . . . . 180
7.17
Profiles of simulated exchange frequency calculated using the Boltzmann model. . . . . . . . . . . . . . . . . . . . . . . . . . . . . . . . 181
7.18
Profiles of simulated exchange frequency calculated using the Poissonconsistent model. . . . . . . . . . . . . . . . . . . . . . . . . . . . . 182
xiv
LIST OF TABLES
Table 4.1
Summary of electron fluid model equations . . . . . . . . . . . . . .
75
4.2
Areas and differentials in the finite difference Laplacian operator . .
79
4.3
Finite difference Laplacian coefficients . . . . . . . . . . . . . . . . .
79
5.1
Plasma properties 50 cm downstream and 75° off-axis in the BHT200 plume. . . . . . . . . . . . . . . . . . . . . . . . . . . . . . . . .
91
5.2
Plasma properties for the beam-CEX component case. . . . . . . . . 111
5.3
Plasma properties for the beam-CEX-double composite case. . . . . 111
5.4
Simulated collected current for the guard ring relative bias. . . . . . 123
5.5
Simulated collected current for the probe bias sweep. . . . . . . . . 125
5.6
Plasma properties for the hot composite case. . . . . . . . . . . . . 138
6.1
Time profile results of the hybrid fluid PIC computational code. . . 148
6.2
Time profile results of the multigrid hybrid fluid PIC computational code. . . . . . . . . . . . . . . . . . . . . . . . . . . . . . . . . . . . 156
7.1
Ion plasma properties for reversed Faraday probe simulations. . . . 159
xv
LIST OF NOMENCLATURE
Acronyms CEX
Charge EXchange
CFD
Computational Fluid Dynamics
DSMC
Direct Simulation Monte Carlo
EP
Electric Propulsion
LVTF
Large Vacuum Test Facility
MHD
MagnetoHydroDynamics
PIC
Particle In Cell
PEPL
Plasmadynamics and Electric Propulsion Lab
RPA
Retarding Potential Analyzer
VHS
Variable Hard Sphere
Constants kB
Boltzmann constant, 1.381 × 10⁻²³
e
electron charge, 1.602 × 10⁻¹⁹ [C]
me
electron mass, 9.109 × 10⁻³¹ [kg] � � standard gravity, 9.809 sm2
g µ0 ε0
�J�
permeability of free space, 4π × 10−7
K
�N� A2
permittivity of free space, 8.854 × 10⁻¹²
Symbols �m�
a
acceleration
vB
Bohm velocity
s2
�m� s
xvi
h
C2 Nm2
i
�m�
△v
change in velocity
σab
collision cross section [m2 ]
I
current [A]
λD
Debye Length [m] � � density mkg3
ρ
s
f (x, v, t) distribution function [−] �V� E electric field vector m � � κ electrical conductivity mS
�1�
νe
electron collision frequency
µe
electron collision reduced mass [kg]
ne
electron number density [m−3 ] � � electron current density mA2
je Te w
s
electron temperature [K] � � exchange frequency 1s
W
exchange frequency, normalized by the plasma frequency [−]
H(M)
Heaviside function [−]
Zi
ion charge state [−]
ni
ion number density [m−3 ]
mi
ion mass [kg]
Ti
ion temperature [K]
τ
ion to electron temperature ratio [−]
Kn
Knudsen number, ratio of mean free path to reference length [−]
M
Mach number, ratio of flow speed to a characteristic speed [−]
B
magnetic field vector [T]
m
mass [kg]
m ˙
mass flow rate
λM F P
Mean free path [m]
� kg � s
xvii
�1�
ωP
plasma frequency
φ
plasma potential [V]
Φ
x
plasma potential, normalized by the electron temperature [−] � � pressure mN2
z
sheath position; often normalized by the Debye length [m]
Isp
specific impulse [s]
σ
thermal conductivity
T
thrust [N]
t
time [s]
v
velocity vector
V
voltage [V]
P
s
position vector [m]
�
J m·s·K
�
�m� s
xviii
Chapter I
Introduction and Overview
Plasma diagnostics are one of the key supporting technologies in every area of plasma physics. In plasma confinement research, immersed probe diagnostics and non-intrusive optical diagnostics make experimental measurements of the basic properties of the plasma. In plasma accelerator and electric propulsion research, the diagnostics measure plasma properties in order to infer performance and operating characteristics. In materials processing applications, diagnostics ensure that the desired plasma conditions are sustained in order to produce the desired surface treatment. For each of these examples, plasma diagnostics provide feedback and measurements that help guide the research or operation to achieve a desired goal. In general, it is assumed that some quantity measured by the plasma diagnostic can be related back to a desired property in the plasma. For example, the slope of collected current with respect to bias voltage in the I-V characteristic of a Langmuir probe can be related to the electron temperature. Many diagnostic instruments have been developed to extract information about the flow. The drift current can be measured with Faraday probes, the ion velocity can be visualized with laserinduced fluorescence, the electron number density can be found with microwave interferometry, the plasma potential and electric fields can be measured with emissive
1
2 probes, the ion energy spectrum can be calculated with retarding potential analyzers, and ion charge states can be identified with E×B probes. Of course, many of these instruments can be used to measure more than one plasma property, and for many properties there is more than one measurement technique. The diagnostics are interpreted by relating a directly measured property, such as collected current, to the desired plasma property. The relation is often developed from elementary principles by making certain assumptions about the plasma. Returning to the Langmuir probe example, the electrons are assumed to have a Maxwellian velocity distribution so that the logarithmic slope of the I-V characteristic is inversely proportional to the electron temperature [1]. These assumptions commonly include a Maxwellian distribution of electron velocities, the Boltzmann relation between electron density and plasma potential, and a lower temperature for ions than for electrons. The measurements are assumed to accurately obtain the plasma properties, provided the plasma conditions meet the assumptions of the diagnostic theory. In diagnostic theory it is assumed that the instrument does not significantly affect the properties of the plasma at the point where measurements are taken. This assumption is not valid for probe diagnostics in particular, and it is acknowledged that some disturbance is unavoidable. Theory for the plasma sheath on an immersed surface helps to identify and quantify some of the disturbances caused by the probe. The diagnostic techniques for some instruments take the plasma sheath into account in order to relate the measured properties to “undisturbed” plasma properties. However, sheath theory is limited to the effects in the electrostatic or electromagnetic sheath within a few Debye lengths of the probe surface. Diagnostic theory does not account for the effects at longer range, since those effects are not well understood.
3
Figure 1.1: Schematic of plasma properties in the collisionless sheath [1].
1.1
Sheaths and other probe disturbances
An immersed diagnostic instrument perturbs the plasma properties in its vicinity. Electric and magnetic fields can penetrate the plasma up to a few Debye lengths from the probe, influencing the charged particle trajectories in the sheath. Farther from the probe, the collective shielding effect isolates the bulk plasma from the fields. The transition from bulk plasma through the sheath to a probe surface is shown schematically in Fig. 1.1. For a positive ion plasma, the electrons are the sole negative charge carriers and are more mobile than the ions. This leads to unequal fluxes to a surface at the same potential as the plasma, with more electrons than ions reaching the surface. If the surface is floating, it will accumulate a net negative charge that repels electrons and attracts ions until the net current is zero. Sheaths comprise some of the most enduring and widely encountered problems
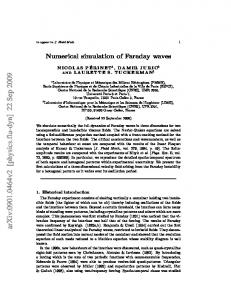
4 in plasma physics. Langmuir and Tonks investigated sheaths in plasma arc and glow discharges in the late 1920’s [2], identifying the major features of the collisionless electrostatic sheath and obtaining analytical solutions for simple geometries. Bohm investigated the current collection of Langmuir probes in the late 1940’s, and established the broadly applicable Bohm criterion for the formation of a steady sheath [3]. The criterion has since been generalized for finite temperature ion distributions and arbitrary ion distributions. Developments in the 1980’s and 1990’s produced a kinetic description of the sheath and presheath for application to the strongly flowing plasmas encountered in space environments and fusion plasmas [4, 5, 6]. More recently, much attention has been focused on developing a consistent method to span the interfaces between plasma, presheath, and sheath [7, 8, 9, 10]. This work is motivated in part by the unphysical result in the Bohm sheath solution that the sheath is infinitely long, and that the electric fields at the sheath edge are asymptotically large. An immersed probe can also affect the flow over longer length scales, since the flow either collides with the probe body or is diverted around the physical obstruction. This can potentially introduce flow features including compression regions upstream of the probe and rarefaction regions in the wake of the probe. Since experimental diagnostic probes are not perfectly absorbing, ions that collide with a probe surface can be neutralized and reflected back into the flow. The neutral gas diffuses away from the probe, extending the region that is perturbed by the probe. Charge exchange or momentum exchange collisions with the neutral gas also have an effect on the overall flow. The photograph of a Faraday probe in the plume of a Hall thruster in Fig. 1.2 is evocative of the large scale disturbances that can be caused by the probe. The
5
Figure 1.2: Photograph of a Hall thruster plume interacting with a Faraday probe [11]. visible light is associated with recombination and relaxation of excited electronic states in the plasma. A very bright region is apparent at the front surface of the probe, suggesting that there is a region of increased density that promotes collisional relaxation and recombination events. A quantitative demonstration of the long range effect of the probe can be seen in experimental contours of plasma potential around a Faraday probe in Fig. 1.3, as reported by Walker et al. in Ref. [12]. The probe is cylindrical, with the axis of the probe aligned with the Y axis in the figure. In that work the Debye length is estimated as λD = 0.3 mm. The observed plasma potential variations extend 2 cm or more from the probe, which is on the order of tens of Debye lengths. The weak fields that extend far from the probe contribute to sheath expansion, where the effective collecting area of the probe is increased due to electrostatic focusing of the ions. The difference in plasma potential between the left and right sides of the probe is described as a shadowing effect. The bulk velocity of the ions is not aligned with the probe axis, and the electric fields are too weak to turn high speed ions into the region “behind” the probe. This is a second long range effect, and is due to the physical
6
Figure 1.3: Experimental contours of plasma potential around a Faraday probe, courtesy Allen Victor [12]. obstruction of the flow. The electrostatic sheath on the front surface of the probe should not alter the total current collected at the surface, except near the outer radial edge of the probe where the sheath curves to join the sheath along the side of the probe body. The standard design practice for experimental Faraday probes takes this into account and includes an annular guard ring to eliminate edge effects on the collecting surface. Sheath expansion is not as well-understood, so there are no standard design guidelines or operational methods to ensure that sheath expansion has minimal effect on the measured properties. Shadowing is unlikely to affect properties on the front surface of the probe, but it would have a significant impact on the properties on the back face of the probe. The effects become especially important in experimental configurations with reversed Faraday probes, which measure the collected current on the wake side of the probe. Shadowing and other long range disturbances are not well-understood either, and
7 there are no design or operational guidelines to account for the effects.
1.2
Objectives of this work
The purpose of this dissertation is to investigate how an immersed Faraday probe affects a plasma flow, and to quantify how the properties measured at the probe surface are related to the “undisturbed” plasma properties that would exist if the probe were not present. Additionally, the results of the investigations are interpreted to give recommendations for the design and use of Faraday probes. This work is conducted using computational techniques in order to achieve a very controlled setting where the undisturbed plasma conditions are known at the outset. Since plasma properties such as ion density and electron temperature can vary by orders of magnitude in different applications, this dissertation is limited to the conditions relevant to electric propulsion (EP) plasmas. Faraday probes are widely used in experimental investigation of EP devices, and a wealth of information is available in the literature. This facilitates the selection of consistent plasma conditions, and limits the scope of this dissertation to a manageable set of plasma models. 1.2.1
Develop computational models of the plasma flow
The first overarching objective of this dissertation is to accurately describe the plasma flow field around a Faraday probe. Although fully analytical solutions or direct simulations are not practical for the full flow problem, many of the same concepts and techniques can be used to develop and apply simpler models. Several milestone objectives build up to the computational simulations of the flow field that are the first goal in this work: 1. Develop and use simple one dimensional models that include the relevant phys-
8 ical mechanisms for plasma-probe interactions. 2. Identify significant flow features in the one dimensional model results and establish a baseline for comparison with more sophisticated models. 3. Develop more accurate models that better represent the actual flow geometry and conditions. This includes moving to higher dimensional models and eliminating the assumptions made in the one dimensional models. 4. Compare results from the improved model with previous models to assess the usefulness and accuracy of the simpler models.
Two important supporting tasks in this process are developing flexible model implementations, and ensuring the reliability of the models. Eventually a range of different plasma conditions and probe geometries are simulated, so the models should be implemented in a flexible and general manner. The models must also be computationally stable and produce physically meaningful results. 1.2.2
Quantify the plasma-probe interactions
The second overarching objective of this dissertation is to evaluate how the plasma flow features and the probe measurements are affected by changing the inflowing plasma properties and the probe operational methods. In this stage the simple plasma conditions typically assumed in standard diagnostic theory are modified. The goal is to evaluate how the properties measured at the probe change in response to the modified plasma conditions. Similarly, the operational parameters of the Faraday probe are modified for a fixed plasma distribution. The purpose is again to evaluate
9 how measured properties at the probe are affected as a result of changing the probe conditions. The ion inflow distribution is modified incrementally until ultimately it is representative of the complex exhaust plasma generated by an EP thruster. The final distribution includes high energy beam ions, low energy charge exchange ions, and multiple charge species. Incremental modification of plasma conditions serves to isolate the effects of each of these components. Results from these simulations are compared against the simpler one dimensional models to assess the impact and relative importance of changing the inflow plasma properties. The investigations of alternative Faraday probe operating conditions are conducted with a fixed set of realistic plasma conditions. The first investigation of the probe operation condition varies the probe bias potential. This allows the effect of sheath expansion to be observed and assessed in terms of the collected current at the probe surface. The second investigation of probe operation conditions varies the guard ring bias relative to the collecting surface bias. The intent in this study is to identify whether the total collected current varies significantly if there is a mismatch in the bias potential on the guard ring and on the collecting surface. Additionally, the reversed Faraday probe is simulated to obtain an understanding of the flow field in the wake of the probe. These simulations require a much larger computational domain and would take a prohibitively long time to complete using the original models. As a supporting task, a multigrid method is developed and implemented to enable the reversed Faraday probe simulations to be carried out in an acceptable time.
10 1.2.3
Make recommendations for Faraday probe design and use
The final major objective of this dissertation is to make recommendations for the design and use of Faraday probes based on the results of the computational simulations. No conflicts are found with the current standard practices for Faraday probe usage. The flow field in the wake of the reversed Faraday probe is more complicated than might be expected, and a few precautionary recommendations are justified.
1.3
Organization
This dissertation is arranged as a linear sequence that starts with a review of experimental and numerical research related to electric propulsion (EP). Chapter II introduces some of the history and elementary concepts of EP, and describes the benefits that make EP such an attractive technology. A selection of the numerous experimental and numerical research activities related to EP are also described, which will inform many decisions about the plasma conditions and numerical models considered in this work. This also provides a perspective on the need for computational study of the interaction between plasmas and diagnostic probes. In Chapter III, kinetic theory and the magnetohydrodynamic fluid equations are introduced as very general descriptions of a plasma. These descriptions are simplified to obtain analytic solutions for the sheath. The kinetic model leads to a geometric shadowing sheath, where the physical obstruction of the probe is the mechanism that creates sheath features. The MHD fluid equations lead to the planar Bohm sheath, where the electrostatic field drives the properties in the sheath. Both kinetic and fluid descriptions of a plasma are used to develop an axisymmetric hybrid fluid particle computational code in Chapter IV. The Particle In
11 Cell (PIC) and Direct Simulation Monte Carlo (DSMC) kinetic models are used for the heavy ion and neutral particles. Three electron fluid models are developed: the Boltzmann model, the non-neutral detailed model, and the Poisson-consistent detailed model. The Boltzmann model is the simplest of the three, and uses the Boltzmann relation to greatly simplify the fluid equations. The non-neutral detailed model uses the full set of fluid equations, and is modified from a previous neutral treatment. The Poisson-consistent detailed model is also derived from the full set of fluid equations, but is manipulated from the outset as a non-neutral model. The hybrid fluid PIC computational code is used extensively in Chapter V to perform simulations of the plasma flow field around an axisymmetric geometry that represents a Faraday probe. The Boltzmann fluid model is used in a series of studies to investigate how varying the plasma properties affects flow structures in the sheath and the simulated collected current at the probe surface. These studies make incremental changes to the inflow ion distribution function from a cold ion beam to a complex composite distribution constructed from multiple drifting Maxwellian components. The Boltzmann model is also used to study how the operation of the Faraday probe affects the simulated collected current at the probe surface. These studies involve changing the bias of the guard ring relative to the collecting surface or sweeping the probe bias over a range of ion collecting conditions. In all of these studies, the planar Bohm sheath is found to be a reliable predictor for the properties in the sheath. The non-neutral detailed model and the Poisson consistent models are also used in Chapter V. The non-neutral detailed model is shown to have a serious procedural flaw and is not developed further. The Poisson-consistent model is used successfully to repeat the studies pertaining to ion inflow distribution. The results from these
12 simulations are generally in very good agreement with the Boltzmann model result and the planar Bohm sheath. The only notable exception is when the ion inflow distribution has a significant backflow component. The present implementation of the hybrid fluid PIC model only introduces particles at the upstream and outer edges of the domain, so any backflow component is not well represented. The hybrid fluid PIC model requires considerable time to run, making it impractical for simulations on larger domains. The computational code is profiled in Chapter VI, revealing that the particle models account for a disproportionately large fraction of the total time. A multigrid method is implemented to solve the PIC model on a coarse grid and solve the electron fluid model on a fine grid. This reduces the computational time spent in the particle models and maintains the grid resolution required for accurate fluid model solutions. The multigrid version of the code is used to perform simulations of a reversed Faraday probe in Chapter VII. The computed flow field on the wake side of the probe is significantly more complicated than on the ram side of the probe. The simplistic structure predicted from the geometric sheath model does not accurately reflect the actual structures. The numerical simulations also provide an estimate of the exchange frequency, which is an unknown parameter in the geometric shadowing model. Profiles of the exchange frequency show features that are not compatible with the assumptions made in the geometric shadowing model. In these studies, the geometric shadowing model is shown to be a poor predictor of sheath properties. The dissertation is concluded in Chapter VIII with a review and summary of the results and new contributions of this work. This includes assessment of the analytic sheath models and the numerical models, an evaluation of the multigrid scheme, and discussion of the probe simulations. In fulfillment of the objectives
13 of this dissertation, suggestions are made regarding the design and use of Faraday probes. Finally, a few recommendations for future work in this area are outlined.
Chapter II
Background and Motivation
The work described in this dissertation is performed in the context of electric propulsion research. This setting guides many decisions about the relevant physical processes and representative conditions of interest. It is therefore useful to introduce electric propulsion and some of the active research in that area. This chapter is additionally intended to identify some of the challenges and outstanding questions that this research is intended to address.
2.1
Electric propulsion
Electric propulsion, or EP as it is often abbreviated, refers to spacecraft propulsion systems that utilize electrical processes rather than chemical reactions to accelerate a propellant. EP systems have been in development since the 1960s, although the underlying concepts were described and investigated as early as 1906 [13, 14]. The first test of an EP device on a spacecraft was an ion thruster on the NASA Space Electric Rocket Test 1 (SERT-1) in 1964. EP systems entered limited use beginning in 1972, in the form of Hall thrusters on Soviet Union “Meteor” satellites [15, 16]. Over the following twenty years, various forms of EP were used for satellite stationkeeping by the United States and the Soviet Union. Since the late 1990s, EP devices
14
15 have also been used as the primary propulsion systems on several deep space missions, including the NASA Deep Space 1 technology demonstration mission [17], the Japanese Aerospace Exploration Agency (JAXA) Hayabusa asteroid sample return mission [18], and the European Space Agency (ESA) SMART-1 lunar mission [19]. 2.1.1
Types of electric propulsion
Electric propulsion includes a wide variety of techniques for producing spacecraft thrust. The only common characteristic of EP systems is that the primary energy source is electrical power. That power source might include solar cells, radioisotope thermoelectric generators, nuclear reactors, or some combination of these. The defining characteristic of an EP system is not the particular power source, but rather the mechanism which converts the electrical energy into propulsive thrust. Generally an EP device can be grouped into one of three broad categories [20]: electrothermal, electrostatic, or electromagnetic. The first category, electrothermal EP, uses electrical heaters or an electrical discharge to heat a working gas. That gas is then expanded through a nozzle as in a conventional rocket. The most common electrothermal devices include resistojets and arcjets. A schematic arcjet is shown in Fig. 2.1. The second category, electrostatic EP, first ionizes the propellant and then accelerates the charged particles via electric fields between one or more extraction and acceleration grids. A schematic gridded ion thruster is shown in Fig. 2.2. Other electrostatic devices include Hall thrusters, field emission thrusters, and colloid thrusters. Devices in this category typically accelerate positive charge particles or ions, so there is a need for an electron-emitting neutralizer to prevent a net charge buildup on the spacecraft.
16
Figure 2.1: Schematic of an arcjet [21], demonstrating an electrothermal propellant acceleration mechanism. The third category, electromagnetic EP, uses both electrical and magnetic fields to accelerate charged particles. Magnetoplasmadynamic (MPD) thrusters and pulsed plasma thrusters (PPTs) are the most common examples of this category. In PPT concepts, a strong current is driven through surface material to form an ablation plasma that carries the current from anode to cathode. Other concepts may use alternative ionization schemes, and require applied electric fields to drive the plasma. The plasma is accelerated to generate thrust via the Lorentz force of the magnetic fields acting on the plasma current. Figure 2.3 shows a schematic PPT. 2.1.2
Advantages and limitations
Electric propulsion offers several benefits over conventional chemical rockets, but also suffers from a few drawbacks. However, the gains in using an EP system can outweigh the losses for long-term or high-energy missions. One of the biggest advantages of EP devices is the high exhaust velocity and
17
Figure 2.2: Schematic of an ion engine [22], demonstrating an electrostatic propellant acceleration mechanism. corresponding high specific impulse. Specific impulse, or Isp , is the ratio of thrust T , to propellant weight flow rate as in Eq. 2.1. The weight flow rate is simply the product of the mass flow rate m ˙ and standard gravity at the surface of the earth g. Isp =
T mg ˙
(2.1)
Various types of EP devices span a range of Isp , from 500-2,000 s for arcjets, to 1,200-6,000 s for Hall thrusters, to 3,000-10,000 s for ion thrusters. For comparison, chemical rockets only range from 250-450 s Isp [24]. The benefit of higher Isp can be demonstrated from the ideal rocket equation, Eq. 2.2, which is derived from conservation of momentum for a system that is emitting mass [25]. For a system with initial total mass m0 that undergoes a maneuver with a total change in velocity △v, the final mass m after the maneuver is a function only
18
Figure 2.3: Schematic of a pulsed plasma thruster [23], demonstrating an electromagnetic propellant acceleration mechanism. of the specific impulse Isp and the gravitational constant g.
� � △v m = m0 exp − gIsp
(2.2)
A spacecraft mission has a known, required △v from orbital mechanics and a limited m0 based on the launch vehicle, so a higher specific impulse translates into more final payload mass after maneuvering. This can be put to use in several ways. One option is to increase the payload mass, since an EP system requires less propellant mass than a chemical system for a given mission. Alternatively, the mission or operational lifetime could be extended, since the EP system can achieve a larger △v for a fixed propellant mass. Another route altogether is to eliminate the propellant mass saved by using the EP system and reduce the total mass, possibly
19 allowing a less expensive launch vehicle to be used. These options can be combined to achieve a best compromise for a particular situation. Another benefit of EP is the flexible control of the devices. Many EP systems are capable of semi-independent control of propellant flow and electrical systems, which allows for throttling of the flow rate, operating voltage, and current to optimize performance at a desired thrust level. This is an improvement over solid rockets, which have no throttle control, and over liquid or hybrid rockets, which can only throttle the flow rate. A mission using EP systems has less restrictive launch windows than a mission using conventional rockets. Still another potential benefit of EP devices is the robustness of the underlying propulsive concept. Since the acceleration mechanism is not dependent on the particular propellant, an EP device could theoretically operate on a variety of different propellants. This could open the possibility of in situ propellant resupply for long-duration missions to comets or asteroids with volatile compounds. However, multiple-propellant thruster designs are beyond the current state of the art. The two main drawbacks to using an EP device stem from the practical limit on the maximum current density that can be sustained in an electrical arc or plasma current. In electrothermal applications this acts to limit the rate of energy deposition, while in electrostatic and electromagnetic applications this acts to limit the flow rate of accelerated exhaust. In both cases the consequence is that EP systems produce much smaller thrust than chemical systems. For example, thrust levels from EP devices range typically range from a few µN for ion thrusters to less than 10 N for arcjets. In contrast, chemical rockets can achieve 1 kN-1 MN of thrust [24]. As a further negative consequence of low thrust production, EP systems require much longer firing time than chemical systems. While a chemical rocket typically
20 operates for only a few minutes, an EP device must operate for months or years to achieve the full △v indicated from the ideal rocket equation. This introduces long-term performance issues as well as failure and lifetime concerns for EP systems. Low levels of thrust are not necessarily prohibitive, and certain applications only require low thrust levels. Stationkeeping and orbit transfers are well within the range of thrust provided by EP devices, although orbit transfers will take significantly longer than with a chemical system. Microsatellite formation flight and highprecision stationkeeping maneuvers both benefit from engines that can produce small but highly repeatable thrust bits. One notable example is the planned NASA Laser Interferometer Space Antenna (LISA) mission [26], which requires µN-levels of thrust to maintain proper positioning of the component spacecraft.
2.2
Experimental investigation of electric propulsion
Research on EP devices is ongoing and includes activities at every stage of development: theory and design of novel concepts, testing and validation of designs, long-duration life tests of mature designs, and studies of spacecraft integration issues. 2.2.1
Ongoing Research
Mature technologies such as Hall thrusters and ion thrusters are well characterized in terms of performance. Research related to these systems is directed toward extending operational lifetime, characterizing the spacecraft integration issues, and developing high power configurations. Since an EP device must operate for months or years, long-duration life tests are carried out in ground-based vacuum chambers. These tests often consider the issue from multiple viewpoints. From an application viewpoint, it is necessary to understand how the actual performance deviates from the ideal performance by mea-
21 suring changes in thrust, beam divergence, and efficiency over the lifetime of the device [27, 28]. From a design viewpoint, characterization of the wear and damage sustained during prolonged operation is useful for identifying and addressing failure modes, as well as estimating the time to failure. The exhaust plume from EP devices may include plasma, unaccelerated propellant, and materials eroded from the device. Different lines of research help characterize the resulting conditions near the spacecraft and consider how its performance is affected. Research into sputtering and deposition looks at the physical processes that erode material inside the thruster [29], and the transport and deposition of sputtered material and exhaust particles onto other spacecraft surfaces [30, 31]. Electromagnetic interference [31] is another concern, since charged particles in the exhaust plume can interfere with signal transmission to and from the spacecraft. There is strong interest in developing high power EP systems that can produce higher thrust levels while maintaining favorable Isp and efficiency. Research in this area is typically directed toward developing larger models of a device (the monolithic approach) [32] or toward developing clusters of existing smaller models of a device [33, 34, 35]. Challenges in a monolithic approach are related to fabrication and inadequate facilities for full-scale testing, while challenges for a clustering approach arise from operational difficulties due to the interaction between individual devices in a cluster. There is also an active interest in developing novel EP concepts. New designs may incorporate the better elements of two systems, as in hybrid Hall/ion thrusters [36], or extend EP concepts to entirely new designs as in microthruster and MEMS “thruster on a chip” concepts [37, 38]. Hybrid designs are often able to move quickly to a prototype, since much of the fabrication and operation is well understood from existing designs. The more radical MEMS concepts are currently at proof of concept
22 and early prototype stages. If the fabrication issues can be resolved, such concepts would offer even more flexible scalability and control than existing EP systems. 2.2.2
Vacuum facilities
Experimental testing is conducted in ground-based vacuum facilities. The largest academic facility in the United States is the Large Vacuum Test Facility (LVTF) at the Plasmadynamics and Electric Propulsion Lab (PEPL) at the University of Michigan [39]. The main chamber of the LVTF is a cylindrical vessel 9 m long, and 6 m in diameter. A diagram of the facility and several diagnostic instruments in Fig. 2.4 shows the complexity and scale involved. Smaller facilities are significantly less expensive to build, maintain, and operate, so chambers this large are rare.
Figure 2.4: Large Vacuum Test Facility at the University of Michigan [39]. Although the LVTF has a very high pumping rate of 240,000 liters per second on xenon, the facility still develops a measurable back pressure during operation of EP thrusters [12]. This residual background pressure is due to the finite pumping capacity and inevitable leaks and outgassing present in any vacuum facility.
23 The interpretation of experimental measurements is complicated by secondary effects of the background gas. At the thruster itself, background gas can be reingested and accelerated, artificially increasing the thrust and propellant efficiency. Collisions between accelerated particles and background particles in the exhaust plume can increase beam divergence, broaden the energy distribution, and produce low energy charge exchange ions. This affects measurements of current density and velocity distribution throughout the plume. 2.2.3
Probe diagnostics
Experimental measurements of many plasma properties can be made using relatively simple plasma probe diagnostics [40]. Three mainstay probe instruments are discussed below: the Faraday probe, the Langmuir probe, and the retarding potential analyzer (RPA). These probes offer good spatial resolution and have well-established techniques for interpreting the measurements. Non-intrusive optical diagnostics are available, but are not as widely used due to the greater cost and complexity. The nude Faraday probe is the simplest of probe devices, consisting of a current collecting surface that is large compared to the Debye length. One mode of operation is to apply a bias voltage to repel electrons, so that the probe measures only the ion current at a point in the plasma flow. Alternatively, the probe bias can be allowed to float to the plasma potential, so that the net current to the probe is zero. More complicated variations of the Faraday probe incorporate physical or electromagnetic filtering [41, 42] to screen out the electron current or undesired, random ion currents. The Langmuir probe consists of one or more current collecting wires that are immersed in the plasma. Several configurations are commonly used, including single, double, and triple probes [43, 44, 45]. These variations allow for simplifications in the
24 control system or in the analysis of measurements. Measurements from the current versus voltage characteristic of a Langmuir probe can be used to determine the plasma potential, the floating potential, the electron temperature, and the plasma number density. The RPA is somewhat more complicated than the previous probes, since it uses a series of biased screens to repel particles below a threshold energy while allowing higher energy particles to reach a collecting surface [40, 46]. By analyzing the derivative of collected current over a range of bias voltage, it is possible to extract the energy distribution function of the ions. Each of these probe diagnostics is immersed in the plasma flow and causes some disturbance relative to the unimpeded flow if the probe were not present. Recent experimental measurements of the plasma properties around an immersed Faraday probe show that the disturbed flow field around the probe can be observed [12]. In the diagnostic techniques, these disturbances are assumed to be relatively small and confined to a sheath and presheath region around the probe.
2.3
Computational modeling of electric propulsion
Computational research parallels many of the experimental investigations described previously. Experimental and computational investigations are often complementary, although some discrepancies persist between experimental measurements and computational results. 2.3.1
Computational techniques
Several types of EP devices including Hall thrusters, ion thrusters, PPTs, and MPDs generate strongly flowing, low density plasma exhaust plumes. Models of plasma behavior must describe particle motion, along with the self-consistent electric
25 and magnetic fields that govern the motion. Computational models must therefore be capable of solving the equations of motion for particles and the differential equations for electromagnetic fields. One of the earliest and most widely used computational techniques for simulating plasmas is the Particle In Cell or PIC method [47]. In this type of model the plasma is represented by a reduced number of macroparticles that obey the standard equations of motion and interact with discrete electric fields calculated on a computational grid. In brief, this method separates the particle motion from the calculation of fields and iterates to achieve a consistent solution. A related technique is Direct Simulation Monte Carlo or DSMC, which also uses macroparticles to simulate gases and incorporates probabilistic models to describe particle collisions [48]. This allows additional physical processes to be considered, including chemistry, ionization and recombination, and surface interactions. DSMC models can be combined with PIC models to add collisions and wall interactions to a plasma simulation. In Chapter V both PIC and DSMC techniques will be described in greater detail for the particular implementation used in this research. Under conditions where magnetic fields dominate particle motion, an alternative set of models is available. Magnetohydrodynamic (MHD) equations describe a magnetized plasma in the continuum limit, similar to the Navier-Stokes equations as solved in computational fluid dynamics (CFD) models. In non-equilibrium limits, a gyro-kinetic model is necessary to describe particle motion. This model is roughly analogous to the PIC model, but requires an average over the fast gyromotion of magnetically confined particles. Magnetic fields are not significant in the far field of a Hall thruster or ion thruster, so MHD and gyrokinetic models will not be discussed in this dissertation.
26 2.3.2
Ongoing research
Computational research in EP overlaps experimental investigations in almost every area. Lifetime issues are addressed by investigating sputtering and erosion processes in the thruster [49, 50]. Integration issues are considered through studies of deposition and implantation [51], plume backflow [52], and through plasma control to mitigate signal interference [53]. High-power cluster configurations are simulated to evaluate the performance, with near- and far- field studies to characterize the exhaust plume [54]. Preliminary modeling is already underway to characterize prototype MEMS devices [55]. A broader goal is to develop and refine computational models until they become sufficiently accurate to perform reliable assessment and characterization of EP devices. Meeting that goal would help streamline the design process for new devices and also enable more effective interpretation of experimental results. For example, a sufficiently robust computational model could be used to predict on-orbit performance of a high-power configuration from measurements made in small vacuum chambers where the pumping rate is too low. At this point there are few or no efforts to comprehensively improve model fidelity. However, narrowly focused efforts to improve specific aspects of a model are often incidental to a computational study. Variations of existing models are implemented to more accurately capture the physics involved in some aspect of a broader study. For a few examples: a wall sputtering model might be added to a thruster simulation in order to compare the calculated performance degradation with experimental results from a long-duration life test [56], or higher fidelity magnetic fields might be incorporated in a Hall thruster acceleration model to assess the impact on the near-field plume [57]. Additionally, many lines of research are directed toward
27 speeding up existing models, either by using alternative techniques to perform similar calculations or by optimization and parallelization of an existing computational code.
2.4
Need for simulation of plasma probes
Experimental and computational researchers continually share results in EP, so it is desirable to have a clear understanding of how experimental measurements relate to undisturbed plasma conditions. Electric propulsion devices produce highly non-equilibrium plasma flows. The most commonly used electromagnetic and electrostatic devices produce an exhaust plume consisting of high temperature electrons, high energy ions of various charge states formed in the thruster, high energy neutrals and low energy ions formed via charge exchange collisions, and low energy neutrals that diffuse out of the thruster without being ionized or accelerated. The plasma is low density, strongly flowing, and nearly collisionless as a whole. This is markedly more complicated than the simple conditions of isothermal electrons and cold drifting ions assumed in the theoretical analysis of some plasma probe measurement techniques. One important open question is how well the theoretical probe techniques perform for a more complex, realistic EP plasma flow. A computational setting is especially well suited to evaluating this question, since the plasma conditions can be specified explicitly and probe measurements can be simulated and analyzed according to standard diagnostic techniques. By moving incrementally from the ideal plasma of the diagnostic theory to a realistic plasma, it is also possible to isolate the effects of each deviation from the ideal assumptions. A second open question is how the insertion of a diagnostic probe disturbs the
28 plasma flow, and whether that disturbance introduces a systematic error in the measurements the probe makes. Put another way, it is not clear whether the disturbed conditions measured by the probe can be related back to the undisturbed plasma conditions. Again, a computational setting is ideal for investigating these effects since the undisturbed conditions are known explicitly as inputs. The remainder of this dissertation describes the development and use of computational models to help address these open questions.
Chapter III
Governing Equations and Analytical Sheath Models
The flow field around a Faraday probe is characterized by plasma interactions with physical surfaces and electrostatic sheaths. Since this involves numerous physical mechanisms and spans a broad range of scales, it is useful to first consider simplified conditions that can be solved analytically. This chapter introduces the classical descriptions of a plasma and the derivation and use of two analytical models. Later chapters will refer to these analytical models as reference cases. The first model is described as a shadowing model, alluding to physical obstruction of the flow by the probe body. The flow structures described in this model are on a scale comparable to the probe dimensions. Although the model is developed from a very general kinetic description of the plasma, the analytical solution is limited by the assumption of negligible electric and magnetic fields. Due to that limitation, the shadowing model is only a gasdynamic model and will not capture the more complicated plasmadynamic effects. The second model is a collisionless planar sheath model. In this model the flow structures are on a scale comparable to the Debye length, which is generally much smaller than the probe dimensions. This model is developed from a fluid description of the ion plasma, and accounts for coupling between the electric fields and the plasma
29
30 by solving the electrostatic Poisson equation. This model is a plasmadynamic model, and includes most of the relevant physical processes that occur in a sheath.
3.1
Plasma concepts and theories
Plasmas behave like gases in many regards, but the addition of free charged particles makes a plasma electrically conductive. At microscopic scales approaching and smaller than the Debye length, electrostatic forces between particles are significant. However, these inter-particle forces act to redistribute the charge in such a way that local charge is shielded and the plasma appears uniform over larger scales [58]. At the macroscopic scale, the bulk plasma exhibits collective behavior that is consistent with zero internal electric or magnetic fields. The charge shielding effect is not uniform near the edges of a plasma, for instance at a free surface interface with vacuum or at a conducting wall. External electric and magnetic fields influence charged particles near the edge of the plasma and generate a sheath [1, 2], which in turn acts to isolate the bulk plasma from the external fields. The sheath thickness is determined by the distance that external fields can penetrate into the plasma, and depends on the density and mobility of the charged particles. Like the charge shielding effect, sheath thickness scales with Debye length. 3.1.1
Kinetic description
A plasma is an ionized gas, so a theory that describes gas behavior is a reasonable starting point for describing a plasma. The kinetic theory of gases is a very successful theory based on a statistical description of a gas at the molecular level. Appropriate averages of microscopic properties such as velocity and collision rate can be related to the macroscopic temperature and pressure. Kinetic theory posits that a gas is composed of a very large number of particles
31 that interact only through collisions [59, 60, 61]. In the simplest form, the particles are assumed to be identical and devoid of internal structure so that a particle can be described completely by its position and velocity. A particle’s position and velocity at any later time can be found by integrating the equations of motion. The bulk gas can then be described by a time-varying distribution function f (x, v, t) of all the constituent particles over a phase space with three dimensions in both space and velocity. Since the initial positions and velocities of the particles are essentially random, the distribution function is evaluated statistically. Behavior of the gas then corresponds to evolution of the distribution function. The Boltzmann transport equation, Eq. 3.1, describes how the distribution function changes in space and time. Particles are advected in space due to their velocity � � ∂f ∂f v ∂x , and accelerated in velocity space by any external forces a ∂v . The collision operator C (v1 , v2 ) is a function that relates the initial and final velocities for colliding particles. In a dilute gas the particle size is much smaller than the average spacing between particles, and binary collisions dominate the collision operator. ∂f ∂f ∂f +v· +a· = C (v1 , v2 ) ∂t ∂x ∂v
(3.1)
Macroscopic properties of the gas are then obtained by taking moments of the distribution function as in Eq. 3.2. The zeroth and first moments respectively produce the density and mean velocity, and the second central moment yields temperature. n (x) =
Z
∞ −∞
n∞ f (x, v)dv
Z ∞ 1 hv (x)i = n∞ vf (x, v)dv n (x) −∞ Z ∞ 1 T (x) = n∞ (v − hv (x)i)2 f (x, v)dv n (x) −∞
(3.2)
32 A solution to Eq. 3.1 can be found for an unbounded gas at equilibrium, with no external forces. It can be shown that the collision term must be zero at equilibrium, corresponding to a detailed balance for the distribution. The energy partition function for the particles in the gas can be analyzed with statistical mechanics, leading to the functional form of the distribution. The remaining parameters of the distribution function can then be determined by comparing the kinetic moments of Eq. 3.2 with classical thermodynamic forms for entropy [61]. The resulting Maxwell-Boltzmann or “Maxwellian” distribution given in Eq. 3.3 describes a gas that is spatially uniform and does not vary in time. The more complicated space and time varying distributions required to describe practical flows are often intractable by analytic methods, and solutions must be obtained numerically. f (v) dv =
�
m 2πkB T
� 32
� � � m 2 2 2 v + vy + vz dv exp − 2kB T x
(3.3)
The kinetic description for a plasma is more complicated than for a gas. Most plasmas are partially ionized, meaning that the bulk plasma consists of neutral gas particles, ions, and electrons. Separate but coupled distribution functions are required for each species in order to completely describe the plasma. The Lorentz force, as given in Eq. 3.4, describes the electric and magnetic forces that act on the charged particles. aEM =
e (E + v × B) m
(3.4)
At the microscopic level, strong electromagnetic fields can drive collective drifts or confine particle motion to orbits about magnetic field lines. At the macroscopic level, several kinds of plasma waves arise due to the coupling between electric and magnetic fields as described in Maxwell’s laws [62].
33 In a plasma, collisions can also alter the species of the particles: charged particles can be formed in ionization collisions, lost in recombination collisions, or transferred in charge exchange collisions. A separate collision operator can be defined for each of these processes, including a collision operator between particles of a single species C (v1 , v2 ), a momentum exchange operator between different species CM (f1 , f2 ), a charge exchange operator between different species CC (f1 , f2 ) that can act as source or sink, an ionization source SI (f1 , f2 ), and a recombination sink SR (f1 , f2 ). For brevity, Eq. 3.5 defines a total collision operator CT ot that includes each of these components. CT ot = C (v1 , v2 ) + CM (f1 , f2 ) + CC (f1 , f2 ) + SI (f1 , f2 ) − SR (f1 , f2 )
(3.5)
The modified Boltzmann transport equation for the distribution function fj of one plasma species seen in Eq. 3.6 appears very similar to the earlier form for a gas [58]. All of the complications associated with a plasma have been grouped into more complicated acceleration and collision terms. A full solution for the plasma would require simultaneous solution of an equivalent expression for each ion, electron, and neutral species, which is considerably more difficult than for a single neutral gas species. ∂fj ∂fj ∂fj +v· + (a + aEM ) · = CT ot ∂t ∂x ∂v
(3.6)
More advanced versions of kinetic theory can be devised to incorporate elastic collisions, chemical reactions, and vibrational and rotational modes for molecules [61]. However, analytical solutions are only possible for very simple conditions, and numerical approaches must generally be used instead.
34 3.1.2
Fluid description
A macroscopic treatment of the flow through a control volume leads to conservation laws for mass, momentum, and energy. Together with a state equation, the conservation equations accurately describe the continuum behavior of a gas. This is not surprising since the conservation laws can be obtained from kinetic theory in the limits of continuum or equilibrium flow [59]. The degree of non-equilibrium in a flow is characterized by the Knudsen number in Eq. 3.7 as the ratio of mean free path between collisions λM F P to the relevant reference length of interest L. The fluid equations are appropriate when the Knudsen number is small, typically Kn < 0.01, and the flow is near equilibrium. Kn =
λM F P L
(3.7)
Starting from the kinetic model of a gas with an assumed Maxwellian distribution (Eq. 3.3), the zeroth, first, and second moments of the Boltzmann transport equation (Eq. 3.1) correspond to conservation of mass, momentum, and energy. A practical difficulty in this approach is that any moment of the transport equation involves contributions from the next higher moment. This closure problem is resolved by enacting a moment closure, where higher order moments are expressed in terms of lower order moments. In practice, a Chapman-Enskog expansion of the equilibrium function is taken to third order terms, and the fourth moment of the expanded distribution then depends only on the lower moments. Taking the moments of the Maxwellian distribution produces the Euler equations for inviscid fluid flow (Eq. 3.8). One significant limiting factor in the use of the Euler equations is that no gradient transport is possible. Physical phenomena such as heat
35 transfer and momentum transfer at a wall cannot be described. ∂ρ + ∇ · (ρv) = 0 ∂t ∂ (ρv) + ∇ · (ρvv) + ρa = −∇P ∂t ∂ (ρe) + ∇ · (ρev) + ρa · v = −P ∇ · v ∂t
(3.8)
The well known Navier-Stokes equations in Eq. 3.9 can be obtained in a similar fashion by starting with a first order Chapman-Enskog perturbation of the Maxwellian distribution [59]. Again, moments of the Boltzmann transport equation produce the conservation laws for mass, momentum, and energy. ∂ρ + ∇ · (ρv) = 0 ∂t ∂ (ρv) + ∇ · (ρvv) + ρa = −∇P + ∇ · τ ∂t
(3.9)
∂ (ρe) + ∇ · (ρev) + ρa · v = −P ∇ · v + τ : ǫ − ∇ · q ∂t The Navier-Stokes equations include gradient transport. Momentum transport occurs via shear stress and energy transport occurs via heat flux. However, the deviatoric shear stress tensor τ and heat flux vector q introduce a closure problem since neither is explicitly a function of the independent thermodynamic variables. Typically the equation set is closed by assuming constitutive relations, such as Newtonian fluid viscosity to replace the stress tensor and Fourier heat conduction to replace the heat flux vector. The constitutive relations may introduce additional transport coefficients such as viscosity and thermal conductivity that must be determined as well. Higher order perturbations of the Maxwellian distribution have been considered [59], leading to the Burnett equations. Such models suffer from the same sort of closure problems as the Navier-Stokes equations, and produce significantly more
36 complicated forms of the stress tensor and heat flux. Higher-order models are correspondingly more difficult to solve, and the Burnett equations in particular are unstable without higher-order corrections. Equivalent conservation laws can be developed for a plasma by including electromagnetic force contributions to momentum and energy [58]. Additionally, Maxwell’s laws are used to determine consistent electromagnetic fields. Typically the effects of viscous forces are negligible compared to electromagnetic forces, so contributions from the shear stress tensor are omitted here. Collisional resistance to electrical current affects momentum transport in the flow, giving rise to the resistive term ∼
j σ
and the electrical conductivity σ. The equation set in Eq. 3.10 is the basis of the magnetohydrodynamic (MHD) equations for a plasma. ∂ρ + ∇ · (ρv) = 0 ∂t e e j ∂ (ρv) + ∇ · (ρvv) + ρa + ρ (E + v × B) = −∇P + ρ ∂t m mσ ∂ (ρe) e + ∇ · (ρev) + ρa · v + ρ E · v = −P ∇ · v − ∇ · q ∂t m ∇·B=0
(3.10)
e (ni − ne ) ε0 ∂B ∇×E=− ∂t ∂E ∇ × B = µ0 j + ε0 µ0 ∂t ∇·E=
A number of analytic solutions to the MHD equations can be found after taking appropriate limits and substantially rearranging these equations. Such solutions describe many plasma waves, including magnetosonic waves and Alfven waves [63]. However, many practical situations are too complex for analytic solutions, and numerical solutions must be found instead.
37
3.2
Geometric Shadowing Model
The central premise of the shadowing model is that certain particle trajectories are blocked or shadowed in the vicinity of a physical obstruction. This shadowing causes the distribution function to differ from the distribution at points far from the obstruction. Since the macroscopic plasma properties are calculated as moments of the distribution, plasma at a shadowed point has different properties than unaffected plasma far from the surface. The model described here was originally developed in the context of strongly flowing, magnetically confined, tokamak fusion plasmas [5, 64, 65]. The derivation given here closely follows the approach described by Valsaque et al. [66]. One minor variation from that approach is to normalize the equations with length and velocity scales that are consistent with other models considered in this dissertation. 3.2.1
The Vlasov equation and shadowing solution
In the shadowing model, the inflowing plasma is fully ionized, neutral, and consists of electrons and an arbitrary distribution of ions. The ions are analyzed with a kinetic model derived from the Boltzmann transport equation. A steady, collision� less, planar sheath is assumed by taking the steady state ∂f = 0 and collisionless ∂t
(C = 0) limits in Eq. 3.1 and reducing the flow to one dimension. The resulting form in Eq. 3.11 is often referred to as the Vlasov equation. Note that the distribution function reduces to f (x, vx ) under these simplifications. vx
∂f ∂f + ax =0 ∂x ∂vx
(3.11)
The acceleration in this case simplifies to the contributions from the electric field along the direction of flow, as in Eq. 3.12. Since the flow is one dimensional,
38 there is no possible magnetic field orientation that would generate a magnetic force contribution along the direction of flow. The electric field is also rewritten in terms of the electric potential for convenience. ax =
e e dφ Ex = − mi mi dx
(3.12)
The diffusive source term in Eq. 3.13 is added to represent a random transfer of particles between the shadowed region in the sheath and the ambient plasma [66]. The ambient plasma has a freestream distribution function f∞ (vx ), which should be recovered from f (x, vx ) in the limit as x → −∞. A simple exchange frequency parameter w is defined that assumes a uniform diffusion rate of particles into and out of the sheath, regardless of location or particle velocity. SDif f usion = w (f∞ (vx ) − f (x, vx ))
(3.13)
The schematic diagram in Fig. 3.1 shows the coordinates of the shadowing sheath model and representative forms of the distribution function at a few points in the sheath. The surface of the probe is located at x = 0, and the plasma is confined to negative values of x upstream of the probe. The velocity is defined such that positive vx corresponds to forward flow, toward the probe surface, and negative vx corresponds to backward flow, away from the probe surface. The ambient plasma distribution is f∞ (vx ) and remains unchanged at all points in the sheath. The local distribution function in the sheath is f (x, vx ), and far from the probe the local distribution approaches the ambient distribution, f (x −→ −∞, vx ) = f∞ (vx ). At the surface of the probe, the distribution function for backward flowing velocities is identically zero, f (0, vx ) = 0 for vx < 0. The exchange frequency w is constant throughout the sheath, and determines the rate that particles diffuse between the ambient and local distributions.
f∞(v)
f∞(v)
Sheath Plasma
v
v
w
f∞(v)
w
f(-∞,v)
f(x,v)
v
v
w f(0,v)
v
v
Probe Surface
Ambient Plasma
39
x=0
Upstream
Figure 3.1: Schematic of the geometric shadowing model, showing the regions of the flow and the distribution function. Combining Eqs. 3.11-3.13 gives a differential equation for the distribution function throughout the sheath as in Eq. 3.14. That expression is only a model of the ion plasma. To model the neutral plasma, a similar expression for the electron plasma would be required and the electrostatic Poisson equation would close the set. vx
∂f e dφ ∂f − = w (f∞ (vx ) − f (x, vx )) ∂x mi dx ∂vx
(3.14)
Using the standard plasma parameters of Debye length, λD , and plasma frequency, ωP , as given in Eq. 3.15, this equation can be recast in the normalized variables of Eq. 3.16. The normalized velocity is represented as a Mach number M with respect to Bohm velocity, vB , and the normalized temperature τ is the ratio of ion to electron temperature. This choice of normalizations is consistent with the planar Bohm sheath model that will follow in Sec. 3.3. s r r ε0 kB Te e2 ne kB Te λD = , ωP = , vB = λD ωP = 2 e ne ε0 me me
(3.15)
40
z=
x w eφ ni (z) vx Ti ′ ,W = , Φ= , ni = ,M= ,τ= λD ωP kB Te ni,∞ vB Te
(3.16)
After normalizing and rearranging, the differential equation for f (z, M) is: M
∂f dΦ ∂f − = W (f∞ − f ) ∂z dz ∂M
(3.17)
In order to obtain an analytic solution it is necessary to assume negligible electric � = 0 , which produces the form in Eq. 3.18. The boundary conditions in fields dΦ dz Eq. 3.19 require the distribution function to approach the ambient distribution far from the probe surface, to have no backward flow at the probe surface. ∂f = W (f∞ − f ) ∂z 0, M ≤0 f (z → ∞, M) = f∞ (M) , f (0, M) = f∞ (M) , M > 0 M
(3.18)
(3.19)
This can then be solved as a non-homogeneous partial differential equation, and the solution takes the form shown in Eq. 3.20. Moments of the modified velocity distribution function can then be taken as defined in Eq. 3.2 to obtain the local density, mean velocity, and temperature. �
�
W f (z, M) = f∞ (M) 1 − H (−M) exp − z M
��
(3.20)
The Heaviside function H (−M) activates an exponential fall off in density for backward flowing particles (M < 0) as the flow approaches the surface. This aspect describes a shadowing effect where the backward flowing particles are not present at the surface, but diffuse into the sheath upstream of the surface. Forward flowing particles (M > 0) maintain the ambient density at all points in the sheath. This solution can also be easily modified to consider the sheath on a backward facing surface by changing the boundary conditions. In particular, the inequality in
41 the second condition in Eq. 3.19 must be reversed. The solution retains the same form except that the sign of the Mach number argument is switched in the Heaviside function. A few immediate observations can be made about this model. First, since the analytic solution neglects any electric and magnetic fields, this is only a gasdynamic model and cannot capture all of the behavior expected for charged particles in an electrostatic sheath. Second, the functional form of the ambient distribution function is not important in this solution, so it is applicable to any inflow condition. However, the nature of the ambient distribution is carried throughout the sheath. Third, this model cannot be translated to physical dimensions unless the normalized exchange frequency W is found. 3.2.2
Results and Discussion
The geometric shadowing model solves for the local ion distribution function in the sheath based on an arbitrary freestream distribution function. In order to facilitate comparison with the planar Bohm sheath model, the inflow distribution is assumed to be a Maxwellian. It is trivial to normalize one velocity component of the Maxwellian distribution function from Eq. 3.3 to the form seen in Eq. 3.21, with the two parameters of drift Mach number MD = temperature ratio τ∞ =
vD vB
and freestream ion to electron
Ti∞ . Te
1 (M − MD )2 f∞ (M) dM = √ exp − 2τ∞ 2πτ∞
!
dM
(3.21)
The direct result of the analytic solution is a modified distribution function calculated from Eq. 3.20. Examples of the distribution function at several positions in the sheath are shown in Fig. 3.2. The freestream plasma conditions and parameter values for this example are: equal ion and electron temperatures, τ = 1; ion
42
0.45 f∞(M) f(0.5,M) f(0,M)
0.4 0.35
f(z,M)
0.3 0.25 0.2 0.15 0.1 0.05 0
-2
0
2
4
M
Figure 3.2: Profiles of the local distribution function in the shadowing sheath solution. drift velocity equal to the Bohm velocity, MD = 1; and exchange frequency equal to the plasma frequency, W = 1. Changing the parameters of the ambient distribution function has the usual effect, with larger MD shifting the entire distribution to higher velocities and larger τ∞ acting to broaden the distribution. The effect of changing the exchange parameter W is to scale the rate of exponential falloff for the shadowed velocity range. A more meaningful alternative interpretation is that changing W scales the physical length of the shadowing sheath. As a practical note, the plasma frequency is the fastest time scale for the electrons. The rate of ion transfer presumably occurs on a slower time scale, so the normalized exchange frequency is expected to be small (W ≪ 1) for a physically realistic plasma. Far from the probe surface (z → −∞) the distribution approaches the Maxwellian of Eq. 3.21. For intermediate values of z, the distribution has an exponentially scaled probability for velocities less than zero, and retains the ambient distribution
43
1.1
’
ni
1
0.9
0.8
0.7 -10
-8
-6
-4
-2
0
z
Figure 3.3: Profile of ion number density in the shadowing sheath solution. for velocities greater than zero. At the surface (z = 0) the modified distribution is a truncated Maxwellian, with identically zero probability for all backward flowing velocities. The local distribution function is continuous at all z < 0, but has a discontinuity at z = 0. The thermodynamic properties of the local plasma are computed by taking the moments of the modified distribution at each position in the sheath. Since the modified distribution function is not an elementary function, the moments are obtained through numerical integration. The first moment of the distribution yields the local ion density profile in Fig. 3.3 and the second moment yields the mean velocity profile in Fig. 3.4. Each point on these profiles corresponds to an integral over the modified distribution function at that position in the sheath. Number density drops as the flow approaches the surface, since the backward flowing part of the distribution is shadowed out. Since only particles with negative
44
1.3
M
1.2
1.1
1
0.9 -10
-8
-6
-4
-2
0
z
Figure 3.4: Profile of ion mean velocity in the shadowing sheath solution. velocities are shadowed out, the mean velocity increases near the probe surface. This reflects the decrease in number of particles with negative velocity, but does not indicate any acceleration of the flow. Ion flux is not conserved through the sheath, since the diffusion process represented by the exchange frequency acts to transfer flux between the sheath and the ambient plasma. The local ion temperature profile can be computed from the second central moment of the local distribution, as in Fig. 3.5. The temperature shows a gradual decrease as the flow approaches the surface, since the distribution tends toward a smaller spread about a higher mean velocity. The low velocity tail becomes less significant in the temperature calculation as the probability of the shadowed velocities decreases near the probe surface. The electron properties and plasma potential are not solved in this model. In fact, the potential must be constant in order to comply with the assumption of
45
1.1
1
τ
0.9
0.8
0.7
0.6
0.5 -10
-8
-6
-4
-2
0
z
Figure 3.5: Profile of ion temperature in the shadowing sheath solution. zero electric fields. However, it is illustrative to relax that assumption and derive a plasma potential from the ion density profile. This can be accomplished by assuming plasma neutrality, so that the local electron density is equal to the ion density, and then further assuming the Boltzmann relation for the electrons, so that the electron density is a function of the plasma potential. The resulting expression for the potential is a function of the ion density as in Eq. 3.22, and the resulting potential profile is shown in Fig. 3.6. In this form it is assumed that the potential far from the surface is zero, and the potential at the surface cannot be assigned. � ′� Φ (z) = ln ni
(3.22)
Valsaque et al. have compared this derived potential profile with the potential profile obtained from numerical kinetic simulations that include electric fields [66]. The analytical shadowing profile shows surprisingly good agreement with the kinetic
46
0.02 0 -0.02 -0.04
Φ
-0.06 -0.08 -0.1 -0.12 -0.14 -0.16 -0.18 -10
-8
-6
-4
-2
0
z
Figure 3.6: Profile of plasma potential in the shadowing sheath solution. model results in that paper, prompting the conclusion that electric field effects are not predominant and that geometric shadowing is the primary mechanism that drives ion properties in the sheath. The primary effect of the electric field seems to be a smoothing of the distribution function that avoids the abrupt change in derivative at M = 0 that appears in the analytical distribution function. While there is some support for the accuracy of the derived potential, the geometric shadowing model remains fundamentally a gasdynamic model. The trends observed in the local ion density, velocity, and temperature profiles are all consistent with a neutral, expanding flow. Essentially, the backward flowing particles behave as a counterflowing wake region superimposed on the uniform forward flow. A more meaningful alternative interpretation is that backward flowing particles expand into the sheath from the ambient plasma in order to replace the particles that are shadowed out by the surface.
47
3.3
Collisionless Planar Bohm Sheath
One of the earliest solutions to the plasma sheath is the collisionless planar Bohm sheath model. In this solution, a neutral plasma is modeled with a collisionless fluid description of the ions and the Boltzmann relation for the electrons. Self-consistent electrostatic fields are determined through the electrostatic Poisson equation. The concept of a presheath and an important stability criterion are introduced in the analysis of this sheath model. The derivation presented here is unique in that it considers multiple ion species with arbitrary charge states. This form is useful for application to the complicated ion distributions expected in an EP exhaust plume. The original single species form can be easily recovered at any point, and is better suited to demonstrate the Bohm criterion. 3.3.1
Fluid equations and a solution
The inflowing plasma in this model is fully ionized, neutral, and consists of isothermal electrons and one or more cold ion species (i.e., Ti = 0) flowing toward a perfectly absorbing surface [1, 3]. In the sheath, electrons and ions only interact with the self-consistent potential field. For simplicity, the potential is assumed to be zero and have zero gradient at the sheath edge, φ (x = 0) = 0 and ∇φ|0 = 0. At the surface, the potential is a fixed negative value φ (x = L) = −φw . This geometry is shown schematically in Fig. 3.7. The thickness of the sheath L is not known initially. Under the assumptions that the sheath is steady, collisionless, and planar, conservation of mass for each ion species reduces to conservation of mass flux as in Eq. 3.23, which can be further simplified to conservation of number flux by dividing through by the ion mass. The subscript j refers to the j th ion species, and the subscript s
48
Figure 3.7: Schematic of the planar Bohm sheath geometry. denotes properties at the edge of the sheath. mj njs vjs = mj nj vj
(3.23)
Conservation of energy in a steady, collisionless, planar sheath reduces to the � Lagrangian form in Eq. 3.24, consisting of a kinetic energy term 21 mv 2 and an electrostatic potential energy term (eφ). The ion charge state is an integer multiple Zj of the electron charge, which factors into the potential energy term. 1 1 2 mj vjs = mj vj2 (x) + Zj eφ (x) 2 2
(3.24)
The velocity at any point in the sheath can then be related to initial velocity and local plasma potential by rearranging the conservation of energy to the form in Eq. 3.25. This intermediate result can be combined with the conservation of number flux to yield Eq. 3.26, which expresses the local ion density only in terms of the
49 sheath edge properties and the local plasma potential. � �1/2 Zj eφ (x) vj (x) = vjs 1 − 2 2 mj vjs
(3.25)
� �−1/2 Zj eφ (x) vjs = njs 1 − 2 nj (x) = njs 2 vj (x) mj vjs
(3.26)
The isothermal electron fluid is assumed to follow the Boltzmann relation throughout the sheath. Since the inflowing plasma is neutral, the electron density at the sheath edge must be equal to the total positive charge density due to the ions. That density is found by taking a sum over all ion densities, weighted by the charge state of each species. The resulting nes in Eq. 3.27 gives the electron density at the sheath edge. nes =
X
(3.27)
Zj njs
The sheath edge becomes the preferred reference point for the Boltzmann relation, Eq. 3.28, since both the potential and electron density are known there. ne (x) = nes exp
�
eφ (x) kB Te
�
(3.28)
In Eq. 3.29 the electrostatic Poisson equation relates the potential to the local charge densities. A weighted sum over the various ion species is necessary to obtain the positive charge density. � d2 φ e �X =− Zj nj (x) − ne (x) dx2 ε0
(3.29)
Inserting Eqs. 3.26 and 3.28 into this form produces the non-linear differential equation for potential shown in Eq. 3.30. To simplify the notation, φ (x) is written as φ from this point on. � � X � �−1/2 2 dφ e eφ Zj eφ = nes exp − Zj njs 1 − 2 2 2 dx ε0 kB Te mj vjs j
(3.30)
50 This equation can be recast using the normalized variables of Eq. 3.31. The Debye length λD and Bohm velocity vB are appropriate length and velocity scales, and the Mach number with respect to Bohm velocity appears. A new parameter rjs is the freestream charge fraction for the j th ion species. z=
vj eφ njs x , Mj = , Φ= , rjs = λD vB kB Te nes
(3.31)
The differential equation takes the form in Eq. 3.32 after normalizing and rearranging. � �−1/2 X d2 Φ Zj Φ = exp (Φ) − Zj rjs 1 − 2 2 dz 2 Mj
(3.32)
j
This form can be integrated once analytically by multiplying the entire expression by
dΦ dz dz
as shown in Eq. 3.33. The limits of integration are from the sheath edge at
z = 0 to any arbitrary position in the sheath, 0 < z < L. The boundary conditions on potential at the sheath edge are Φ (0) = 0 and
dΦ | dz 0
= 0. Note that each term in
the summation can be integrated separately. Z
0
z
d2 Φ dΦ dz = dz 2 dz
Z
0
z
dΦ exp (Φ) dz − dz
Z
0
z
X j
� �−1/2 Zj Φ dΦ Zj rjs 1 − 2 2 dz Mj dz
(3.33)
The slightly more complicated form in Eq. 3.34 is found after integration. At this point a numerical method is required to integrate a second time to obtain the potential. The modified form in Eq. 3.35 is better suited to numerical integration, although some care must be taken to choose the proper root of the radical. "� # � �2 �1/2 X 1 dΦ Z Φ j = exp (Φ) − 1 + rjs Mj2 1−2 2 −1 2 dz Mj
(3.34)
j
v u "� # � 1/2 u X dΦ u Zj Φ 2 t2 = exp (Φ) − 1 + rjs Mj 1−2 2 −1 dz Mj
(3.35)
j
Since the length of the sheath is not known, it is useful to perform a coordinate transform such that the probe surface is at z = 0 and then integrate this equation
51
0
Φ, e/kBTe
-1
-2
-3
-4
-5 -20
-15
-10
-5
0
z, λD
Figure 3.8: Profile of plasma potential in the Bohm sheath solution. by marching from the surface out to the sheath edge at z = −L. Since the potential at the surface is known,
dΦ dz
can be calculated and Eq. 3.35 can then be solved
as an initial value problem. This approach reveals that the solution for potential approaches Φ = 0 asymptotically, leading to an infinitely long sheath. In practice, the solution can be terminated at an arbitrary distance or potential. An example solution is obtained for the case M = 1. The profile of plasma potential is shown in Fig. 3.8. Once the potential has been obtained, the local plasma properties can be calculated from previous expressions. The ion velocity and density can be calculated from Eqs. 3.25-3.26, and the electron density can be calculated from Eq. 3.28. The profiles of ion and electron density are shown in Fig. 3.9. 3.3.2
The Bohm criterion
Since the conditions for a steady solution are not readily apparent from Eq. 3.35, consider the simplification to a plasma with one species of single charge ions. The
52
1.1 1
Number density, nes
0.9 0.8 0.7
ni ne
0.6 0.5 0.4 0.3 0.2 0.1 0 -20
-15
-10
-5
0
z, λD
Figure 3.9: Profiles of ion and electron number density in the Bohm sheath solution. summation over species simplifies to a single term, the freestream charge fraction becomes rjs = 1, and the charge state becomes Zj = 1 as in Eq. 3.36. The boundary conditions on potential at the sheath edge remain Φ (0) = 0 and
dΦ | dz 0
v ( "� #) u �1/2 dΦ u Φ 1−2 2 −1 = t2 exp (Φ) − 1 + M 2 dz M
= 0.
(3.36)
The quantity in the radical must be positive for a non-oscillatory sheath solution, and this imposes a constraint on the Mach number when the potential Φ is small. In order to evaluate that constraint, both terms containing the potential are expressed as Taylor expansions about Φ = 0 in Eqs. 3.37 and 3.38, following the analysis by Bohm [3]. The expansions are carried out to second order, since the lower order terms will cancel out. Φ2 + ... 2 � � � �2 1 2 1 2 =1− Φ − Φ + ... 2 M2 8 M2
exp (Φ) = 1 + Φ + �
�1/2 2 1 − 2Φ M
(3.37) (3.38)
53 The expansions are then inserted into the argument of the radical in Eq. 3.39 and simplified to the result in Eq. 3.40. The inequality indicates the condition to ensure a stable sheath solution. " # � � � �2 Φ2 1 2 1 2 1+Φ+ − 1 + M2 1 − Φ − Φ −1 ≥0 2 2 M2 8 M2 Φ2 2
� � 1 1− 2 ≥0 M
(3.39)
(3.40)
Drawing a conclusion from the inequality, a steady solution for the sheath only exists if M > 1. This is the Bohm criterion, which has the physical interpretation that the ion speed must be greater than the Bohm velocity at the edge of the sheath. However, in many applications a stationary bulk plasma is in contact with a surface. In such cases a presheath region is required, where small electric fields act to accelerate ions up to the Bohm velocity at the edge of the sheath. A presheath requires the original assumption of zero electric field at the sheath edge to be relaxed. 3.3.3
Results and Discussion
Exact similarity with the geometric shadowing sheath model conditions cannot be achieved. However, the potential at the surface and the inflow Mach number can be matched in order to facilitate a comparison between the results from both models. The shadowing model example was solved for a single ion population with a Mach number MD = 1, and the calculated potential at the probe surface in Fig. 3.6 is Φw = −0.1728 at z = 0. These conditions satisfy the Bohm criterion, so the same wall potential and Mach number are assumed in this example solution of the Bohm sheath model. The differential equation in Eq. 3.36 is solved for the potential profile in the sheath as shown in Fig. 3.10. Since the Bohm criterion is satisfied, the solution has
54
0.02 0 -0.02 -0.04
Φ
-0.06 -0.08 -0.1 -0.12 -0.14 -0.16 -0.18 -15
-10
-5
0
z
Figure 3.10: Profile of potential from the Bohm sheath. no oscillatory aspect and decreases monotonically from the freestream to the surface at z = 0. The potential asymptotically approaches zero far from the surface as mentioned previously. The ion and electron densities can then be calculated from this potential using normalized forms of the Boltzmann relation from Eq. 3.28, and local ion density from Eq. 3.26. The Bohm sheath solution indicates a non-neutral region near the probe, as evidenced by separation of the density profiles in Fig. 3.11. The nonneutral region is a physically meaningful feature, since the large disparity between ion and electron mass makes the electrons more mobile than the ions. Electrons respond to the negative probe potential more strongly than ions, leading to a region of non-neutral plasma near the surface. Although both ion and electron density decrease as the flow approaches the surface, two different processes are responsible. The negative potential acts to accelerate
55
1.1 n’i n’e
’
ni, ne
1
’
0.9
0.8
0.7 -15
-10
-5
0
z
Figure 3.11: Profiles of ion and electron density from the Bohm sheath. the ions toward the probe, as seen from the profile of ion velocity in the sheath in Fig. 3.12. The flux is the product of local density and local velocity, and it is clear from Eqs. 3.25-3.26 that the flux must be constant for the ions. Since the ion flow maintains a constant flux, the ion density decreases as the ion velocity increases. In contrast, the negative potential acts to repel the electrons, so only those electrons with sufficient initial kinetic energy are able to reach the local potential. In this model the electrons follow the Boltzmann relation, so the electron density shows an exponential fall off as the potential decreases. Since the wall potential is relatively small compared to the electron temperature in this example, there is not a significant decrease in electron density. One of the attractive features of the Bohm sheath model is that the solution can be readily returned to dimensional variables if the electron temperature and freestream density are known. This process is equally straightforward for the situation with
56
1.3
M
1.2
1.1
1
0.9 -15
-10
-5
0
z
Figure 3.12: Profile of ion velocity from the Bohm sheath. multiple ion components. This makes the Bohm sheath a useful tool for practical design purposes in both experimental and computational settings.
3.4
Comparison of model results
The geometric shadowing sheath model and the planar Bohm sheath model cannot reproduce exactly the same inflow conditions. This limitation stems from the different assumptions about the inflowing ions made in the models. The Bohm sheath model assumes one or more cold ion species, with zero ion temperature, while the shadowing sheath model assumes a Maxwellian ion distribution with a non-zero temperature. The shadowing sheath model could achieve a cold ion condition by taking the limit of τ∞ = 0, corresponding to an ion temperature that is negligible compared to the electron temperature. However, that causes the normalized Maxwellian distribution (Eq. 3.21) to approach a delta function at the drift Mach number. All of the
57 interesting behavior in the shadowing model derives from partial shadowing of the distribution function, so that limit would produce constant properties throughout the sheath. Instead, it is more useful to achieve partial similarity by matching the inflowing ion Mach number and some property at the surface. The obvious choice is to set the potential at the surface, since that is usually controlled in experimental applications. In the shadowing sheath model however, the surface potential is not coupled into the solution and is only found afterward. As such, the shadowing sheath model must be solved first, and the calculated surface potential can then be used in the Bohm sheath model. This process was carried out in Secs. 3.2.2 and 3.3.3. The ion density profiles offer the most meaningful comparison, since both sheath models actually calculate ion density. Then a visual inspection of Fig. 3.3 for the shadowing sheath and the ion density profile of Fig. 3.11 for the Bohm sheath gives some insight into how well the models agree. At first glance, there seems to be no agreement at all. The profile in the shadowing model shows a thin sheath, with all of the density variation occurring within 5 Debye lengths of the surface. The profile from the Bohm sheath model shows a much thicker sheath, with nearly 7% deviation from the freestream density at more than 15 Debye lengths from the surface. However, the shadowing sheath model has one undetermined parameter, the exchange frequency W . The exchange frequency is equal to the plasma frequency in the previous solution, which implies that ion particle exchange occurs on an electron timescale. In fact the ion exchange frequency should occur on an ion timescale, which would correspond to a much smaller value of W . The exchange frequency modifies the length scale of the shadowing sheath, and a smaller value produces a thicker
58 sheath. An estimate of the exchange frequency that brings the shadowing sheath model into better agreement with Bohm sheath model is obtained by a least-square error technique. An ion number density profile is computed from the shadowing sheath model for varying W . Since the distribution at the surface is not affected, the potential at the surface is unchanged and the previous Bohm sheath solution can be used as a fixed reference. A value of W is found that minimizes the sum of square error between the ion density profiles from both models, computed at 1500 fixed points along the profiles. For the inflow conditions of MD = 1 and τ∞ = 1, the least-square fit for the exchange frequency is found to be W = 0.088. The resulting profiles of ion density are shown in Fig. 3.13, and profiles of potential are shown in Fig. 3.14. For the ion density the agreement between the shadowing sheath model and the Bohm sheath model is generally very good. The potential shows larger discrepancies, but recall that in the shadowing sheath model the potential is assumed to be related to the ion density via neutrality and the Boltzmann relation. It should be noted that the value of the exchange frequency reported above is only effective at the given flow conditions. There is no single value that can achieve consistent agreement between the two sheath models over a broad range of plasma conditions. It may be possible to develop a functional form of the exchange frequency as W (MD , τ∞ ), but that lies beyond the scope of this work. From a philosophical viewpoint, the two models are intended to describe different aspects of the sheath. The Bohm sheath model isolates the effects of self-consistent electrostatic fields, while the shadowing model isolates the effects of non-equilibrium in the local distribution function. Together these models provide some understand-
59
1.1 Shadow Bohm
’
ni
1
0.9
0.8
0.7 -15
-10
-5
0
z
Figure 3.13: Profiles of ion density from the Bohm sheath and the best-fit shadowing sheath.
0.02 Shadow Bohm
0 -0.02 -0.04
Φ
-0.06 -0.08 -0.1 -0.12 -0.14 -0.16 -0.18 -15
-10
-5
0
z
Figure 3.14: Profiles of potential from the Bohm sheath and the best-fit shadowing sheath.
60 ing of the physical processes at work, and form the foundation for more advanced modeling techniques. In the next chapter, a computational code is discussed that incorporates elements from the kinetic description and the fluid description in order to achieve a high-fidelity simulation of a plasma.
Chapter IV
Hybrid Fluid PIC-DSMC Numerical Model
A recurring theme is that the governing equations for a plasma cannot be solved analytically for most practical applications. As a result, a variety of techniques have been developed to obtain numerical solutions to the kinetic models, Euler equations, Navier-Stokes equations, and MHD equations. This chapter describes a hybrid model that incorporates both a particle method and a fluid method to describe a plasma. When choosing a numerical model it is important to identify the degree of nonequilibrium in the flow. For strongly collisional flows that remain near equilibrium, a fluid method is much less computationally intensive than a particle method and should produce equally accurate results. At the other extreme, nearly collisionless flows or flows that incorporate a strongly non-equilibrium process may require a particle method to obtain accurate results at all. In some cases one region of a flow might be adequately treated with a fluid method, while another region of the flow requires the increased fidelity of a particle method. Flows with localized nonequilibrium can benefit from hybrid techniques described by Schwartzentruber et al. [67] that use either fluid or particle methods for distinct regions of a flow. Plasmas are composed of both ions and electrons, and the large mass ratio between those particles introduces additional forms of non-equilibrium. Ionization en-
61
62 ergy from generating the plasma is carried primarily by the electrons, resulting in a higher temperature for electrons than for ions. The combination of higher temperature and lower mass leads to a higher collision rate for electrons, so that the electron relaxation time is much shorter than the ion relaxation time. Although collisions between ions and electrons generally act to bring the entire plasma toward equilibrium, the mass ratio makes these collisions much less effective than collisions between two electrons or collisions between two ions. Since there is a significant difference between the electron and ion time scales, it is useful to consider an intermediate time scale where the ion motions are accurately resolved and the electron motions can be averaged. This leads to a hybrid approach that uses a particle method to model the ions and a fluid method to model the electrons. Hybrid techniques of this sort have been used successfully for EP modeling [68, 69, 70], and are also well-suited to plasma diagnostic modeling.
4.1
Ion and neutral particle models
It is not feasible to solve the full kinetic description of an ion plasma, but probabilistic particle simulations incorporate much of the same underlying physical reasoning. Two complementary methods are used to model the ion and neutral particles in this work. The Particle In Cell (PIC) method is used to move the ion and neutral particles and to calculate self-consistent electric fields that act on charged particles. The Direct Simulation Monte Carlo (DSMC) method is used to model particle collisions. 4.1.1
Particle In Cell
The motion of a charged particle is determined by the collective electric and magnetic fields generated by all other charged particles in the plasma. In order to obtain
63 a physically meaningful solution, the differential equations for electric and magnetic fields in Maxwell’s laws must be solved in tandem with the particle equations of motion. The PIC method [47] accomplishes this by tracking macroparticle motion and electric field calculations on a computational grid. Each macroparticle represents many ions or neutrals, and is assigned average properties from the prescribed distribution function. Particle movement can be decoupled from the field calculations by choosing a time step such that the displacement is small and the local fields do not vary significantly. This method consists of the following four main steps. First, the charge density is weighted from particle position to the nodes of the computational grid. In this work, the weighting scheme is a simple bilinear interpolation for an axisymmetric, structured, rectangular grid. Alternative weighting schemes can be devised for this and other computational grid geometries. Second, electric fields are calculated by solving the appropriate electrostatic or electrodynamic equation over all the nodes of the computational grid. Often the electric potential is solved instead by using the electrostatic Poisson equation, and electric fields are then calculated from the gradient of the potential. Maxwell’s equations must be solved if magnetic fields are significant or if accurate time evolution is required. Third, the particle acceleration is calculated by weighting the electric fields from the nodes to the particles. The particle velocity can then be updated as well. Again, a simple bilinear interpolation is used in this work. Fourth, particles are moved for a time step with the new velocity. Any boundary interactions are handled at this point, including particle injection at the inlet and particle removal at edges. The velocity of new particles is assigned probabilistically
64 from the assigned distribution function at the inlet. These four steps are then repeated over a desired number of iterations. Depending on how the particles are initialized in the computational domain, some initial transients may occur. Sampling of the instantaneous density and electric fields allows the statistical scatter to be reduced over a number of iterations. The PIC method is essentially a collisionless formulation of kinetic theory for a plasma. However, collisions provide the mechanism for ionization and recombination and contribute to the electrical resistance in a plasma. Since these processes may affect the current, it is important for a plasma diagnostic simulation to have the capability to model collisions. 4.1.2
Direct Simulation Monte Carlo
Collisions are incorporated through the DSMC method, which was developed extensively by Bird [48]. Since the actual number of particles and collisions is far too large for direct simulation, DSMC tracks macroparticle motion on a computational grid. At each collision time step, particles are paired up by computational cell and collisions are evaluated statistically. This method can be readily integrated with the PIC method to include both collisions and charged particle motion with selfconsistent electric fields. In a PIC-DSMC formulation, the main role of the DSMC method is to handle collisions. This involves a series of calculations to determine the number of collisions in each cell, the collision probability for each pair of particles, and the new particle properties after a collision occurs. The number of simulated collisions in a cell can be calculated by taking the product of collision frequency and the collision time step, with an additional factor
65 accounting for the macroparticle weights in the cell. The result from kinetic theory in Eq. 4.1 gives the collision frequency νab of species a with species b as a function of the density of the target species nb , the mean relative speed vab , and a collision cross section σab [59]. In this work only xenon-xenon collisions are modeled. A variable hard sphere (VHS) model with ω = 0.12 is used to calculate the atom-atom collision cross section as in 4.2. The cross section for atom-ion charge exchange collisions is given by the empirical fit in Eq. 4.3 [71]. In these expressions the relative speed is in units of
m . s
No ion-ion collisions are modeled. νab = nb vab σab 2.12 × 10⁻¹⁸ m2 2ω vab � �− 3 12.13 2 = 2 [142.21 − 23.30 log |vab |] × 10−20 m2 13.6 σXe−Xe =
σXe−Xe+
(4.1) (4.2) (4.3)
A random pair of particles is selected from the cell for each simulated collision. Whether or not the collision occurs is determined statistically by an acceptancerejection method, where a random number is compared to the collision probability. If the random number is larger than the probability, the collision occurs and the particles velocities are processed. The post-collision particle velocities are calculated as a result of random scattering, subject to conservation of momentum and energy for the particles. A new relative velocity is calculated, and a new angle is selected. The new velocities for both particles are then calculated from the new relative velocities and the center of mass velocity. These steps are repeated at every collision time step. As was assumed in the PIC method, the collision time step is small enough that particle displacement is small and the particle movement can be decoupled from the collision calculations. Again,
66 sampling can be used to reduce the statistical scatter introduced by this treatment of the collisions.
4.2
Electron fluid models
The electron fluid models used in this work are derived from the MHD equations presented in Chapter III. Three distinct models are used: the Boltzmann model, the non-neutral detailed model, and the Poisson-consistent detailed model. These models progressively increase the fidelity of the electron fluid from a simple Boltzmann relation to a coupled electrostatic fluid model. Each of the models has unique requirements and limitations as described in the following sections. 4.2.1
Derivation from electrostatic MHD equations
Each of the three electron fluid models can be derived from the electrostatic MHD equations. The electrostatic MHD equations are obtained by taking the limit of zero magnetic fields (B = 0) in the fluid conservation laws and Maxwell’s laws. The resulting equation set includes conservation of mass or continuity, Eq. 4.4, conservation of momentum, Eq. 4.5, conservation of energy, Eq. 4.6, and the electrostatic Poisson equation, Eq. 4.7. These equations are written specifically for an electron fluid, and the negative electron charge has been taken into account by adjusting the signs of the relevant terms. ∂ρe + ∇ · (ρe ve ) = 0 ∂t
(4.4)
∂ (ρe ve ) e e je + ∇ · (ρe ve ve ) = −∇Pe − ρe E + ρe ∂t me me σ
(4.5)
∂ (ρe e) e + ∇ · (ρe eve ) = −Pe ∇ · ve − ρe E · ve − ∇ · q ∂t me e ∇ · E = (ni − ne ) ε0
(4.6) (4.7)
67 A number of assumptions and simplifications are common to all three electron fluid models. The first simplification is to take the steady state limit, so that
∂ ∂t
=0
in each of the conservation laws. The density ρe in the conservation laws is rewritten in terms of number density ne according to Eq. 4.8. This provides a single consistent variable for the conservation laws and the electrostatic Poisson equation, and also avoids any numerical complications from working with the small value of the electron mass. ρe = me ne
(4.8)
The ideal gas law is assumed as the equation of state for the electron fluid. The pressure and internal energy can then be replaced by the forms in Eq. 4.9 and Eq. 4.10, which use the density and temperature. Pe = ne kB Te e=
3 kB Te 2 me
(4.9) (4.10)
The electric field is expressed in terms of the plasma potential φ as given in Eq. 4.11. With this substitution, the electrostatic Poisson equation becomes a mathematical Poisson equation for the potential. E = −∇φ
(4.11)
The heat flux vector is assumed to follow the Fourier heat conduction law given in Eq. 4.12, with the electron thermal conductivity κ as a parameter. q = −κ∇Te
(4.12)
The electron transport coefficients are evaluated using the basic definitions from molecular transport [60]. The electrical conductivity σ in Eq. 4.13, and the thermal
68 conductivity κ in Eq. 4.14, both depend on the total electron collision frequency νe . σ=
ne e2 me νe
2 2.4ne kB Te κ= me νe
(4.13) 1
1+
ν√ ei νe 2
!
(4.14)
The total electron collision frequency is the sum of the electron-ion collision frequency νei and the electron-neutral collision frequency νen as defined in Eq. 4.15. The electron-ion collision frequency in Eq. 4.16 is calculated from classical elastic scattering [60], while the electron neutral collision frequency in Eq. 4.17 is calculated using an empirical fit [72] of the electron-neutral cross section Qen (Te ) in the general form of Eq. 4.1.
νei = ni
√
4 2π 3
�
me kB Te
νe = νei + νen �2 � � 32 � 3 � 12 e2 ε k Te 0 B ln 12π 4πε0 me e2 ne � �1 4 8kB Te 2 = nn Qen (Te ) 3 πµen
� 32 �
νen
(4.15) (4.16)
(4.17)
After making these assumptions and substitutions, the equation set can be written as in Eqs. 4.18-4.21. The remaining terms on the left hand side of the momentum and energy equations have been expanded and simplified using the continuity equation. In this form it appears that there are four coupled equations for five independent variables: ne , ve , Te , φ, and je . However, the current can be expressed in terms of the density and velocity as je = ene ve . For now the current is left in place as a reference marker for further manipulation. ∇ · (ne ve ) = 0 je me ne ve ∇ · ve = −∇ (ne kB Te ) + ne e∇φ + ne e σ � � 3 ne ve · ∇ kB Te = −ne kB Te ∇ · ve + ne e∇φ · ve + ∇ · (κ∇Te ) 2
(4.18) (4.19) (4.20)
69 ∇2 φ = −
e (ni − ne ) ε0
(4.21)
Following the example of Boyd and Yim [73], there are a few additional manipulations that will simplify the numerical solution. By introducing a stream function Ψ as defined in Eq. 4.22, the continuity equation becomes a Laplace equation as given in Eq. 4.23. With this modification, all of the differential equations from the conservation laws and the electrostatic Poisson equation are ultimately expressed in terms of the Laplacian operator. A single solution technique can then be used to solve each of the differential equations. ∇Ψ = ne v
(4.22)
∇2 Ψ = 0
(4.23)
The momentum equation can be simplified by neglecting the inertial term (∼ me ne v), since it is much smaller than the other terms. The remaining terms can then be rearranged as Eq. 4.24 to isolate the electron current. �
kB je = σ e
� � � ∇ne ∇Te + Te − ∇φ ne
(4.24)
The energy equation can be rearranged as shown in Eq. 4.25, which facilitates a solution for the temperature. 2
∇ Te +
�
� � � ∇κ 3 kB kB e − ne v · ∇Te − ne ∇ · v Te − ne ∇φ · v = 0 κ 2 κ κ κ
(4.25)
All three electron fluid models work with this modified set of equations: the electrostatic Poisson equation, Eq. 4.21, the continuity equation, Eq. 4.23, the current equation, 4.24, and the temperature equation, Eq. 4.25. Further development of the three models diverges at this point, so each model is described separately in the following sections.
70 4.2.2
Boltzmann model
The Boltzmann model is obtained by making the assumptions that lead to the Boltzmann relation. Briefly, the electron fluid must be unmagnetized, collisionless, isothermal, and currentless. The first assumption, that the fluid is unmagnetized, has already been made early in the preceding development as B = 0. The collisionless assumption is equivalent to the limit νe → 0. Referring to the transport coefficients in Eqs. 4.13 and 4.14, this limit corresponds to infinite electrical and thermal conductivities. This is actually consistent with the other assumptions of isothermal and currentless fluid. A gradient in temperature drives heat flux, which acts to reduce the gradient. In the limit of infinite thermal conductivity, the heat flux redistributes the thermal energy instantaneously and produces a uniform temperature. A uniform charge distribution results from the limit of infinite electrical conductivity, so no gradient in charge exists to a drive current. The isothermal assumption makes Te constant throughout the flow, which replaces the temperature equation of Eq. 4.25 entirely. It also eliminates a term from the current equation, since ∇Te = 0. The currentless assumption is applied by setting je = 0 in the current equation. Factoring out the conductivity leaves only two terms from the right hand side of Eq. 4.24, which must sum to zero as in Eq. 4.26. 0=
kB Te ∇ne − ∇φ e ne
(4.26)
This can be rearranged and solved by separation of variables, using the reference condition ne = ne0 where φ = φ0 . ∇ne e = ∇φ ne kB Te
71 ne = e (φ − φ0 ) ln ne0 kB Te
Finally, the solution can be rearranged to the Boltzmann relation form in Eq. 4.27, which gives the electron density in terms of the plasma potential. �
e (φ − φ0 ) ne = ne0 exp kB Te
�
(4.27)
This fluid model is exactly consistent with the Boltzmann relation assumed in the analytic sheath models. The hybrid fluid PIC results from this model correspond closely to the analysis in the planar Bohm sheath model, so results from this model are expected to be in excellent agreement with the planar Bohm sheath. Comparison of results with the analytic sheath solution can be used to validate the overall operation of the hybrid model. The Boltzmann model is also useful for identifying and quantifying any two dimensional effects, since the only substantive difference from the planar Bohm sheath is the axisymmetric geometry. This is a useful baseline comparison to have before considering the more complicated detailed fluid models. 4.2.3
Non-neutral detailed model
The non-neutral detailed model is obtained by applying the charge continuity condition of Eq. 4.28. ∇ · je = 0
(4.28)
Inserting the expression for current from Eq. 4.24 into this form produces Eq. 4.29, which is a significantly more complicated expression of the charge continuity condition. � � � � �� kB ∇ne ∇· σ ∇Te + Te − ∇φ =0 e ne
(4.29)
72 Since the energy equation is solved for temperature, this equation can either be solved for plasma potential or for electron number density. In the work by Boyd and Yim, this was solved for the plasma potential [73], and the assumption of plasma neutrality was used in place of the electrostatic Poisson equation. Expanding Eq. 4.29 and rearranging to the form in Eq. 4.30 shows the character of the differential equation when solved for plasma potential. The coefficients on the potential terms are simple, but there is a complicated source term. 2
∇ φ+
�
∇σ σ
�
� � �� kB ∇ne · ∇φ − ∇ · σ ∇Te + Te =0 e ne
(4.30)
The assumption of neutrality is not valid in a plasma sheath, so the electrostatic Poisson equation is solved for electron density in Eq. 4.31 to complete the non-neutral detailed model. This calculation is not computationally reliable: the coefficient
ε0 e
is
very large, ∼ 5.5 × 10⁷ , but the calculated value of the Laplacian of the potential is very small. Put another way, there is very poor resolution of electron density from this calculation. ne = ni −
ε0 2 ∇φ e
(4.31)
This formulation is sensitive to statistical scatter in the ion density reported from the PIC model. Averaging techniques can be used to reduce the scatter, but it is more effective to maintain a large number of computational particles per cell. Additionally, any averaging introduces some lag into the coupling between electron density and potential. This raises the possibility of artificial oscillation in the plasma potential and electron density that could overwhelm the expected physical behavior. Since the Laplacian of electron density appears in Eq. 4.30 and the density itself is calculated from the Laplacian of plasma potential, the differential equation for potential begins to resemble a biharmonic equation. That is, taking the gradient or
73 Laplacian of number density introduces higher order derivatives into the differential equation for potential. The boundary conditions on potential must then be handled carefully to avoid introducing singularities in higher order derivatives. One approach is to calculate fourth order accurate boundary values, but this is difficult to enforce at points near the corners of the probe. An alternative approach is to use a stencil to calculate average values of ∇2 φ along boundaries. The original neutral detailed model has been used successfully, and there is reason to believe that relaxing the assumption of neutrality would result in a functional non-neutral model. However, as will be seen in the next chapter, the specific implementation of the non-neutral model in this work does not function as intended. The initialized conditions and order of calculations during iteration can only lead to a neutral solution with ∇2 φ = 0 throughout the flow field. 4.2.4
Poisson-consistent detailed model
The Poisson-consistent detailed model is also obtained by applying the charge continuity condition, and derives from the same intermediate result in Eq. 4.29. However, that equation is solved for electron number density in this model, rather than for plasma potential. The alternative arrangement in Eq. 4.32 shows the character of the differential e equation when solved for number density. The identity ne ∇ n1e = − ∇n has been ne
used to obtain a similar form in the ∇ne coefficient. 2
∇ ne +
�
∇ (σTe ) ∇ne − σTe ne
�
� � �� 1 e · ∇ne + ∇ · σ ∇Te − ∇φ ne = 0 σTe kB
(4.32)
This form is more complicated than the differential equation for potential. One particular issue is that the ∇ne coefficient is non-linear. There are no source terms in this arrangement, but that is not a significant advantage.
74 The perceived benefit of the Poisson-consistent model is that the electrostatic Poisson equation can be solved for plasma potential. This avoids the poor resolution issue in the non-neutral model, since the ion and electron densities are of the same order and contribute to a source term in the differential equation for plasma potential. This formulation also precludes the problems with statistical scatter and boundary conditions that hampered the non-neutral model. Differential equations are much more forgiving of localized statistical scatter than algebraic equations, since the integration procedure that leads to the solution acts to dissipate random variations. The PIC model ion density can be used directly in the electrostatic Poisson equation without any averaging, even with a relatively small number of particles per cell. Unlike the non-neutral model, the differential equation for number density does not indirectly include higher order derivatives. The electrostatic Poisson equation relates the Laplacian of plasma potential to the electron number density, so at worst the differential equation for number density has additional non-linearity in its coefficients. Standard second order accurate boundary conditions are sufficient for this model. The Poisson-consistent model is used for the first time in this work. Although the non-linearity in this model initially presented a significant obstacle, the problem was overcome by assuming constant coefficients during each solution of the differential equation. In the next chapter it will be shown that the Poisson-consistent detailed model accurately captures the features of the electrostatic sheath. 4.2.5
Summary of the electron fluid model equations
It is convenient to have the various equations for each fluid model organized in the side-by-side comparison of Table 4.1. The iteration procedure is also more readily
75 apparent in this form. Table 4.1: Summary of electron fluid model equations
4.3
Boltzmann
Non-neutral
Poisson-consistent
Continuity
Eq. 4.23−→ Ψ, ve
Eq. 4.23−→ Ψ, ve
Eq. 4.23−→ Ψ, ve
Current
Eq. 4.27−→ ne
Eq. 4.30−→ φ
Eq. 4.32−→ ne
Poisson
Eq. 4.21−→ φ
Eq. 4.31−→ ne
Eq. 4.21−→ φ
Temperature
Isothermal
Eq. 4.25−→ Te
Eq. 4.25−→ Te
Hybrid fluid PIC model iteration cycle
Since the PIC, DSMC, and fluid models have been decoupled over different time scales, the models can be solved iteratively. The cycle for an iteration weights particle density to the grid first, so that the electron fluid equations can be solved for the present ion particle distribution. All of the electron fluid equations are solved next, which involves a subcycle iteration for the coupled momentum and energy equations. The new potential field is used to update the electric fields. The ions are then accelerated according to the new electric fields, moved, collided, and sampled. The whole cycle is given here: 1. Weight particle density to the nodes of the grid 2. Solve electron continuity equation on grid nodes 3. Solve electron momentum equation on grid nodes 4. Solve electron energy equation on grid nodes 5. Repeat steps 3-4 to converge coupled equations 6. Weight electric fields from grid nodes to particles
76 7. Move particles in the grid cells 8. Collide PIC particles in grid cells 9. Sample particle properties on the grid
These steps do not necessarily have to be performed every time step, since the models are decoupled over different time scales. The cell spacing and the time step are determined in the next chapter based on the stability requirements for the electron fluid model. The ion particles do not move very far during a single time step, and require several iterations to cross a computational cell. In order to accelerate the overall convergence, the ions are moved several times between each solution of the electron fluid model equations.
4.4
Discretization and ADI solver
The fluid equations in the preceding sections are developed as continuous functions. In order to solve these equations on the nodes of a computational grid, the equations must be expressed using discrete operators. A finite difference form offers computational advantages and simplifications for the axisymmetric, structured, rectangular grid used in this work. 4.4.1
Finite difference operators
Consider the typical node in an axisymmetric computational grid. The central node has indices (i, j), and the adjacent nodes have indices of (i ± 1, j) and (i, j ± 1) as in Fig. 4.1. Values of the variables, including any spatial derivatives, are computed and stored at the nodes.
77
ri-1
rj+1/2
ri
zi-1/2
zi+1/2
rj-1/2
ri+1
z i-1
z i+1
zi
Figure 4.1: A typical computational node and its surroundings. In order to discretize the fluid equations, the gradient operator ∇ and the Laplacian operator ∇2 are needed. The gradient operator can be obtained in a second order accurate form by taking the Taylor expansion of an arbitrary quantity Q about the central node at (i, j). This results in the finite difference form in Eq. 4.33. Note that under the axisymmetric assumption there is no azimuthal variation, so the θˆ contributions to the operator are identically zero. The constant subscript has been omitted for clarity, so Qi+1, j is denoted as Qi+1 . ∇Q =
Qi+1 − Qi−1 Qj+1 − Qj−1 zˆ + rˆ xi+1 − xi−1 rj+1 − rj−1
(4.33)
As given in Eq. 4.34, the Laplacian operator can be related to the gradient operator by Green’s first identity. This identity states that the integral of ∇2 Q over a volume V is equal to the surface integral of ∇Q normal to the surface S that encloses the volume. ZZZ
V
2
∇ QdV =
I
S
∇Q · n ˆ dS
(4.34)
78 For the axisymmetric geometry, the volume associated with a node is an annular cylinder. The bounding surface consists of four surfaces: two annular surfaces in the rˆ − θˆ plane to the left and right of the node, and two cylindrical surfaces at constant radius above and below the node. As depicted in Fig. 4.1, these surfaces lie halfway between adjacent nodes. The desired finite difference form of ∇2 Q is a constant value stored at the node, so the volume integral reduces to the product on the left hand side of Eq. 4.35. Assuming that the finite difference form of ∇Q is also constant over each bounding surface, the surface integral can likewise be reduced to a summation over the four bounding surfaces. V ∇2 Q =
X A
∇Q · A
(4.35)
The right hand side can be expanded and simplified for the simple bounding surfaces, resulting in the compact form of Eq. 4.36. The areas and the partial finite difference differentials are defined in Table 4.2. Note that the surface coordinates require slight modification for nodes along boundaries. The relevant coordinate of the center node should be used when an adjacent node does not exist (along edges of the domain) or lies on a solid surface (along edges of the probe). ∇2 Q =
dQ AR dQ AL dQ Ao dQ Ai − + − 1 1 1 1 dx i+ 2 V dx i− 2 V dr j+ 2 V dr j− 2 V
(4.36)
79
Table 4.2: Areas and differentials in the � � finite difference Laplacian operator dQ i−1 2 2 Left annulus AL = π rj+ 1 − rj− 1 = Qxii −Q dx i− 12 −xi−1 2 2 � � −Qi dQ 2 2 Right annulus AR = π rj+ = Qxi+1 1 − r 1 dx i+ 12 j− 2 i+1 −xi 2� � Q −Qj−1 dQ = rjj −rj−1 Inner cylinder AI = 2πrj− 1 xi+ 1 − xi− 1 dr j− 21 2 2 2 � � Qj+1 −Qj dQ Outer cylinder AO = 2πrj+ 1 xi+ 1 − xi− 1 = rj+1 dr j+ 21 −rj 2 2 2 � �� � 2 2 Volume V = π rj+ 1 − rj− 1 xi+ 1 − xi− 1 2
Coordinates
2
2
2
xi− 1 = (xi−1 + xi )
xi+ 1 = 12 (xi + xi+1 )
rj− 1 = 12 (rj−1 + rj )
rj+ 1 = 12 (rj + rj+1)
2
1 2
2
2
2
After inserting the forms from Table 4.2 into Eq. 4.36 and simplifying, the finite difference form of the Laplacian operator can be written in the unwieldy form of Eq. 4.37. ∇2 Q =
Qi+1 − Qi Qi − Qi−1 �− � � � 1 1 1 1 (xi+1 − xi ) xi+ − xi− (xi − xi−1 ) xi+ − xi− 2
+
2
2
(4.37)
2
2rj+ 1 (Qj+1 − Qj ) 2rj− 1 (Qj − Qj−1 ) 2 2 � �− � � 2 2 2 2 (rj+1 − rj ) rj+ 1 − rj− 1 (rj − rj−1) rj+ 1 − rj− 1 2
2
2
2
This can be written in the compact form of Eq. 4.38 by using the coefficients defined in Table 4.3. ∇2 Q = CR Qi+1 + CL Qi−1 + CO Qj+1 + CI Qj−1 + CC Q Table 4.3: Finite difference Laplacian coefficients Left node
CL =
�1 � (xi −xi−1 ) xi+ 1 −xi− 1 2
Right node
CR =
2
�1 � (xi+1 −xi ) xi+ 1 −xi− 1 2
Inner radial node
CI =
2rj− 1 � 2 (rj −rj−1 ) r 2 1 −r 2 j+ 2
Outer radial node
CO =
Center node
j− 1 2
2rj+ 1 � 2 (rj+1 −rj ) r 2 1 −r 2 j+ 2
2
�
j− 1 2
�
Cc = − (CR + CL + CI + CO )
(4.38)
80 The finite difference operators for the gradient, Eq. 4.33, and the Laplacian, Eq. 4.38, can be used to formulate the discrete electron fluid equations on the axisymmetric computational grid. The next task is to obtain a solution to the differential equations. 4.4.2
Solution technique for differential equations
Each of the differential equations that appear in the electron fluid models can be rearranged to the form F (Q) = 0, where Q is the independent variable that is being solved, and F (Q) is the rearranged finite difference form of the differential equation. By analogy, the solution is the flow field value of Q that corresponds to a “root” of F (Q). This type of differential equation can be solved using a Newton-Raphson iteration scheme. The Newton-Raphson method treats the problem essentially as a root finding exercise in an arbitrary number of dimensions. The iterative equation in Eq. 4.39 resembles a Taylor expansion for the current value of the flow field variable Qt near the desired solution. The desired outcome from this calculation is an updated value of the flow field variable Qt+1 that satisfies F (Qt+1 ) = 0. � �−1 dF Qt+1 = Qt − F (Qt ) dQ t
(4.39)
Rearranging this to be more compatible with the linear form Ax = b yields the iteration rule in Eq. 4.40. The solution of this equation gives the quantity δQ = (Qt+1 − Qt ), which is a correction to the current flow field Qt . Many numerical techniques are available to solve linear equations in this form. dF (δQ) = −F (Qt ) dQ t
(4.40)
The greatest challenge in using Newton-Raphson iteration stems from determining the iterative differential
dF . dQ t
Provided that the operators in the differential
81 equation are linear, the differential and operator order can be interchanged and the iterative differential can be found easily. As a simple example, consider Eq. 4.23, the continuity equation that is solved in all three fluid models. The stream function is the independent variable, so Q = Ψ and F (Ψ) is simply the continuity equation, as in Eq. 4.41. Since the Laplacian operator is a linear operator, the order of the operations can be interchanged as in the intermediate relations of Eq. 4.42. This result can be then inserted into Eq. 4.40 as an operator on δΨ to obtain the iteration rule for the continuity equation in Eq. 4.43. Note that the subscript t is omitted except where required for clarity. F (Ψ) = ∇2 Ψ = 0 � dF d = ∇2 Ψ = ∇2 dΨ dΨ
�
d Ψ dΨ
(4.41) �
= ∇2
∇2 (δΨ) = −∇2 Ψt
(4.42) (4.43)
The temperature equation of Eq. 4.25 provides a second example. The number density, potential, and velocity are held constant during the iteration for temperature, so the source term and coefficients can be replaced by constants as in Eq. 4.44. Interchanging the order of operations leads to Eq. 4.45 for the iterative differential for temperature. The source term had no temperature dependence, and does not appear in the iterative differential. F (Te ) = ∇2 Te + c1 · ∇Te − c2 Te − c3 = 0
(4.44)
dF = ∇2 + c 1 · ∇ − c 2 dTe
(4.45)
The differential equation for plasma potential in the non-neutral detailed model, Eq. 4.30, can be handled in the same fashion. Number density, velocity, and temperature are constant during iteration for potential, leading to the constant coefficient
82 form in Eq. 4.46. That form readily produces the iterative differential in Eq. 4.47. F (φ) = ∇2 φ + c1 · ∇φ − c2 = 0
(4.46)
dF = ∇2 + c 1 · ∇ dφ
(4.47)
If the form of the differential equation is non-linear, it is more difficult to find the iterative differential. Consider the electrostatic Poisson equation for the Boltzmann model in Eq. 4.48, where the electron density has been expressed according to the Boltzmann relation with φ0 = 0 for simplicity. The first two terms can be handled as in the previous examples. The derivative must be taken of the exponential of the potential in the third term. This produces a differential iterator that has some dependence on the current value of φt . The differential iterator and the corresponding iteration rule are shown respectively in Eqs. 4.49 and 4.50. e e F (φ) = ∇ φ + ni − ne0 exp ε0 ε0 2
�
eφ kB Te
�
=0
� � dF e2 ne0 eφ 2 =∇ − exp dφ ε0 kB Te kB Te � � � � �� δφ eφt e eφt 2 2 ∇ δφ − 2 exp = ∇ φt + ni − ne0 exp λD kB Te ε0 kB Te
(4.48)
(4.49) (4.50)
The final equation is also the most difficult to evaluate. The differential equation for electron number density in the electrostatic Poisson equation has a non-linear coefficient on the ∇ne term. The other coefficients can be replaced with constants as in Eq. 4.51, since the velocity, temperature, and potential are held constant during the solution for number density. �
∇ne F (ne ) = ∇ ne + c1 − ne 2
�
· ∇ne + c2 ne = 0
(4.51)
83 The iterative differential is straightforward except for the non-linear term: d dne
� � ∇ne − · ∇ne ne
This expression can be evaluated in a number of different ways, but not every evaluation leads to a stable iteration rule. In fact the best computational performance is obtained by calculating the coefficient once, and then leaving it as a constant for the rest of the iteration. Under that assumption, the function and iterative differential are simple linear operators as seen in Eqs. 4.52 and 4.53. F (ne ) = ∇2 ne + c1 · ∇ne + c2 ne = 0
(4.52)
dF = ∇2 + c 1 · ∇ + c 2 dne
(4.53)
It should be noted that all of the results in this section are valid for both continuous and discrete operators. The finite difference operators from Sec. 4.4.1 can substituted into these expressions without any modification. 4.4.3
ADI solver
The iteration rules from the preceding discussion (such as Eq. 4.43 or Eq. 4.50) take the form of banded diagonal matrices when expressed using the finite difference operators of Sec. 4.4.1. Numerical techniques including the Alternating Direction Implicit (ADI) method [50, 74] have been developed to solve these types of linear equations. Banded diagonal matrices are significantly more difficult to solve than tridiagonal matrices. However, an approximate solution can be obtained by neglecting the terms in the bands and solving just the tridiagonal system. For the differential equations in the fluid models, this process is equivalent to solving the differential equations along
84 just one direction. A consistent solution can be obtained by solving the equations alternately for rows and columns. This work uses a standard implementation of the ADI method to solve the differential equations that appear in the electron fluid models. The solution technique is well known, and details can be found in most numerical and programming handbooks [75].
4.5
ADI accuracy and stability for the detailed models
The complicated differential equations that appear in the detailed models are not well understood, and have not been evaluated in terms of well-posedness or uniqueness. At the outset it is not certain that the ADI solver will be able to solve the equations and obtain a stable, physically meaningful solution. Inspection of the equations, particularly the forms in Eq. 4.46 and Eq. 4.52, reveals a strong similarity to one dimensional differential equations with analytic solutions. Therefore the difficult equations from the non-neutral and Poisson-consistent detailed models are solved analytically in one dimensional limits with constant coefficients. As a test of the ADI solver, the differential equations are also solved on a domain consisting of a single row. The ADI solver performance will be evaluated by comparing the accuracy of those solutions against the exact analytic solutions. Challenging conditions are tested to verify that the ADI solver can handle difficult solutions that include oscillations or unbounded behavior. 4.5.1
One dimensional non-neutral detailed model
The differential equation for potential from the non-neutral model, Eq. 4.46, can be rewritten in the form of Eq. 4.54. In this form the source term is represented by a
85 forcing function f , and the coefficient is denoted as α to distinguish it from constants of integration later. The analytic solution is more readily apparent if the equation is cast in terms of the electric field as in Eq. 4.55, using the usual electrostatic relation. ∇2 φ + α · ∇φ = f
(4.54)
∇E + α · E = −f
(4.55)
In the limit of one dimensional flow, this simplifies to the non-homogeneous constant coefficient differential equation of Eq. 4.56. Note that this equation is essentially an initial value problem with the x coordinate acting as the time variable. dEx + αEx = −f dx
(4.56)
The solution has the general form of Eq. 4.57, where the non-homogeneous solution is a constant value c2 . Assuming an “initial” condition Ex (0) = Ew and a “steady state” condition Ex (x −→ ∞) = E∞ allows the constants of integration to be determined. Ex = c1 exp (−αx) + c2
(4.57)
c1 = (Ew − E∞ ) , c2 = E∞ The potential can then be found by integrating the electric field as in Eq. 4.58, since Ex = − dφ in one dimension. dx φ (x) = −
Z
Ex dx = −
Z
(Ew − E∞ ) exp (−αx) + E∞ dx
(4.58)
The integration is straightforward and produces the form in Eq. 4.59. An initial condition on the potential is φ (0) = φw ,which allows the last constant of integration to be determined. φ (x) =
1 (Ew − E∞ ) exp (−αx) − E∞ x + c3 α
(4.59)
86
4 α=2 exact α=2 ADI α=1 exact α=1 ADI α=0.5 exact α=0.5 ADI
3.5 3
φ
2.5 2 1.5 1 0.5 0
0
5
10
15
x
Figure 4.2: ADI solutions of the 1D non-neutral model potential equation c3 = φ w −
1 (Ew − E∞ ) α
Inserting the constant and rearranging produces the final form of the solution in Eq. 4.60. φ (x) =
1 (Ew − E∞ ) [exp (−αx) − 1] − E∞ x + φw α
(4.60)
The magnitude of the coefficient α determines the overall nature of the solution. The two limiting cases are a predominantly linear solution when α ≫ (Ew − E∞ ), or a predominantly exponential solution when α ≪ 1. For intermediate values of α, the solution will appear exponential at small values of x but level off and appear linear at large values of x. The ADI results are compared with exact solutions in Fig. 4.2 for the conditions Ew = −2, E∞ = −0.02, and φw = 0 over a range of α values. The effect of the α coefficient on the solution is clearly visible. The ADI solver reproduces the exact solutions to within machine precision in every case.
87 4.5.2
One dimensional Poisson-consistent model
The differential equation for number density from the Poisson-consistent model, Eq. 4.32, can be rewritten with constant coefficients α and β as Eq. 4.61. ∇2 ne + α · ∇ne + βne = 0
(4.61)
In the limit of one dimensional flow, this simplifies to the homogeneous constant coefficient differential equation of Eq. 4.62. Note that this equation has exactly the same form as a damped harmonic oscillator problem with the x coordinate acting as the time variable. d2 ne dne + α + βne = 0 dx2 dx
(4.62)
This has an analytic solution [76] that can be underdamped (ζ < 1), critically damped (ζ = 1), or overdamped (ζ > 1), depending on the relative magnitudes of the coefficients α and β. � p � �� p 2 2 e0 2 ne0 + θud sin ω 1 − ζ x + arctan nθud 0