Sep 14, 2010 - If the plane ax+ by+ cz = d contains the singular point of the .... respectively. ..... Let q be the projection of p to the plane containing the circle. ...... which is parallel to the ξ3 axis, is the intersection of the planes π1 and π2, which ...
Computational Structural Bioinformatics II: Molecular Models Chandrajit Bajaj September 14, 2010
2
Contents 1
Introduction
2
Spatial Occupancy 2.1 Surface Representations . . . . . . . . . . . . . . . . . . . . . . . . 2.2 Molecular Surface using Voronoi-Cell Complexes . . . . . . . . . . 2.2.1 Atom Boundary Patch as a Trimmed NURBS . . . . . . . . 2.2.2 Solvent Accessible Surface . . . . . . . . . . . . . . . . . . 2.2.3 Rolling Ball Surface . . . . . . . . . . . . . . . . . . . . . 2.2.4 Solvent contact surface . . . . . . . . . . . . . . . . . . . . 2.3 Molecular Surface Computation using Adaptive Grids . . . . . . . . 2.3.1 Signed Distance Function based Family of Surfaces . . . . . 2.3.2 Algorithm . . . . . . . . . . . . . . . . . . . . . . . . . . . 2.3.3 Operations Supported by the Adaptive Grid . . . . . . . . . 2.3.4 Sum of Gaussians (SoG) based approximation . . . . . . . 2.3.5 Results . . . . . . . . . . . . . . . . . . . . . . . . . . . . 2.4 Dynamic Update of Molecular Surface Under Change in Radii . . . 2.4.1 Preliminaries . . . . . . . . . . . . . . . . . . . . . . . . . 2.4.2 Maintaining the Molecular Surface Under Quadratic Growth 2.4.3 Maintaining the Molecular Surface under Linear Growth . . 2.4.4 Examples . . . . . . . . . . . . . . . . . . . . . . . . . . . 2.5 Maintaining Union of Balls Under Atom Movements . . . . . . . . 2.5.1 Preliminaries . . . . . . . . . . . . . . . . . . . . . . . . . 2.5.2 Description (Layout) of the Packing Grid Data Structure . . 2.5.3 Queries and Updates . . . . . . . . . . . . . . . . . . . . . 2.5.4 Molecular Surface Maintenace Using DPG . . . . . . . . . 2.6 Clustering and Decimation of Molecular Surfaces . . . . . . . . . . 2.6.1 Preliminary- Mixed Cell Complex . . . . . . . . . . . . . . 2.6.2 Decimation of Molecular Shapes . . . . . . . . . . . . . . . 2.6.3 Multiresolution Hierarchy . . . . . . . . . . . . . . . . . . 2.6.4 Error Estimates . . . . . . . . . . . . . . . . . . . . . . . . 2.6.5 Analysis . . . . . . . . . . . . . . . . . . . . . . . . . . . 2.6.6 Examples . . . . . . . . . . . . . . . . . . . . . . . . . . . Related Work . . . . . . . . . . . . . . . . . . . . . . . . . . . . . . . . Relevant Mathematics . . . . . . . . . . . . . . . . . . . . . . . . . . . .
A Molecules A.1 Internal Coordinates . . . . . . . . . . . . . . . . . A.2 LEG (Labelled Embedded Graph) Representations A.3 FCC (Flexible Chain Complex) Representations . . A.3.1 Hierarchical Representation . . . . . . . . A.3.2 Flexibility representation . . . . . . . . . .
5
. . . . . 3
. . . . .
. . . . .
. . . . .
. . . . .
. . . . .
. . . . .
. . . . .
. . . . .
. . . . . . . . . . . . . . . . . . . . . . . . . . . . . . .
. . . . . . . . . . . . . . . . . . . . . . . . . . . . . . .
. . . . . . . . . . . . . . . . . . . . . . . . . . . . . . .
. . . . . . . . . . . . . . . . . . . . . . . . . . . . . . .
. . . . . . . . . . . . . . . . . . . . . . . . . . . . . . .
. . . . . . . . . . . . . . . . . . . . . . . . . . . . . . .
. . . . . . . . . . . . . . . . . . . . . . . . . . . . . . .
. . . . . . . . . . . . . . . . . . . . . . . . . . . . . . .
. . . . . . . . . . . . . . . . . . . . . . . . . . . . . . .
. . . . . . . . . . . . . . . . . . . . . . . . . . . . . . .
. . . . . . . . . . . . . . . . . . . . . . . . . . . . . . .
. . . . . . . . . . . . . . . . . . . . . . . . . . . . . . .
. . . . . . . . . . . . . . . . . . . . . . . . . . . . . . .
. . . . . . . . . . . . . . . . . . . . . . . . . . . . . . .
. . . . . . . . . . . . . . . . . . . . . . . . . . . . . . .
. . . . . . . . . . . . . . . . . . . . . . . . . . . . . . .
. . . . . . . . . . . . . . . . . . . . . . . . . . . . . . .
. . . . . . . . . . . . . . . . . . . . . . . . . . . . . . .
. . . . . . . . . . . . . . . . . . . . . . . . . . . . . . .
. . . . . . . . . . . . . . . . . . . . . . . . . . . . . . .
. . . . . . . . . . . . . . . . . . . . . . . . . . . . . . .
. . . . . . . . . . . . . . . . . . . . . . . . . . . . . . .
. . . . . . . . . . . . . . . . . . . . . . . . . . . . . . .
7 8 8 8 10 11 14 17 17 18 21 21 22 23 25 29 30 33 39 40 41 43 45 46 46 47 50 51 53 53 54 56
. . . . .
. . . . .
. . . . .
. . . . .
. . . . .
. . . . .
. . . . .
. . . . .
. . . . .
. . . . .
. . . . .
. . . . .
. . . . .
. . . . .
. . . . .
. . . . .
. . . . .
. . . . .
. . . . .
. . . . .
. . . . .
. . . . .
. . . . .
65 65 67 68 73 73
CONTENTS
4 A.3.3 Denavit-Hartenberg scheme . . . . . . . . . . . . . . . . . . A.3.4 Flexibility analysis in molecules - creation of flexible models . A.4 Flexibility in RNA . . . . . . . . . . . . . . . . . . . . . . . . . . . A.4.1 Reduced conformation space . . . . . . . . . . . . . . . . . . A.4.2 Classification of RNA using clustering . . . . . . . . . . . . . A.4.3 Division of RNA backbone by suites . . . . . . . . . . . . . .
. . . . . .
. . . . . .
. . . . . .
. . . . . .
. . . . . .
. . . . . .
. . . . . .
. . . . . .
. . . . . .
. . . . . .
. . . . . .
. . . . . .
. . . . . .
. . . . . .
. . . . . .
. . . . . .
. . . . . .
. . . . . .
. . . . . .
. . . . . .
. . . . . .
. . . . . .
74 74 76 76 78 80
Chapter 1
Introduction intro to computational algorithms and data structures for modeling of molecular models and macromolecular complexes from PDB Molecular Solvation Models and Minimal Surfaces Molecular surfaces of proteins and other biomolecules, are often modeled as smooth analytic interfaces separating the molecule from solvent (an implicit solvation model). These analytic solvation models are often of high genus with a myriad of interconnected tunnels and pockets with openings (mouths). All these interfaces are biochemically significant as pockets are often active sites for ligand binding or enzymatic reactions, and tunnels are often solvent ion conductance zones. In this talk, we present a general characterization of these solvation interfaces and approximately model them as piecewise minimal surfaces, namely, the solution of non-linear elliptic or biharmonic partial differential Euler-Lagrange equations obtained from the minimization of high-order energy functionals. Index to content of chapters: chap 2 Spatial Occupancy : Union of Balls (Weighted Points)– Voronoi-Dell Complexes (C0 ) Dynamic Neighborhood Data Structures — Packing Grid, Octrees Hydrophobic chap 3 Smooth Interfaces : Moleculat-solvent Dielectric interfaces Analytic volumetric models (Radial Basis Splines, Ci n f ) Mixed-Voronoi-Del complexes (C1 ) A-patch complexes (mostly 1 C ); Algebraic Shell Splines (C1 ) Variational B-spline Surfaces (C2 ) Molecular-molecular interfaces Clustering/Multi-resolution chap 4 Complementary Space Features: Mouths, Tunnels, Pockets, Voids chap 5 Shape Properties: Areas, Volumes, Normals, Curvatures chap 6 Energetics: Hamiltonians, Lagrangians Partial Charge Assignment Lennard Jones Potential (vanderWaal) Columbic Dispersion Generalized Born Poisson Boltzmann chap 7 Forces: Area, Volume Derivatives Energetic derivatives chap 8 Docking: Affinitiy Functions 5
CHAPTER 1. INTRODUCTION
6 Search & Scoring Filters Re-Ranking chap 9 Molecular Machines: viruses ribosomes chap 10 conclusion Appendix App1: X-ray structure determination App2: Proteins, Nucleic Acids App3: PDB, MMCIF
Chapter 2
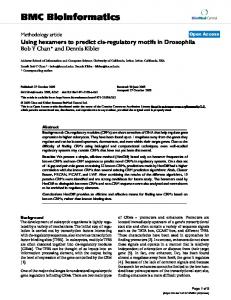
Spatial Occupancy Molecules are commonly modeled as a collection of atoms represented by spheres, with radii equal to their van der Waals radii. Three types of surfaces are defined based on this representation. Probe sphere VDW Surface
VDW Volume Reentrant patch of SCS
SAS
Overlapping regions of SCS and VDW Surfaces SAS Volume
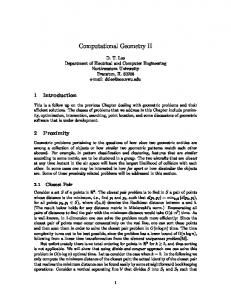
Figure 2.1: Different molecular surfaces and regions are shown for a 3 atom model in 2D. The SAS is the locus of the center of the rolling probe sphere. The VDW surface is the exposed union of spheres representing atoms with their van der Waals radii and contains the VDW volume. The lower side of the rolling probe defines the smooth SES which contains parts of the VDW surface and reentrant patches. The region between the SAS and the SES is defined as the SAS volume, and the region between the SAS and the VDW volume is refered to as the SES volume. van der Waals (VDW) surface. The surface of the set of spheres is known as the van der Waals surface. Solvent Accessible Surface (SAS). Proteins do not exist in isolation, but commonly found in solutions, especially water. The Solvent Accessible Surface (SAS) is defined as the locus of the center of a solvent proble (e.g., a water molecule) rolling along the VDW surface of a molecule [57]. If water molecules are modeled as spheres with radias 1.4 Å, then the SAS of a given molecule can be found by increasing the radius of each atom in that molecule by 1.4 Å, and taking the surface of the set of inflated atoms. Solvent Contact Surface (SCS). The VDW surface contains too many internal atoms and patches which are not accessible by the solvent, and the SAS contains regions that should be occupied by the solvent. Thus both these surfaces contribute to large errors in biomolecular energy computation. In order to overcome this drawback, Richards [66] gave a definition for molecular surface as a set of contact and reentrant patches. A probe solvent sphere, rolling over the atoms of a protein defines a region in which none of its points pass through. The boundary of this volume is continuous and defines a new molecular surface. This surface is composed of convex patches where the probe touches the atom surfaces, concave spherical patches when the probe touches more than 2 atoms simultaneously and toroidal patches when the probe rolls between two atoms. This surface is commonly known as the Solvent Contact Surface (SCS), or Solvent Excluded Surface (SES), or Lee-Richards (LR) Surface, or simply the Molecular Surface. The major drawback of SCS is that cusps created by the self-intersection of the rolling probe, cause singularity during energy computation. 7
CHAPTER 2. SPATIAL OCCUPANCY
8
Figure 2.2: 3D image showing the decomposition of SCS into three different kinds of patches: convex spherical, toroidal and concave spherical. Figure 2 shows the surfaces described above for a 3 atom example as a 2D cross section, and Figure 2 shows the different types of re-entrant patches on an SCS. See Appendix A for further details about structure of biomolecules like proteins and RNA. In Section 2.1 we introduce different ways to model the VDW, SAS and SCS surfaces of molecules. Sections 2.2 and 2.3 describe two different algorithms to produce such representations. Section 2.4 and 2.5 presents techniques to maintain the surfaces under dynamic change of radii and atom movements. And Section 2.6 discuss multiresolution models of molecules.
2.1 Surface Representations 2.2 Molecular Surface using Voronoi-Cell Complexes 2.2.1 Atom Boundary Patch as a Trimmed NURBS The representation we use for molecule (property) surfaces is a boundary representation. Two classes of information are used: (a) geometric description of each patch, (b) topological relations amongst the patches. We maintain the following data structures related to the molecule. 1. The weighted Voronoi diagram [4, 53] (power diagram) D of the molecule atom centers (the weights are the squares of the atoms radii). 2. A regular triangulation T (dual of the power diagram) of the same set of weighted points as in [37]. 3. A NURBS patch per molecule atom. We have selected NURBS as basic modeling primitive [55]. For an appropriate choice of parameterization we obtain a single trimmed NURBS for each atom’s external surface contribution. Each such patch is the intersection of one sphere (representing one atom) with the exterior of all its neighboring spheres. Consider the intersection S ∩ R of a spherical surface S = {x : kx − x0 k = r0 } with the external of sphere R = {x : kx − x1 k ≥ r1 }. There always exists an halfspace π = {x : (x · l) ≤ d} such that: S ∩ R = S ∩ π.
For each atom we can reduce our patch representation problem to the intersection of a sphere with a set of halfspaces. The union of balls model [35] provides the equation of each halfspace intersecting one atom1 . Note that, since we use a parametric 1 Given the Voronoi complex of the weighted centers of the molecule atoms, the halfspaces whose common intersection generates the Voronoi cell of the atom B are those with which S = ∂ B must be intersected.
2.2. MOLECULAR SURFACE USING VORONOI-CELL COMPLEXES
9
representation S = f (u, v), we need to compute the domain D in (u, v) space such that f (D) = S ∩ π . To have an efficient representation we want to obtain only one NURBS patch per atom. Moreover, since we will use this formulation to achieve a representation of the surface parametric in the radii of the atoms we need a formulation that maps continuous modifications of the radii into continuous modifications of the domain D. This is not achieved with the classical NURBS sphere representation as a rotational surface of a half circle [65] since there are two points (north and south pole) of the sphere that are the image of two lines in the parameter domain (say u = 0, u = 1 if the interval of the u domain is [0, 1]). This implies that when the boundary plane of π crosses one of the poles the corresponding trimming curve in the (u, v) domain would have a discontinuous change in shape. Without loss of generality we assume that S is the unitary sphere. The parameterization we adopt is the following (see [13]): x
=
2u u 2 + v2 + 1
2v u 2 + v2 + 1 u 2 + v2 − 1 z = u 2 + v2 + 1 This parameterization maps the (infinite) rectangular domain y
=
(2.1)
[−∞, +∞] × [−∞, +∞] to the unitary sphere. Note that in practice we do not deal with an infinite domain since we do not represent an entire sphere but only one spherical patch. In particular assume that we are considering the intersection S∗ of the unit sphere S with the halfspace z ≤ d (with a rigid body transformation and a scaling we can always reduce the first intersection to this case). We determine a positive constant l such that S∗ ⊂ f (I), where I is the square domain [−l, +l] × [−l, +l]. Inq the parameter domain
this corresponds to the condition D ⊂ I. The minimum value of l that satisfies such condition is l = 1+d 1−d . Regarding the numerical stability of the method it is important to note that for d = 0.999 we get l = 44.710 . . .. Even when d is much larger than a realistic value, we still deal with a small domain region. The next step is to determine the domain D. At this end we simply replace the parametric equations (2.1) of the of the sphere to the variables in the Cartesian inequality of π obtaining the Cartesian inequality defining D. u 2 + v2 − 1 ≤ d ⇒ u 2 + v2 ≤ l 2 (2.2) u 2 + v2 + 1 Thus the domain D is a disc with center in the origin and radius l. Note that a variation of d corresponds to a scaling of D, that can be performed by simply scaling its control polygon (once a NURBS representation is defined for the trimming curve of D). For any additional cutting halfspace π¯ : ax + by + cz ≤ d we have: (c − d)u2 + (c − d)v2 + 2au + 2bv − (c + d) ≤ 0
(2.3)
2au + 2bv − (c + d) = 0.
(2.4)
If the plane ax + by + cz = d contains the singular point of the parameterization P = (0, 0, 1) then c = d. In this case the trimming curve is the straight line:
The domain D must be intersected with the half-plane 2au + 2bv − (c + d) ≤ 0. If c − d 6= 0 the trimming curve derived from (2.3) has Cartesian equation: (u +
b 2 a 2 + b 2 + c2 − d 2 a 2 ) + (v + ) = c−d c−d (c − d)2
(2.5)
In general we note that all the trimming curves are circles (possibly with infinite radius) so that the region D can be modeled as progressive intersection/difference of a sequence of circles. Corresponding to the cutting halfspace π¯ of normalized equation √ 1−d 2
b a , c−d ) and radius c−d . The region ax + by + cz ≤ d, with a2 + b2 + c2 =1, we have in parameter space a circle C of center ( c−d defined by such circle (inside/outside) depends on the sign of the term c − d. For c − d < 0 P = (0, 0, 1) is inside π¯ and hence the points of the plane at infinity are included in the region corresponding to π¯ . That is π¯ is mapped onto the outside of C. This requires C to be parameterized with a clockwise orientation. Symmetrically c + d < 0 implies that π¯ corresponds to the region inside C and hence C must be parameterized with a counterclockwise orientation.
CHAPTER 2. SPATIAL OCCUPANCY
10
2.2.2 Solvent Accessible Surface In this section we discuss the representation of the solvent accessible surface of a molecule. Since we are representing the molecule with a union of balls B, in the following, with some abuse of terminology, we will call B both the molecule or the union of balls. Similarly each single ball B will be called either a ball or an atom. Assume we have a ball B of radius r (a solvent atom) free to move in space without intersecting the union of balls B (a ◦
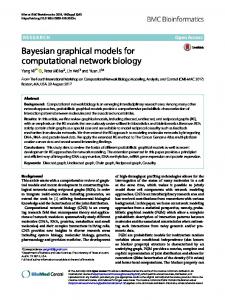
molecule). We say that B is in a legal position if its interior B does not intersect B. Definition 2.2.1. The solvent accessible surface Sa of the union of balls B relative to a solvent atom B of radius r, is the locus (envelope) of the centers of the spheres with radius r tangent to B.
(a)
(b)
Figure 2.3: The HIV-2 PROTEASE (a) and one solvent accessible surface (b) for the same molecule. From [35, 36] we know that Sa is the boundary surface of the union of balls B ′ that has the same set of atoms as B but with all the radii increased by r (see figure 2.3). On the basis of this property we can achieve a representation of Sa parametric in r. For r = 0 we obtain the van der Waals surface of the molecule ∂ B. Varying the value of r we get the accessible surfaces of different solvents. Let V ′ ∈ V ′ be the convex cell corresponding to the ball B′ ∈ B ′ . V ′ is the intersection of a set of k halfspace π1 ∩ . . . ∩ πk . The the contribution of B to the boundary of B (the surface Sa for r = 0) is given by ∂ B ∩ π1 ∩ . . . ∩ πk . Now assume r > 0 and consider the sphere B′ in B ′ corresponding to B in B. The contribution of B′ to Sa is computed by intersecting ∂ B′ with the same set of halfspaces π1′ , . . . , πk′ ′ . To compute the trimming curves in the parameter space (u, v) of the NURBS patch representing ∂ B′ ∩ π1′ ∩ . . . ∩ πk′ ′ we apply a mapping that transforms B′ into the unitary ball Bu . Under this mapping the variation of r corresponds to have a fixed (unitary) radius ball Bu intersected with a set of varying halfspaces. Formally, if the ball B′ and one halfspace π ′ have equations: B′ :
π′ : we apply the coordinate transformation x =
Rx′ , y =
x2 + y2 + z2 ≤ R2
ax + by + cz + d ≤ 0
Ry′ , z = Rz′ to map B′ to Bu :
x′2 + y′2 + z′2 ≤ 1 d π′ : ax′ + by′ + cz′ + ≤ 0 R The change of the radius R of B′ to R+ r is hence mapped in normalized coordinates (x′ , y′ , z′ ) to the change of the parameter d d ′ R of the halfspace π to R+r . This means that the equation of the trimming circles can be rewritten, including the parameter r, as: Bu :
(u +
d 2 a2 + b2 + c2 − ( R+r ) b a 2 2 ) + (v + ) = d d d 2 c − R+r c − R+r (c − R+r )
(2.6)
2.2. MOLECULAR SURFACE USING VORONOI-CELL COMPLEXES 11 √ (R+r)2 −d 2 that is a circle of center ( d a , d b ) and radius r = |(R+r)c−d| . To maintain the description of the domain D we have R+r −c
R+r −c
to maintain a 2D dynamic union of balls that is equivalent to maintain a weighted Voronoi diagram of moving points in the plane [43, 6]. Note also that the coefficient d of the plane equation is also function of r. In fact as the radius of each ball is increased by r the Voronoi plane that separates two balls moves toward the smaller one. An example is shown in figure 2.4. The distances l1 , l2 of the Voronoi plane π from the centers of the two balls must be such that the power distances of π are equal, that is: l12 − r12 = l22 − r22 Moreover the sum of two distances is constant (the two balls grow but do not move): l1 + l2 = l From these two equations we get for l1 so: l12 − r12 = (l − l1 )2 − r22
⇒
l1 =
l 2 + r12 − r22 2l
When r1 changes to r1 + r and r2 changes to r2 + r we have: r1 − r2 r 2l r2 − r1 l2′ = l2 + r 2l
l1′ = l1 +
Figure 2.4: As the radius of the two balls is increased by 1 the Voronoi plane that separate them moves towards the smaller ball.
2.2.3 Rolling Ball Surface In this section we extend the method to achieve an exact NURBS representation of the rolling ball surface Sr of a molecule B. The goal is to achieve an intermediate stage toward to construction the solvent contact surface Sc defined in the next section.
CHAPTER 2. SPATIAL OCCUPANCY
12
In Figure 2.5 is shown the Fullerene molecule along with two solvent contact surfaces corresponding to two different solvent radii. We assume to have a ball B of radius r (the solvent molecule) which is free to roll along the union of balls B (the molecule). The union of all the balls B (moving tangentially to B in all the possible directions) is a region whose outer envelope strictly contains (if r > 0) B and whose inner envelope is tangent to B (see [9]).
(a)
(b)
(c)
Figure 2.5: The Fullerene molecule (a) and two solvent contact surfaces (b),(c) corresponding to two different solvent radii. Definition 2.2.2. The rolling ball surface Sr of the molecule B with respect to a ball B of radius r is the inner envelope of the region described by B rolling on B in all possible directions. The close relationship between the solvent accessible surface and the rolling ball surface is evident from this definition. Proposition 2.2.1. (Necessary Condition) If a point p lies on the rolling ball surface Sr then it lies also on the boundary of a ball B with center on the solvent accessible surface Sa . ◦
P ROOF. By Definition 2.2.2 when p ∈ Sr there exists a ball B of radius r such that p ∈ ∂ B, B ∩ B 6= 0/ and B ∩B = 0. / But if the center q of B does not belong to Sa either B ∩ B = 0/ or
◦
B ∩B 6= 0/ ⊓ ⊔ Using the regular triangulation T ′ associated with B ′ we can define the set of patches composing Sr . First, recall the relationship between ∂ T ′ and ∂ B ′ : • each vertex v of ∂ T ′ corresponds to a spherical patch of ∂ B ′ ;
• each edge e of ∂ T ′ corresponds to the intersection line between two adjacent spherical patches of ∂ B ′ ;
• each triangle t of ∂ T ′ corresponds to the intersection point between three adjacent spherical patches of ∂ B ′ .
We base the construction of the rolling ball surface on these properties. Using Connolly’s terminology [27] (as we will later see that the solvent contact surface is a subset of the rolling ball surface) we have (a) each vertex v of ∂ T ′ corresponding to a “convex” spherical patch in Sr , (b) each edge e of ∂ T ′ corresponding to a “saddle” toroidal patch in Sr , and (c) each triangle t of ∂ T ′ corresponding to a “concave” spherical patch in Sr . The definitions of these three kinds of patches are reported in the following three sections. “Convex” Spherical Patches Consider the spherical patch v¯ with radius r + r1 of ∂ B ′ associated with the vertex v (see figure 2.6). It represents a moving solvent ball that maintains contact with ∂ B at a point p. The surface described by the point
2.2. MOLECULAR SURFACE USING VORONOI-CELL COMPLEXES
13
p is in turn a spherical patch of radius r (part of ∂ B). It can be computed from the power diagram of ∂ B. Call B the ball (of radius r1 ) of B with center v. It contributes the patch ∂ B ∩ π1 ∩ . . . ∩ πk (that is the Voronoi cell of v is π1 ∩ . . . ∩ πk ) to ∂ B . The ball B contributes the patch ∂ B ∩ π¯1 ∩ . . . ∩ π¯k to Sc , where π¯i is parallel to πi but nearer to v. Without loss of generality we assume v to be the origin (0, 0, 0) and π1 to be orthogonal to the x axis (with a rigid body transformation we can always achieve this situation). The halfspace π1 is x ≤ d and the halfspace π¯1 is x ≤ d¯ where: d¯ = .
dr1 (r + r1 )
We can so determine any halfspace π¯i corresponding to πi and hence ∂ B ∩ π¯1 ∩ . . . ∩ π¯k .
Figure 2.6: A solvent atom of radius r that rolls on the molecule surface B maintaining its center on the solvent accessible surface B ′ . Its point of contact with B belongs to the solvent contact surface Sc . “Saddle” toroidal patches A similar argument holds for saddle toroidal patches. With reference to figure 2.7 we consider the edge e of ∂ T ′ with extreme vertices v1 and v2 . The edge e corresponds on ∂ B ′ to a (portion of) circle e¯ of intersection between two adjacent balls ∂ B1 ∩ ∂ B2 . Thus, it is possible to roll a solvent ball, moving its center along the arc e. ¯ If the edge e is not a facet of any triangle of ∂ T ′ then e¯ is an entire circle. The ball that rolls maintaining its center on e¯ describes a torus E. We are interested in just a portion of ∂ E. Consider the plane π of the Voronoi diagram on which e lies. Applying the procedure specified in the previous section we compute two planes π1 and π2 by translating π towards v1 and v2 , respectively. The intersection of ∂ E with the region within π1 and π2 generates two toroidal patches. The one nearest to the torus axis v1 v2 is the toroidal patch E ∗ that belongs to Sr .
Figure 2.7: (Left) A solvent atom B of radius r that rolls on the molecule surface B maintaining its center on the solvent accessible surface B ′ and two points of contact with two molecule atoms. The portion of circle of ∂ B that belongs to the triangle with the three vertices v1 ,v2 center of B, belongs to the rolling ball surface Sr . (Middle) The toroidal NURBS patches of the rolling ball surface Sr of the caffeine molecule. (Right) The toroidal NURBS patches of Sr shown together with the union of balls. If the edge e is the arc from point t¯1 to point t¯2 then the toroidal patch associated with e is the portion of the patch E ∗ intersected with two more halfspaces. Call π (v1 , v2 , v3 ; v4 ) the halfspace that contains v1 , v2 , v3 in its boundary and v4 in its
CHAPTER 2. SPATIAL OCCUPANCY
14
interior (with v1 , v2 , v3 , v4 affinely independent). The toroidal patch corresponding to e is (see figure 2.7): E ∗ ∩ π (v1 , v2 , t¯1 ; t¯2 ) ∩ π (v1 , v2 , t¯2 ; t¯1 ). “concave” spherical patches
Figure 2.8: A solvent atom of radius r tangent to the molecule surface B maintaining its center on the solvent accessible surface B ′ and three points of contact with three molecule atoms. The portion of ∂ B inside the tetrahedron with vertices v1 ,v2 ,v2 , center of B, belongs to the rolling ball surface Sc . Finally, consider the triangle t of ∂ T ′ with vertices v1 , v2 , and v3 . It corresponds to the point t¯ in ∂ B ′ . In this case we have a solvent atom B with no degrees of freedom (it cannot roll since its center is fixed in t¯). The contribution of B to Sc is thus given by: ∂ B ∩ π (v1 , v2 ,t; v3 ) ∩ π (v1 , v3 ,t; v2 ) ∩ π (v2 , v3 ,t; v1 ).
Figure 2.9: Complete Connolly surface of a caffeine molecule. Figure 2.9 depicts a complete solvent contact surface (a superset of the rolling ball surface) of the caffeine molecule with the concave patches highlighted in purple.
2.2.4 Solvent contact surface In this section we extend the method to achieve an exact NURBS representation of the solvent contact surface Sc (also known as the Connolly surface) of a molecule B. The surface is defined as follows. Definition 2.2.3. A point p belongs to the solvent contact surface Sc of the molecule B with respect to a solvent with atoms of radius r iff:
2.2. MOLECULAR SURFACE USING VORONOI-CELL COMPLEXES
15
• there exists a legal ball B1 of radius r that contains p in its boundary: ◦
∃B1 | p ∈ ∂ B1 and B1 ∩B = 0/ • there is no legal ball B2 of radius r that contains p in its interior: ◦
B2 ∩B = 0/
⇒
◦
p 6∈B2
(2.7)
(2.8)
The close relationship between the solvent contact surface and the rolling ball surface becomes clear from this definition. Proposition 2.2.2. If a point p lies on the solvent accessible surface Sc then it lies also on the rolling ball surface Sr . P ROOF. The proof can immediately be derived from the comparison of definition 2.2.2 with definition 2.2.3. Further, from this follows that lemma 2.2.1 holds not only for Sr , but also for Sc . ⊓ ⊔ The problem that remains to be solved is the removal of (possible) self intersections that the rolling ball surface might have, and that make it differ from the solvent contact surface (for a classification of the classes of self-intersection that may occur see [9], fig1). This problem can be geometrically highlighted even with a set of two small balls along which a large radius probe is rolled (see figure 2.10). In this case the blending surface is formed by a toroidal patch that is self-intersecting.
(a)
(b)
Figure 2.10: (a) The rolling ball surface (in green) with a probe of radius 10 on two spheres (in red) of radius 1 is a self intersecting surface. (b) The corresponding solvent contact surface has no self intersection. To show the same problem for the concave patches at least three spheres are needed. Figure 2.11 shows three possible configurations of the solvent contact surface for a set of three balls. From the picture it is clear how complex the shape can get (with sharp features, varying in genus and possibly disconnected) even for a simple configuration of three balls. In the following sections we will show how the patches of the rolling ball surface can be trimmed to get the exact representation of the solvent contact surface. As for the previous case we will report a brief sketch of the proof of correctness. Convex Patches The convex patches of the solvent contact surface are exactly the same of the rolling ball surface. This derives immediately from the following: Proposition 2.2.3. The solvent contact surface Sc of the molecule B is completely included within the region between ∂ B and ∂ B ′ , where ∂ B ′ is the corresponding solvent accessible surface. Since Sc does not intersect the interior of B there is no nee to further trim the convex patches since they belong to ∂ B. Toroidal Patches First of all, we exclude the possibilities of two toroidal patches intersecting each other and of a toroidal patch intersecting with a concave/convex patch. Proposition 2.2.4. Given two toroidal patches Ti ,T j (with i 6= j) their relative interiors are disjoint: ◦
◦
T i ∩ T j = 0/ Proposition 2.2.5. Given a toroidal patch Ti and a concave (convex) patch C j , their relative interiors are disjoint: ◦
◦
T i ∩ C j = 0/
CHAPTER 2. SPATIAL OCCUPANCY
16
(a)
(b)
(c)
Figure 2.11: Three possible configurations of the solvent contact surfaces and rolling ball surfaces for different radii of the solvent and molecule atoms. On the left the self-intersecting rolling ball surfaces are shown. On the right the corresponding solvent contact surfaces are shown (without self-intersections).
2.3. MOLECULAR SURFACE COMPUTATION USING ADAPTIVE GRIDS
17
From the two previous lemmas we derive that one toroidal patch can intersect only itself. This happens when it can be constructed as rotational surface of an arc of circle around an axes that intersect the arc (see figure 2.12). For each arc a rotating around an axis l intersecting a we must remove that portion of a lying on the “wrong” side of l. In this way we compute the arc a′ (a disconnected subset of a) whose rotational surface around l has no self intersection as in figure 2.10.
(a)
(b)
Figure 2.12: (a) The arc a rotating around the axes l describes a self intersection portion of torus. (b) The arc a′ rotating around the axes l describes portion of torus with no self intersection. Trimming the Concave Patches First of all, we exclude the possibility of a concave patch intersecting either itself or a convex patch (we already know that it cannot intersect a toroidal patch). Proposition 2.2.6. Given a concave patch Ci and a convex patch C j , their relative interiors are disjoint: ◦
◦
Ci ∩ C j = 0/ Proposition 2.2.7. One concave patch cannot intersect itself. As show in Figure 2.11 two distinct concave patches can intersect each other. Since each concave patch is a portion of sphere we have to deal again with a sphere-sphere intersection problem. Hence we can simply maintain the regular triangulation of the centers of the concave patches (in this case all the weights are equal) so that we have all the relation of reciprocal intersection between concave patches. It has been shown in section 2.2.1 that the intersection between each pair of spheres is mapped to the insertion of an additional trimming circle in the domain space. Taking into account the intersections between pairs of concave patches, we must add some trimming circles to the domains of each concave patch to obtain the result of Figure 2.11.
2.3 Molecular Surface Computation using Adaptive Grids An algorithm to compute the molecules SES and other related properties is presented, which provides an accurate surface definition and efficient representation for operations required during docking.
2.3.1 Signed Distance Function based Family of Surfaces We define a volume function Φ and use its contours to provide a family of molecular surfaces. Consider the union of atoms of the molecule ∪B. Inflate each atom b in this set by the probe radius (solvent radius) r p to give the new complex ∪Br p . Let its boundary be ΓB . Let Φ define the signed distance function of ΓB, such that the interior (closer to van der Waals) is given a positive sign. Let all regions within the atom (see [84] for definitions) be given a constant positive high value H. Observations and lemmas: • Isosurfaces SI with isovalues I : 0 ≤ I ≤ H form a family of surfaces.
• ΓB = S0 , as defined by Lee and Richards, is the SAS of the molecule. • Sr p is the SES. • Sx→H − is the van der Waals surface.
CHAPTER 2. SPATIAL OCCUPANCY
18
• {x : 0 ≤ Φ(x) ≤ H} defines a volume exclusion function, which can be convenient to use in electrostatic computations. • The region {x : −r p ≤ Φ(x) ≤ r p } has a high probability for the presence of surface atoms of a protein docked to the current one. The above observations point to the obvious advantages in using such a definition for our molecular structure representation for docking. Let us further examine some of them in detail. ΓB = S0 is the SAS, and Sr p is the SES: By definition of the SAS, it is the locus of the center of the probe as it rolls over the spherical atoms of the protein. But it should be noted that the grid based definition also includes holes, which may be removed if necessary. The SES surface is always defined by points on the probe. It is in fact the boundary of the region accessible to any part of the probe radius. Hence, it is always at a constant distance of r p away from the locus of the center. Therefore, our third observation follows. Again, holes are included in our definition and need to be removed if required. {x : 0 ≤ Φ(x) ≤ H} provides a volume exclusion function: Volume exclusion functions are used in setting up dielectric constant for electrostatic computations. The twin requirements of smoothness at the boundary and accuracy in modeling the SES are not met by many of the definitions in practise today. Our definition is provides a ‘sufficiently’ smooth function around the SES (Φ is smooth in the radial direction), and contains the SES within it. Isosurfaces SI with isovalues I : 0 ≤ I ≤ H form a family of surfaces At the extremes isovalues, we have the SAS and the VDW surfaces, and the SES lies in between them at an isovalue of r p . Interface of docked ligand is in the region {x : −r p ≤ Φ(x) ≤ r p } : For good shape complementarity, as observed in docked complexes, atoms of the ligand must lie close to the surface of the protein. The above ‘skin’ definition provides a functional representation for such a region, as it defines the region where a probe sphere is in touch with the protein.
2.3.2 Algorithm Let us consider a grid G in which the molecule is embedded to have a maximum and minimum grid spacing, hmax , hmin . Let the dimension with the lower resolution be N 3 . Initially, the grid is uniformly divided using hmax as the grid spacing. Then: • Top down subdivision: 1. Insert each atom bi , i = 1..M into G, subdividing if necessary. 2. With each insertion, update locally, points p ∈ G as belonging to VSAS ,VV DW . 3. Compute the boundaries SV DW , SSAS .
• Bottom up collapse 1. New points created by the previous steps in the grid, and buried in atoms interiors are collapsed to make the grid sparser in a bottom up fashion. • For each point p around a point classified as SV DW , search in a local region with extent r p for a SSAS boundary cell. Find the closest distance of the point from the SSAS boundary. Details on each step is given below. 1. Vertex classification Each atom is inserted into the grid. If we start with a single node in the adaptive mesh, subdivision is performed as we insert each atom in an adaptive manner. With the insertion of each atom, the vertices around the center of the atom are classified as belonging to inside the VSAS or the VV DW . Vertices classified as VV DW are fixed while vertices marked VSAS could be updated with the insertion of new atoms. We use the method described by [3] for sphere-cube intersection tests. The cost of this insertion is linear in the number of atoms and cubic in the resolution of the grid: O(Mh3max ). 2. Boundary cell detection We examine the classification of the eight corners of each cell of the grid. If some vertices belong to the inside of a volume and others to the outside, we mark the cell as a boundary cell. This operation is linear in the number of cells of the grid O((N − 1)3). Each boundary cell is given an index.
2.3. MOLECULAR SURFACE COMPUTATION USING ADAPTIVE GRIDS
19
3. Adaptive subdivision of SSAS Each boundary cell which contains more than three atoms contributing to it is subdivided up to a user defined resolution. The index of each atom intersecting a cell is kept in a linked list associated with that cell. Using that list, we classify each subdivided vertex as belonging to the interior of the VSAS or not. Using a technique similar to obtain boundary cells, we generate a list of finer boundary cells in the subdivided cells. The maximum cost of this operation is O((N − 1)3 (hmax /hmin )3 ), although the average case cost should be much smaller as only the boundary cells are involved. 4. SSES computation The cells around each vertex in VSAS and SV DW is searched for the SSAS . If there is a cell with only one intersecting atom, we find the exact distance from the vertex to the spherical patch of SSAS in that cell and stored at the vertex. If a closer distance it is found, the stored distance is updated. If we are searching a cell which contained more than one atom, and hence subdivided, we just take the minimum distance from the center of all the subdivided cell to the vertex in question as the distance of the spherical patch in the cell to the vertex. The cost of this search will vary as r3p , the number of boundary van der Waals cells in the volume and the accuracy desired (as provided by hmin ). Spherical Patch Intersection Let us define a sphere as having a center c = {cx , cy , cz } and radius r. Define a cube with points a1 , .., a8 Equation of arc of intersection of sphere and face of cube The intersection is always an arc of a circle. We will obtain the center, radius of the circle and the intersection points. We will consider only a face parallel to the xy plane. Other cases should follow similarly. The point of projection of c to the plane containing the face p is p = {cx , cy , z coordinate of face}. This point is the center of the circular arc. The radius using Pythagoras theorem is r2 − dist(p, c)2 . The intersection points on the edges, if any is now the intersection of this circle with the line containing the edge, and checking whether the points lie within the edge. Shortest distance of point to a circular arc Let the point be p, the center, radius of the arc be p1 , r and the two end points of the arc be p2 and p3 . Lemma The shortest distance of a point q in a plane to a circular arc in the plane is: • Point is outside the infinite sector defined by the arc. The shortest distance is : |r − dist(q, p1 )|. • Otherwise, the shortest distance = min(dist(q, p2 ), dist(q, p3 )). Let q be the projection of p to the plane containing the circle. Let p d1 be the dist(p, q) and d2 be the shortest distance of the arc from q. Thus, the shortest distance from p to the circular arc is (d1 )2 + (d2 )2 . Shortest distance of point to a spherical patch Here the spherical patch is in a cube, bounded by circular arcs. Consider the circle a boundary arc is part of. The center of the sphere and this circle will form an infinite cone. Hence the collection of boundary arcs form a collection of infinite cones. Lemma The shortest distance of a point p to a spherical patch in a cube is: • Point is inside each of the infinite cones. The shortest distance is : |r − dist(p, c)|. • Otherwise, the shortest distance is the minimum of the shortest distances of the point to each of the bounding arcs. Complexity For M atoms (including B boundary atoms), smallest grid spacing h, grid length N, VDW radius r and solvent radius r p , the timing complexity is • SDF initialization: O(N 3 ) • Insertion of atoms: O(M(
2(r+r p ) 3 ) ) h
• Boundary atom detection:
CHAPTER 2. SPATIAL OCCUPANCY
20 – Uniform grid traversal: O(N 3 ) – Sphere traversal: O(M(
2(r+r p ) 3 ) ) h
– Octree traversal: O(log(N 3 )B) ≤ O(log(N 3 )M) • Patch voxel distance computation: O(M(
2(r+r p ) 6 ) C), C h
is cost(dist(patch, voxel))
• Isocontouring for visualization: O(N 3 ) Self Intersections in Patch Complex Model A patch complex (consisting of convex, concave and toroidal patches) can be derived using our adaptive grid structure and SAS sphere intersection enumeration. But the patch complex is known to have problems of bad intersections. According to lemma 3, 4, 5, 6 and 7 from Bajaj et al [15], there are only two possible self intersections that occur in the commonly used rolling ball model: • A toroid can self intersect with itself (Figure 10(a) in [15]). • A concave patch can intersect with another in the case of a 3 atom model (Figure 9 in [15]). In figure 2.13, we show the surface computed when two atoms are present, and moved close till they form a single surface patch. In the case of surfaces computed from the rolling ball model, we would instead get a self intersecting toroidal patch when the gap between the atoms becomes smaller than the diameter of the probe radius. This can be computed by looking at all pairs of intersecting SAS spheres, which is already given in our adaptive grids. To examine the intersection of two concave patches, we look at the three atoms model as shown in figure 2.14. Again, we get similar results compared to [15]. This case occurs when there are three intersecting SAS atoms, and can be enumerated by our grid.
(a) The toroidal patch is disjoint and there is no self intersection.
(b) As the atoms come closer, a well defined toroidal patch is created.
Figure 2.13: The solvent excluded surfaces of two atoms which come closer.
(a) The 2 concave patches are disjoint and there is no wrong intersection.
(b) As the atoms come closer, a well defined patch, similar to the approximations in [15] is created.
(c) At mutually closer distances, the topology changes and the center hole disappears.
Figure 2.14: The solvent excluded surfaces of three atoms which come closer.
2.3. MOLECULAR SURFACE COMPUTATION USING ADAPTIVE GRIDS
21
2.3.3 Operations Supported by the Adaptive Grid 1. Surface atoms detection Surface atoms are defined as those within a certain distance from the Molecular Surface. To obtain these atoms, we first compute the Molecular Surface. Next we search locally around each atom to find the distance of the atom from the surface. This operation is linear in the number of atoms and cubic in the resolution of the grid. 2. Population of skin region We define the skin region of one molecule as the region belonging to the probe as it rolls on the surface, and defined as Solvent Accessible Surface 2 Volume (VSAS2 ). We define the skin implicitly as a set of spheres packing the region. The packing density is itself chosen to approximately equal the packing of the atoms belonging to the molecular surface. The region is defined over a trilinear grid in which the molecule is embedded. The grid spacing h is chosen to preserve the features of the molecule. Assuming that the interatomic distance is ∼ 1, we can use h = 0.5. By finding the boundary vertices of the SAS, we can obtain potential centers for the skin spheres. A packing algorithm decides, based on the packing density required, if a potential center should contain an atom or not. 3. Area volume computations We use primal contouring to define the surface and volumes. The area under the surface is approximated by piecewise linear elements of the isocontour. The volume is approximated by the volume enclosed by that piecewise linear approximation. This cost is linear in the size of the grid. 4. Curvature and normal computations These differential properties are computed using a two step process. Initially, when we propagate the distance from the SSAS , we also store whether the nearest patch is the intersection of one, two or more spheres. In each case, we can analytically provide the answer to the curvatures. For example, for a sphere with radius r, the Mean and Gaussian curvatures are −1/r and 1/r2 respectively. In the second step, we compute the derivatives from the isocontour. At points where the two vary significantly, we choose to keep the value provided by the differencing scheme as the signed-distance algorithm used is only an approximation.
2.3.4 Sum of Gaussians (SoG) based approximation The adaptive grid is also used to compute a sum of Gaussians approximation to the Molecular Surface. A base uniform grid is used to compute the Fourier coefficients of the atom centers and the kernel function using a non-equispaced fast Fourier Transform. The summation is evaluated at points around the surface chosen from the adaptive grid. For details of this algorithm, kindly refer to the technical report [14]. The cost of the algorithm, for M atoms, N output points, n Fourier coefficients and a accuracy requirement ε is: Lemma For tensor product kernels with Fourier coefficients Kω , the number of coefficients n needed is at most: n = min(n) ˆ : ∑ (Kω )2 ≥ ω ∈Inˆ
V 2π
−
Mmin j (|c j |2 )V ε 2 (3) , (||c||1 )2
where V is the integral of the kernel from (−0.5..0.5]3.
Lemma For tensor product kernels whose Fourier coefficients decay at least inversely with frequency, the number of coefficients n needed is O(M 1/3 ε 3/2 ). 2
Lemma The fourier coefficients of a Gaussian function e−Bx decay as the inverse of the frequency ω : q √ 3 B ,4 eπ 3/2
−(1+π 2 /B)
2 Be Gω ≤ max( 2π1√π , 21π er f ( √πB ), ) ω1 , (ω ≥ 2). The truncation of the Gaussian can be expressed as πe , π4 convolution with a sync function in Fourier space. Hence the Fourier series coefficients of the truncated Gaussian function can R∞ p π −π 2t 2 /B sin(2πω )/(2πω − t)dt. We then bound the sync function with a polynomial and integrate by be now written as Be −∞
parts to obtain the result.
22
CHAPTER 2. SPATIAL OCCUPANCY
2.3.5 Results Region classification and construction of molecular surfaces Before we provide timing, geometric and functional properties and skin, surface regions, we present the results of our classification and signed distance function on a 3 atom model in figure 2.15. Using a relatively high resolution grid of 1283 , we classify grid points depending on the volume and surface it is part of, giving priorities of surface class over volumes and SES class over other surfaces. The figure is a 2D cross section of a volume rendering of the classified volume.
Figure 2.15: A 2D cross section of the adaptive grid classification on a 3atom model showing different surfaces and regions. SSAS : dark blue, VSAS : pink, SSES : red, VSES : light blue, SV DW : yellow and VV DW : green. The Solvent Excluded Surface The solvent excluded surface is obtained as an isocontour with value equal to probe radius. In figure 2.16, we show colored visualizations of four different molecules. Family of surfaces In figure 2.17, we show four different surfaces computed from the adaptive grid, at four different isovalues. The myoglobin molecule, 101m.pdb, is used as a test case. At a distance of 0, we get the SAS surface, which is the union of spheres model, with each atom represented as a sphere with radius equal to the sum of its radius and a probe radius. In this example, we used a probe radius of 1.4Å. As we go further away, we get a smooth deformation of the SAS surface to the SES surface, as shown in the different figures. Since we are interested in the SES, we do not compute further in practise, but in theory, higher isovalues will take us closer to the van der Waals surface. This example shows the utility of our method as a volume exclusion function for computing electrostatics, which needs a smooth decay at the SES boundary. Timing The cost of the algorithm depends on the depth of the adaptive grid, the resolution of the initial base grid and the size of the molecule. In table 2.1, we provide the time taken to compute the properties on the grid, including surfaces and demarking volumetric regions for different molecules and grid sizes. As the number of atoms increase, the time taken increases, but the fixed output grid size reduces the number of relevant search points within the SAS and VDW regions. Hence there is no direct correlation seen between the two. If the grid resolution can be chosen depending on the molecule size, then the time would increase monotonically with the number of atoms for molecules with similar distribution of atoms (say for a set of globular proteins). Surface atoms detection The surface atoms of three proteins from the complexes, anti-idiotypic fab (1iai.pdb), hemagglutinin (2vir.pdb) and bobwhite quail lysosyme (1bql.pdb) are visualized in figure 2.18. The interior atoms are colored by the residue they belong to while the outer surface atoms all have an orange color. We show a cutoff of the three molecules to reveal the surface and interior.
2.4. DYNAMIC UPDATE OF MOLECULAR SURFACE UNDER CHANGE IN RADII
(a) An acetylcholine esterase (1C2B.PDB). It is shown in its tetramer form. Each unit, containing 4172 atoms each, is colored with a different color.
(c) The large ribosomal subunit (1JJ2.PDB) has almost 100,000 atoms. The main RNA chain (in brown) and other chains are shown.
23
(b) The nicotinic acetylcholine receptor with over 14,000 atoms (2BG9.PDB). It has 5 chains, shown in different colors.
(d) The tobacco mosaic virus, a helical virus (1EI7.PDB). The repeating subunits, each containing 2806 atoms, are shown.
Figure 2.16: The solvent excluded surfaces of four different molecules. SAS2 skin region construction From the same above three complexes (1iai,2vir and 1bql), we extract the second protein and compute the skin regions (see figure 2.19) defined by the volume where the probe is present and touching the molecule. This region is used later in docking as it represents a volume where the interface atoms from the docking protein have a high probability of being present.
2.4 Dynamic Update of Molecular Surface Under Change in Radii We analyze the complexity of two main classes of updates that yield a family of all the molecular surfaces obtained for different solvent radii: (1) updates that keep the Power Diagram fixed (quadratic growing of the radius of the solvent ball); (2) updates that modify the Power Diagram (linear growing of the radius of the solvent ball). In both cases efficiency is achieved trough the introduction of a novel geometric construction. In case (1) we use a new constructive approach to duality that generalizes the standard “lifting” scheme [35], showing that the Power Diagram of a molecule (3D union of balls) constitutes a compact representation of the collection of all the Power Diagrams of the trimming
CHAPTER 2. SPATIAL OCCUPANCY
24
(a) Isovalue=0 yields the SAS
(b) Intermediate surface at isovalue 0.8
(c) Intermediate surface at isovalue 1.1
(d) At isovalue 1.4 (probe radius), we obtain the SES.
Figure 2.17: Our signed distance function based definition yields a family of surfaces which we can extract using a novel adaptive grid based algorithm.
circles of all the patches in a molecular surface. In particular the convex cell of the 3D Power Diagram relative to the ball B is the dual of the 2D Power Diagram of the trimming circles of B. As a first approximation (with the bonus of being simpler and more efficient) we consider the molecular surfaces obtained by disproportionally increasing the solvent radius so that the associated Power Diagram remains unchanged. We show how we can keep track of the topological changes that occur in the trimming curves of the patches that form the molecular surface so that its boundary representation can be updated efficiently. Furthermore, we compute and dynamically update an exact boundary representation of the molecular surface so that the same dynamic data structure is also suitable for molecular modeling operations such as those supporting synthetic drug design [55]. In the case (2) setting, where the 3D Power Diagram is subject to flips, we use the same construction as in [41] based on the definition of a 4D complex of convex polytopes C whose “horizontal” slices are all the possible 3D Power Diagrams of the growing balls for any growth factor r. Hence we apply a simple hyperplane sweep algorithm to optimally maintain the dynamic Power Diagram of the linearly growing balls. Thus in this case we compute exactly the offset of the union of balls (so that its topology can be precisely determined), even when it requires a change in the nearest neighbor (under power distance)
2.4. DYNAMIC UPDATE OF MOLECULAR SURFACE UNDER CHANGE IN RADII PDB Id
Number of atoms
time (643 )
time (1283)
3sgb 1brc 2ptc 2kai 3tpi 1tab 1ppf 4cpa 1mkw
1912 2197 2243 2267 2313 2387 2520 2739 4844
11 6 6 7 6 9 7 10 8
85 58 53 74 54 72 63 85 60
25
Table 2.1: Times (in seconds) taken to compute the adaptive grid based surfaces and volume regions for different initial grids which are adaptively subdivided to a depth of 3.
(a) Hemagglutinin
(b) Anti-Idiotypic Fab
(c) Bob-white quail lysosyme
Figure 2.18: Surface atoms of three complexes shown in orange over the interior atoms which are colored by their residue type. relations among the atoms corresponding to flips in the associated Regular Triangulation. More generally, for a set of balls in d-dimensional space this requires the construction of a complex of convex polytopes in (d + 1)-dimensional space whose “horizontal” slices are all the possible Power Diagrams. In Section 2.4.1 we introduce the fundamental equations that form the basis of the presented approach for molecular modeling. For a more extensive discussion of the conditions under which the present approach can be extended to a more general case unifying geometries other than spheres, the interested reader is referred to [18]. While for our purposes we deal with d = 3, the results are easily extended to arbitrary dimension. See Section 2.2.1 for a discussion on trimmed NURBS representation of Molecular surfaces. And the Relavant Math Section for details about power diagrams.
2.4.1 Preliminaries Balls in ℜ3 and Halfspaces in ℜ4 In this section we introduce the fundamental equations that form the basis of the presented approach for molecular modeling. For a more extensive discussion of the conditions under which the present approach can be extended to a more general case
CHAPTER 2. SPATIAL OCCUPANCY
26
(a) Immunoglobulin from influenza virus
(b) Idiotypic fab of virus neutralizing antibody
(c) Hylel 5 Fab
Figure 2.19: Surface atoms of three complexes shown in orange over the interior atoms which are colored by their residue type. unifying geometries other than spheres, the interested reader is referred to [18]. While for our purposes we deal with d = 3, the results are easily extended to arbitrary dimension. Consider in ℜ4 the implicit equation of the unit ball:
ξ12 + ξ22 + ξ32 + ξ42 − 1 ≤ 0 .
(4.9)
Its boundary has parametric equations which are:
ξi =
2xi x21 + x22 + x23 + 1
, i = 1, 2, 3
ξ4 =
x21 + x22 + x23 − 1 . x21 + x22 + x23 + 1
(4.10)
The boundary of the ball (4.9) is the closure of the image of ℜ3 in ℜ4 under the mapping (4.10). The inverse map of (4.10) is given by ξi xi = , i = 1, 2, 3 (4.11) 1 − ξ4
for (ξ1 , ξ2 , ξ3 , ξ4 ) on the unit sphere ξ12 + ξ22 + ξ32 + ξ42 = 1. The point (0, 0, 0, 1) in ℜ4 is the image of the point at infinity of ℜ3 . Now consider the linear halfspace: h:
a 0 + a 1 ξ1 + a 2 ξ2 + a 3 ξ3 + a 4 ξ4 ≤ 0 ,
(4.12)
where not all of {a1 , a2 , a3 , a4 } are zero. Its pre-image in ℜ3 , given by the mapping (4.10), is b:
a0 (x21 + x22 + x23 + 1) + a1 2x1 + a2 2x2 + a3 2x3 + a4 (x21 + x22 + x23 − 1) ≤ 0 .
(4.13)
If a21 +a22 +a23 +a24 −a20 ≥ 0 and a0 +a4 > 0, this is the ball of center −(a1 , a2 , a3 )/(a0 +a4 ) and radius (a21 + a22 + a23 + a24 − a20 )1/2 /(a0 + a4 ). If a21 + a22 + a23 + a24 − a20 ≥ 0 and a0 + a4 < 0, this is the union of the sphere of center −(a1 , a2 , a3 )/(a0 + a4 ) and radius (a20 − a21 − a22 − a23 − a24 )/(−a0 − a4) and its exterior. When a0 + a4 = 0, this is a halfspace, and when a21 + a22 + a23 + a24 − a20 < 0 and a0 + a4 6= 0, this is a ball of imaginary radius, and contains no real points. A fundamental relationship is that spheres that contain a point (c1 , c2 , c3 ) in ℜ3 map to hyperplanes that pass through the point (2c1 , 2c2 , 2c3 , c21 + c22 + c23 − 1)/(c21 + c22 + c23 + 1) in ℜ4 . This is a result of the relation (c21 + c22 + c23 + 1)a0 + 2(c1a1 + c2 a2 + c3 a3 ) + (c21 + c22 + c23 − 1)a4 = 0 . A consequence of this relationship is that a set of spheres passing through two distinct points in ℜ3 correspond to a set of hyperplanes in ℜ4 that contain a certain line. Since the actual points of intersection in ℜ3 are mapped to points on B, the line in ℜ4 must intersect B in two points. A set of spheres in ℜ3 which intersect at one point are mapped to into hyperplanes
2.4. DYNAMIC UPDATE OF MOLECULAR SURFACE UNDER CHANGE IN RADII
27
whose line of intersection is tangent to B. A set of spheres whose combined intersection is empty are mapped to hyperplanes whose line of intersection, if any, does not intersect B. This situation is illustrated for d = 2 in Figure 2.20. Let l be the line of intersection of the boundaries ∂ h′ ∩ ∂ h′′ corresponding to two distinct intersecting balls b′ and b′′ . We have that ∂ b′ intersects ∂ b′′ if and only if l intersects B, that is, if the distance from l to the origin O is smaller than 1:
∂ b′ ∩ ∂ b′′ = 1 or 2 points dim (b′ ∩ b′′ ) = 0
⇐⇒
⇐⇒
l ∩ B 6= 0/
l ∩ B = 1 point
⇐⇒ ⇐⇒
dist(l, O) ≤ 1 . dist(l, O) = 1 .
Figure 2.20: The intersection between the boundaries of two disks b′ , b′′ in ℜ2 corresponds to a line l intersecting the sphere B. Similarly we can consider three distinct disks b′ , b′′ , and b′′′ . If their intersection is a region bounded by three circular arcs, one from each disk, then the three boundary circles correspond to three planes ∂ h′ , ∂ h′′ , and ∂ h′′′ that intersect in a point p contained in B. This is illustrated in Figure 2.21. If the three circular boundaries intersect in one or two points, then the planes
Figure 2.21: The non-empty intersection, when bounded by three circular arcs, between three disks b′ , b′′ , and b′′′ in ℜ2 , corresponds to a point p contained in the ball B. intersect in a point on ∂ B (or possibly in a line that intersects B). b′ ∩ b′′ ∩ b′′′ = region bounded by 3 arcs (or points) dim (∂ b′ ∩ ∂ b′′ ∩ ∂ b′′′ ) = 0
⇐⇒
⇐⇒
p ∈ ∂B .
p∈B
(4.14) (4.15)
CHAPTER 2. SPATIAL OCCUPANCY
28
Proof of equation (4.14). Let the three circles be (x − xi )2 + (y − yi )2 = ri2 , i = 1, 2, 3. Then the three corresponding planes are (1 + x2i + y2i − 2 ri ) − 2xi ξ1 − 2yi ξ2 + (1 − x2i − y2i + ri2 )ξ3 = 0. Their point of intersection, if unique and finite, is given by (ξ1 , ξ2 , ξ3 ) = (D1 /D4 , D2 /D4 , D3 /D4 ), where −1 − x2 − y2 + r2 1 1 1 D1 = −1 − x22 − y22 + r22 −1 − x2 − y2 + r2 3 3 3
−2x1 D3 = −2x2 −2x3
−2x1 D2 = −2x2 −2x3
−2y1 −2y2 −2y3
−2y1 −2y2 −2y3
1 − x21 − y21 + r12 1 − x22 − y22 + r22 1 − x23 − y23 + r32
−1 − x21 − y21 + r12 −1 − x22 − y22 + r22 −1 − x23 − y23 + r32
1 − x21 − y21 + r12 1 − x22 − y22 + r22 1 − x23 − y23 + r32
−1 − x21 − y21 + r12 −1 − x22 − y22 + r22 −1 − x23 − y23 + r32
−2x1 , D4 = −2x2 −2x3
−2y1 −2y2 −2y3
,
,
1 − x21 − y21 + r12 1 − x22 − y22 + r22 1 − x23 − y23 + r32
The condition that this point of intersection lies in the interior of B is
D21 + D22 + D23 − D24 < 0 .
. (4.16)
If D4 = 0, then the point of intersection is at infinity, and the inequality (4.16) cannot be satisfied. (If D1 = D2 = D3 = D4 = 0, then the three planes have a line in common which intersects B, and it can be shown that the centers of the three circles are collinear and the circles intersect in two points.) The intersection of three disks is bounded by three circular arcs exactly when each disk contains exactly one of the two points of intersection of the other two circles. In order for the first two circles to intersect in two points, we need that the distance between their centers is strictly between |r1 − r + 2| and r1 + r2 . This can be expressed algebraically as A1 = [(x1 − x2)2 + (y1 − y2 )2 − (r1 − r2 )2 ][(x1 − x2)2 + (y1 − y2 )2 − (r1 + r2 )2 ] < 0 .
(4.17)
Next, we need that r3 is between the distance from (x3 , y3 ) to the two points of intersection of the first two circles. This condition turns out to be expressible as x1 x2 x3 2 y1 y2 y3 A 1 + A 2 2 1 1 1 From these two equations we obtain for l1 : l12 − r12 = (l − l1 )2 − r22 = l 2 + l12 − 2l1 l − r22 l1 =
l 2 + r12 − r22 2l
2.4. DYNAMIC UPDATE OF MOLECULAR SURFACE UNDER CHANGE IN RADII
31
Figure 2.23: The difference between a quadratic and a linear growth of the molecule for a given probe radius. The molecular surface (top) is grown quadratically (middle left), hence maintaining the topology of the set of patches, giving an approximation to the real molecular surface computed by linear growth (middle right). The topology differences can be seen in the weighted zero alpha shapes (bottom) from a different view point.
Figure 2.24: Examples of several topological changes in the set of NURBS patches, while growing the probe radius linearly.
CHAPTER 2. SPATIAL OCCUPANCY
32 When r1 changes to r1 + r and r2 changes to r2 + r we have: l1
= = =
l 2 + (r1 + r)2 − (r2 + r)2 2l l 2 + r12 + r2 + 2r1 r − r22 − r2 − 2r2 r 2l l 2 + r12 − r22 + 2r(r1 − r2 ) 2l
In general, consider two balls B1 , B2 (of radii r1 and r2 respectively) in ℜd and assume, without loss of generality, a coordinate system with the origin in the center of B1 and the center of B2 on the positive part of the x1 axis (the center of B2 is the point (l, 0, . . . , 0)). The hyperplane of the Power Diagram that separates B1 from B2 has the equation:
π:
x1 =
l 2 + r12 − r22 2(r1 − r2 ) +r 2l 2l
(4.19)
which is linear in r. Hence this is also a hyperplane in the (d + 1)-dimensional space (x1 , . . . , xd , r). Figure 2.25 shows the 1-dimensional case of two balls (segments) that grow quadratically (a) or linearly (b). In the first case the hyperplane of the Power Diagram that separates B1 from B2 remains the same for all values of r. In the second case, the hyperplane of the Power Diagram that separates B1 from B2 moves linearly with r with a slope towards the center of B1 .
Figure 2.25: The 1-dimensional case of ball growth. The quadratic growth (a) keeps the Power Diagram hyperplane (a point) still. The linear growth (b) moves the Power Diagram hyperplane linearly with r. This fundamental observation leads to the construction of the Power Diagram of a set of growing balls as the intersection of a hyperplane r = const with a complex C of convex polytopes in the (d + 1)-dimensional space (x1 , . . . , xd , r). If the molecule B is composed of n balls {B1 , . . . , Bn } then the complex C is a collection of n convex polytopes {C1 , . . . ,Cn } one per ball. In particular the cell Ci associated with the ball Bi is the intersection of all the halfspaces of points “nearer” to Bi then to B j (with j = 1, . . . , i − 1, i + 1, . . . , n). The boundary hyperplane of such halfspaces is given by equation (4.19). Note that cell Ci is defined as the intersection of all possible n + 1 halfspaces since by linear growing many flips can occur in the Regular Triangulation. A flip occurs when an edge connecting two opposite vertices of a quadrilateral comprising two triangles in the triangulation is replaced by the edge connecting the other two vertices, as illustrated in Figure 2.26. The brute force application of the technique as described here requires the computation of n convex hulls [22] in four-dimensional space, which leads to an O(n3 ) time worst case complexity. For our purposes this is just a preprocessing step needed to construct the data structure used for animating the molecular surface, so we do not report in the present paper the details of an efficient computation of this complex C . Note however, that in the case of a molecule in three dimensions (d = 3) we have to compute a set of 4-dimensional convex hulls that can be computed more efficiently, in an output sensitive sense, by using the algorithm given in [21]. The use of this algorithm would indeed be beneficial because the overall number of faces in C is indeed O(n2 ). This is proved by a technique introduced in [18] that generalizes the “lifting” scheme for the computation of Power Diagrams [33] and maps the construction of the complex C to a convex hull computation (intersection of halfspaces) in one dimension higher (that is in dimension d + 2). In the case of a molecule in three dimensions, this leads to the computation of the convex hull in dimension
2.4. DYNAMIC UPDATE OF MOLECULAR SURFACE UNDER CHANGE IN RADII
33
five that can be computed optimally [22] in O(n2 ) time. This is certainly optimal in odd dimension (and in particular in the case of molecules where d = 3) since a single Power Diagram (and C contains many of them) already has the same number of faces as a (d + 1)-dimensional convex polytope. In the previous section we introduced the construction of a complex of convex polytopes C embedded in the (d + 1)dimensional space (x1 , . . . , xd , r) whose “horizontal” slices (that is an intersection with the hyperplane r = const) are the Power Diagrams of the balls B with radii uniformly increased by r. This data structure allows us to animate (update) efficiently the representation of a molecular surface (solvent accessible or solvent contact) with respect to a change in the solvent radius. In particular we can achieve simple and efficient updates on the Power diagram localized in regions where the topological changes actually occur. In this way we can then in turn directly apply the method described in Section 2.4.2. Being that the Power Diagram is the intersection of a horizontal hyperplane H : r = const with the complex C , in the dynamic setting the linear growth of the radii is simply a sweep of such horizontal hyperplanes H along the r-axis. Hence the “event points” at which we have to update the topological structure of the Power Diagram are the vertices of C . In particular to compute these hyperplane sections of C we apply the robust approach in [17] which is based on the robust “above or “below” classification of the vertices of C with respect to H. We sort the vertices of C by their r coordinates so that their classification is obtained in logarithmic time by locating the current height value of H in such a sorted list of vertices. This approach is also suitable for the dynamic growth setting in which we will be continuously moving the hyperplane H. In fact in such a scenario, each time we cross a vertex of C , we will need to update only the cells incident to this vertex. Moreover in general, if we suddenly change our solvent radius from a value r1 to a value r2 , we will be able to detect the vertices whose r coordinate is in the range [r1 , r2 ], change their above/below classification and consequently update all the incident faces of H ∩ C . We reach the conclusion that when spheres grow linearly, some flips can occur in the Regular Triangulation, unlike the quadratic growth, so that the usual α -shape construction is invalid (see Figure 2.26).
Figure 2.26: A simple case of a Regular Triangulation for which the topology changes in a simple linear growth of the radius of the balls.
2.4.4 Examples Example 1 Here we choose a coordinate system so that two of the balls have centers on the ξ1 -axis in ℜ3 . Specifically, consider three balls B′ , B′′ , and B′′′ . Choose a coordinate system so that their centers are located at (0, 0, 0), (l12 , 0, 0), and (l13 cos β , l13 sin β , 0), where l12 and l13 are the distances between the centers of B′ and B′′ , and between the centers of B′ and B′′′ , respectively, and β is the angle made by the three centers, with B′ at the vertex. We can assume 0 < β < π . Let the solvent ball have radius r. We consider the two planes π1 , π2 relative to two trimming curves c1 , c2 . The position of the line l = π1 ∩ π2 of intersection is used to track the intersection between c1 and c2 and to give their 2D NURBS representation.
CHAPTER 2. SPATIAL OCCUPANCY
34
With the above coordinate system, the two planes have equations (see Figure 2.27):
π1 π2
: ξ1 = a1 + ra2
(4.20)
: (cos β )ξ1 + (sin β )ξ2 = a3 + ra4
(4.21)
where a1 =
2 + r2 − r2 l12 1 2 2l12
a2 =
r1 − r2 l12
a3 =
2 + r2 − r2 l13 1 3 2l13
a4 =
r1 − r3 . l13
in accordance with (4.19). The image of the trimming curve is the intersection of the spherical surfaces of the balls B′ (r) and B′′ (r), which we define as the balls of radii r1 + r and r2 + r centered at (0, 0, 0) and (l12 , 0, 0), respectively. The implicit equation of the spherical surface of B′ (r) is then ξ12 + ξ22 + ξ32 = (r1 + r)2 , and one finds that the ξ3 coordinate of the two points of intersection between this sphere and the line l is q ξ3 = ± (r1 + r)2 − ξ12 − ξ22 (4.22) The segment of the line l = π1 ∩ π2 within B′ (r) then has the parametrization:
ξ1 ξ2 ξ3
= a1 + ra2 = a5 + ra6 q (r1 + r)2 − (a1 + ra2 )2 − (a5 + ra6)2 u , =
(4.23)
−1 ≤ u ≤ 1 , where a5 =
a3 − a1 cos β sin β
a6 =
a4 − a2 cos β . sin β
For brevity, these quantities which will appear frequently in the sequel will be named as follows. Keep in mind that all of these bi are functions of r. b1
=
r1 + r
b2 b3
= =
a1 + ra2 a3 + ra4
b4
=
b5
=
b6
=
b7
=
a5 + ra6 q b21 − b22 − b24 q b21 − b22 q b22 + b24
To map the surface of the ball B′ (r) to a plane, we use an inverse mapping similar to (4.11) but for a sphere of radius r1 + r instead of 1 and specifically d = 2: x1
=
x2
=
ξ1 r1 + r − ξ3 ξ2 . r1 + r − ξ3
2.4. DYNAMIC UPDATE OF MOLECULAR SURFACE UNDER CHANGE IN RADII
35
>From this one obtains the intersection points q1 and q7 (see Figure 2.27(b); these points lie on a line through the origin) in the (x1 (r), x2 (r)) parameter space as � � b4 b2 , q1 = � b1 + b5 b1 + b5 � b4 b2 , q7 = b1 − b5 b1 − b5 and the trimming curve is an arc of the circle with center q0 =
�
b1 ,0 b2
�
and radius b6 . b2 ⌢
⌢
⌢
One next needs to find suitable break points q3 and q5 (see Figure 2.27). Ideally we want none of the arcs q1 q3 , q3 q5 , q5 q7 to be close to 180◦. We can make sure that none of these arcs exceeds 120◦ as follows. Let q8 be the midpoint of segment q1 q7 , ⌢ and let q9 be the intersection of the perpendicular bisector of q1 q7 with the arc q3 q5 . Now choose q3 and q5 to be on the line ←→ ←→ perpendicular to q8 q9 that intersects the q8 q9 at a point 3/4 of the way from q8 towards q9 . In the limiting case when q1 and ⌢ ⌢ ⌢ q7 coincide, which occurs when (r1 + r)2 = (a1 + ra2)2 + (a5 + ra6 )2 , the three arcs q1 q3 , q3 q5 , q5 q7 are all 120◦, and they all shrink as the arc q1 − q3 − q5 − q7 shrinks. ←→ In the x1 x2 -plane, line q1 q7 has the equation (a5 + ra6 )x − (a1 + ra2)y = 0. We also have q8 =
�
b1 b2 b1 b4 , 2 b27 b7
�
and q9 =
�
b1 b4 b6 b6 + ,− b2 b2 b7 b7
�
.
>From this we get
q3
=
q5
=
�
4b1 b27 − b1b24 + 3b4b6 b7 4b2 b27
−
q 6b21 b24 + 7b22b25 + 6b1b4 b6 b7
, 4b27 q 2 2 2 2 b1 b4 − 3b6b7 b4 6b1 b4 + 7b2b5 + 6b1b4 b6 b7 − 4b27 4b2 b27 q � 2 2 6b21 b24 + 7b22b25 + 6b1b4 b6 b7 4b1 b7 − b1b4 + 3b4b6 b7 + , 4b2 b27 4b27 q 2 b2 + 7b2 b2 + 6b b b b b 6b 4 1 4 6 7 b1 b4 − 3b6b7 1 4 2 5 . + 4b27 4b2 b27
We now determine q2 , q4 , and q6 as the points of intersection of the tangents lines through q1 , q3 , q5 , and q7 . We get q4 =
�
−7b21 b34 + 4b21b4 b27 − 12b1b6 b37 − 7b22b4 b25 − 9b4b26 b27 7b21 b24 + 7b22b + 52 + 9b26b27 , 4b2 b27 (b1 b4 − 3b6b7 ) 4b2 b27 (b1 b4 − 3b6b7 )
�
.
CHAPTER 2. SPATIAL OCCUPANCY
36 Also q2
� = (1/d1 ) b2 [7b31 b22 b34 + 7b31b54 − 4b31b34 b27 + 7b21b22 b34 b5 + 4b21b22 b4 b5 b27 + 7b21b54 b5
− 4b21b34 b5 b27 + 12b21b24 b6 b37 + 7b1b42 b4 b25 + 7b1b22 b34 b25 − 4b1b22 b34 b27 + 13b1b22 b4 b26 b27
− 12b1b22 b5 b6 b37 + 9b1b34 b26 b27 + 12b1b24 b5 b6 b37 + 7b42b4 b35 + 7b22b34 b35 + 12b22b24 b6 b37
+ 9b22b4 b5 b26 b27 − 12b22b36 b37 + 9b34b5 b26 b27 + (−4b21b2 b4 b27 − 8b1b2 b4 b5 b27 + 4b2b34 b27 − 4b2b4 b26 b27 )c1 ],
7b1 b22 b24 b45 + 7b1b42 b25 b26 + 7b1b22 b24 b25 b26 + 7b21b22 b24 b35 + 7b22b24 b35 b26 + 12b21b4 b36 b37 + 9b1b24 b46 b27 + 7b21b22 b24 b5 b26 − 12b22b4 b36 b37 + 7b31b22 b24 b26 + 9b21b22 b5 b26 b27 − 12b1b22 b4 b5 b6 b37 − 4b1b22 b44 b27 + 7b41b22 b24 b5 − 4b41b24 b5 b27 + 4b21b22 b24 b5 b27 + 9b1b22 b46 b27 + 7b21b44 b5 b26 − 4b31b24 b26 b27 + 4b1b22 b24 b26 b27 − 4b31b24 b25 b27 + 9b1b22 b25 b26 b27 + 12b21b4 b25 b6 b37 + 9b1b24 b25 b26 b27 + 12b31b4 b5 b6 b37 + 7b31b22 b24 b25 + 5b21b24 b5 b26 b27 + 9b22b5 b46 b27 + 12b1b4 b5 b36 b37 + 9b24b5 b46 b27 + 7b31b44 b26 + 7b41b44 b5 + 7b31b44 b25 + 7b1b42 b45 + 7b42b35 b26 + 7b21b42 b35 + 12b22b34 b6 b37
+(−4b31b2 b5 b27 − 4b21b2 b25 b27 − 4b21b2 b26 b27 + 4b1b32 b5 b27 − 4b1b2 b5 b26 b27 − 4b32b24 b27 + 4b32b26 b27 )c1 and q6
=
�
1 � b2 [4b21 b34 b5 b27 − 9b22b4 b5 b26 b27 − 12b1b24 b5 b6 b37 − 9b34b5 b26 b27 + 7b31b54 + 12b21b24 b6 b37 d2 + 9b1b34 b26 b27 − 7b21b22 b34 b5 + 12b22b24 b6 b37 − 12b22b36 b37 + 12b1b22 b5 b6 b37 − 4b21b22 b4 b5 b27 + 13b1b22 b4 b26 b27 + 7b31b22 b34 − 7b21b54 b5 − 4b31b34 b27 − 4b1b22 b34 b27 − 7b42b4 b35 − 7b22b34 b35 + 7b1b22 b34 b25 + 7b1b42 b4 b25
+ (4b21b2 b4 b27 + 4b2b4 b26 b27 − 8b1b2 b4 b5 b27 − 4b2b34 b27 )c1 ], − 7b1b22 b24 b45 − 7b1b42 b25 b26 − 7b1b22 b24 b25 b26 + 7b21b22 b24 b35 + 7b22b24 b35 b26 − 12b21b4 b36 b37
− 9b1b24 b46 b27 + 7b21b22 b24 b5 b26 + 12b22b4 b36 b37 − 7b31b22 b24 b26 + 9b21b22 b5 b26 b27 − 12b1b22 b4 b5 b6 b37 + 4b1b22 b44 b27 + 7b41b22 b24 b5 − 4b41b24 b5 b27 + 4b21b22 b24 b5 b27 − 9b1b22 b46 b27 + 7b21b44 b5 b26 + 4b31b24 b26 b27 − 4b1b22 b24 b26 b27 + 4b31b24 b25 b27 − 9b1b22 b25 b26 b27 − 12b21b4 b25 b6 b37 − 9b1b24 b25 b26 b27 + 12b31b4 b5 b6 b37 − 7b31b22 b24 b25 + 5b21b24 b5 b26 b27 + 9b22b5 b46 b27 + 12b1b4 b5 b36 b37 + 9b24b5 b46 b27
where
− 7b31b44 b26 + 7b41b44 b5 − 7b31b44 b25 − 7b1b42 b45 + 7b42b35 b26 + 7b21b42 b35 − 12b22b34 b6 b37 � +(4b32b26 b27 − 4b21b2 b25 b27 + 4b1b2 b5 b26 b27 + 4b31b2 b5 b27 − 4b21b2 b26 b27 − 4b1b32 b5 b27 − 4b32b24 b27 )c1 c1
=
d1
=
d2
=
q 6b21 b24 + 7b22b25 + 6b1b4 b6 b7
b27 (b1 + b5 )[(−b1 b4 b5 − b22 b4 − b4 b26 )c1 + b21 b2 b4 b5 − b1 b2 b34 + b1b2 b4 b26 − 3b1b2 b5 b6 b7 + 3b2b24 b6 b7 − 3b2b36 b7 ]
b27 (b1 − b5 )[(b1 b4 b5 − b22b4 − b4b26 )c1 + b21 b2 b4 b5 + b1 b2 b34 − b1b2 b4 b26 − 3b1b2 b5 b6 b7 − 3b2b24 b6 b7 + 3b2b36 b7 ]
We now need rational parametrizations of the circular arcs. The parametrization for arc q1 − q2 − q3 is provided by (x1 , x2 ) =
(1 − t)2q3 + 2t(1 − t)w1q2 + t 2 q1 , 0≤t ≤1, (1 − t)2 + 2t(1 − t)w1 + t 2
for a particular value for the weight w1 , which turns out to be the cosine of half the angle ∠q1 q0 q3 , or cos q1 q0 q2 . This can be computed as (q1 − q0 ) · (q2 − q0) w1 = . kq1 − q0kkq2 − q0 k Analogous parametrizations hold for arcs q3 − q4 − q5 and q5 − q6 − q7 .
2.4. DYNAMIC UPDATE OF MOLECULAR SURFACE UNDER CHANGE IN RADII
37
Figure 2.27: (a) (ξ1 , ξ2 ) section of the (ξ1 , ξ2 , ξ3 ) space. The circle is a cross section of ball B′ (r) of radius r1 + r. Line l, which is parallel to the ξ3 axis, is the intersection of the planes π1 and π2 , which in turn are the Voronoi planes separating B′ (r) and B′′ (r) and separating B′ (r) and B′′′ (r). (b) control points of the trimming curve that is part of the boundary of b′ (r) for Example 1. (c) the same control points in Example 2. Example 2 Here we place the balls in ℜ3 so that the line through the endpoints of a trimming arc is parallel to the x1 -axis in x1 x2 -space. Consider three balls B′ , B′′ , and B′′′ . Choose a coordinate system so that their centers are located at (0, 0, 0), (l12 cos α , −l12 sin α , 0), and (l13 cos(β − α ), l13 sin(β − α ), 0) where l12 and l13 are the distances between the centers of B′ and B′′ , and between the centers of B′ and B′′′ , respectively, β is the angle made by the three centers, with B′ at the vertex (0 < β < π ), and � � −1 (a3 + ra4 ) − (a1 + ra2 ) cos β . α = tan (a1 + ra2 ) sin β With this definition we have that α is the angle between the ray through the centers of B′ and B′′ , and the ξ1 -axis, and cos α
=
sin α
=
b2 sin β 2 (b2 − 2b2b3 cos β
+ b23)1/2 b3 − b2 cos β . 2 (b2 − 2b2b3 cos β + b23)1/2
Note that α is a function of r. This coordinate system is chosen so that the Voronoi planes defined below intersect at the ξ1 -axis. Let the solvent ball have radius r. We consider the two planes π1 , π2 relative to two trimming curves c1 , c2 . The position of the line l = π1 ∩ π2 of intersection is used to track the intersection between c1 and c2 and to give their 2D NURBS representation. With the above coordinate system, the two planes have equations:
π1 π2
: (cos α )ξ1 − (sin α )ξ2 = a1 + ra2
: [cos(β − α )]ξ1 + [sin(β − α )]ξ2 = a3 + ra4
(4.24) (4.25)
where the ai are the same as in Example 1: a1 =
2 + r2 − r2 l12 1 2 2l12
a2 =
r1 − r2 l12
a3 =
2 + r2 − r2 l13 1 3 2l13
a4 =
r1 − r3 , l13
in accordance with (4.19). The image of the trimming curve is the intersection of the spherical surfaces of the balls B′ (r) and B′′ (r), which we define as the balls of radii r1 + r and r2 + r centered at (0, 0, 0) and (l12 cos α , −l12 sin α , 0), respectively. The implicit equation of the
CHAPTER 2. SPATIAL OCCUPANCY
38
spherical surface of B′ (r) is then ξ12 + ξ22 + ξ32 = (r1 + r)2 , and one finds that the ξ3 coordinate of the two points of intersection between this sphere and the line l is q ξ3 = ± (r1 + r)2 − ξ12 − ξ22 (4.26) The segment of the line l = π1 ∩ π2 within B′ (r) then has the parametrization:
ξ1 ξ2 ξ3
= (a1 + ra2 )/ cos α = 0 q (r1 + r)2 − (a1 + ra2)2 / cos2 α u , =
(4.27)
−1 ≤ u ≤ 1 .
To map the surface of the ball B′ (r) to a plane, we use an inverse mapping similar to (4.11) but for a sphere of radius r1 + r instead of 1 and specifically d = 2: x1
=
x2
=
ξ1 r1 + r − ξ3 ξ2 . r1 + r − ξ3
>From this one obtains the intersection points q1 and q7 (see Figure 2.27(c)) in the (x1 (r), x2 (r)) parameter space as q b1 cos α − b21 cos2 α − b22 q1 = , 0 b2 q b1 cos α + b21 cos2 α − b22 , 0 q7 = b2
and the trimming curve is an arc of the circle with center � � b1 cos α b1 sin α q0 = ,− b2 b2 and radius
b6 . b2 ←→
←→
In the x1 x2 -plane, line q1 q7 is just the x1 -axis, and line q8 q9 is x1 = b1 cos α /b2 . We also have � � b1 cos α ,0 q8 = b2 and q9 =
�
b1 cos α b1 sin α + b6 ,− b2 b2
�
.
>From this we find that the break points q3 and q5 are q3 q5
=
b1 cos α (7b26 − b21 sin2 α + 6b1b6 sin α )1/2 3 b1 sin α + b6 − ,− b2 4b2 4 b2
!
=
b1 cos α (7b26 − b21 sin2 α + 6b1b6 sin α )1/2 3 b1 sin α + b6 + ,− b2 4b2 4 b2
!
.
2.5. MAINTAINING UNION OF BALLS UNDER ATOM MOVEMENTS
39
We now determine q2 , q4 , and q6 as the points of intersection of the tangents lines through q1 , q3 , q5 , and q7 . We get � � 4b26 b1 cos α b1 sin α q4 = . ,− + b2 b2 b2 (b1 sin α − 3b6) Also q2
=
�
3b26 (b1 sin α + b6) b26 (c2 − 4c1) b1 cos α b1 sin α − ,− + b2 b2 [b1 (c2 − c1 ) sin α + 3b6c1 ] b2 b2 [b1 (c2 − c1) sin α + 3b6c1 ]
�
=
�
3b26 (b1 sin α + b6) b26 (c2 − 4c1) b1 sin α b1 cos α + ,− + b2 b2 [b1 (c2 − c1 ) sin α + 3b6c1 ] b2 b2 [b1 (c2 − c1) sin α + 3b6c1 ]
�
and q6 where c1
=
c2
=
q b21 cos2 α − b22 q 7b26 − b21 sin2 α + 6b1b6 sin α .
2.5 Maintaining Union of Balls Under Atom Movements We describe the packing grid data structure [7, 8] for maintaining a set M of balls in 3-space efficiently under the following set of queries and updates. By B = (c, r) we denote a ball withcenter c and radius r. Queries. • I NTERSECT( c, r ): Return all balls in M that intersect the given ball B = (c, r). The given ball may or may not belong to the set M. • R ANGE( p, δ ): Return all balls in M with centers within distance δ of point p. We assume that δ is at most a constant multiple of the radius of the largest ball in M. • E XPOSED( c, r ): Returns true if the ball B = (c, r) contributes to the outer boundary of the union of the balls in M. The given ball must belong to M. • S URFACE( ): Returns the outer boundary of the union of the balls in M. If there are multiple disjoint outer boundary surfaces defined by M, the routine returns any one of them. Updates. • A DD( c, r ): Add a new ball B = (c, r) to the set M. • R EMOVE( c, r ): Remove the ball B = (c, r) from M. • M OVE( c1 , c2 , r ): Move the ball with center c1 and radius r to a new center c2 . We assume that at all times during the lifetime of the data structure the following holds. Assumption 2.5.1. If rmax is the radius of the largest ball in M, and dmin is the minimum Euclidean distance between the centers of any two balls in M, then rmax = O (dmin ). In general, a ball in a collection of n balls in 3-space can intersect Θ (n) other balls in the worst case, and it has�been shown in [25] that the boundary defined by the union of these balls has a worst-case combinatorial complexity of Θ n2 . However, if M is a “union of balls” representation of the atoms in a molecule, then assumption 2.5.1 holds naturally [49, 76], and as proved in [49], in that case, both complexities improve by a factor of n. The following theorem states the consequences of the assumption.
CHAPTER 2. SPATIAL OCCUPANCY
40
T IME C OMPLEXITY O PERATIONS R ANGE( p, δ ) | I NTERSECT( c, r ) | E XPOSED( c, r ) (δ = O (rmax )) S URFACE( ) A DD( c, r ) | R EMOVE( c, r ) | M OVE( c1 , c2 , r )
A SSUMING tq = O (log log w), tu = O (log w)
A SSUMING tq = O (log � � log n),
O (log log w) (w.h.p.)
O (log log n) (w.h.p.)
tu = O
log n log log n
O (#balls on surface) (worst-case) � � O (log w) (w.h.p.) O logloglogn n (w.h.p.)
A SSUMPTIONS : (i) RAM with w-bit Words, (ii) Collection of n Balls, and (iii) rmax = O (minimum distance between two balls)
Table 2.2: Time complexities of the operations supported by the packing grid data structure. Theorem 2.5.1. (Theorem 2.1 in [49], slightly modified) Let M = {B1 , . . . , Bn } be � a collection of n balls in 3-space with radii r1 , . . . , rn and centers at c1 , . . . , cn . Let rmax = maxi {ri } and let dmin = mini, j d(ci , c j ) , where d(ci , c j ) is the Euclidean distance between ci and c j . Also let δ M = {δ B1 , . . . , δ Bn } be the collection of spheres such that δ Bi is the boundary surface of Bi . If rmax = O (dmin ) (i.e., Assumption 2.5.1 holds), then: (i) Each Bi ∈ M intersects at most 216 · (rmax /dmin )3 = O (1) other balls in M. � � (ii) The maximum combinatorial complexity of the boundary of the union of the balls in M is O (rmax /dmin )3 · n = O (n).
P ROOF. Similar to the proof of Theorem 2.1 in [49].
⊓ ⊔
Therefore, as Theorem 2.5.1 suggests, for intersection queries and boundary construction, one should be able to handle M more efficiently if assumption 2.5.1 holds. The efficiency of our data structure, too, partly depends on this assumption.
2.5.1 Preliminaries Before we describe our data structure we present several definitions in order to simplify the exposition. Definition 2.5.1 (r-grid and grid-cell). An r-grid is an axis-parallel infinite grid structure in 3-space consisting of cells of size r × r × r (r ∈ R) with the root (i.e., the corner with the smallest x, y, z coordinates) of one of the cells coinciding with origin of the (Cartesian) coordinate axes. The grid cell that has its root at Cartesian coordinates (ar, br, cr) (where a, b, c ∈ Z) is referred to as the (a, b, c, r)-cell or simply as the (a, b, c)-cell when r is clear from the context. Definition 2.5.2 (grid-line). The (b, c, r)-line (where b, c ∈ Z) in an r-grid consists of all (x, y, z, r)-cells with y and z fixed to b and c, respectively. When r is clear from the context the (b, c, r)-line will simply be called the (b, c)-line. Observe that each cell on the (b, c, r)-line can be identified with a unique integer, e.g., the cell at index a ∈ Z on the given line corresponds to the (a, b, c, r)-cell in the r-grid. Definition 2.5.3 (grid-plane). The (c, r)-plane (where c ∈ Z) in an r-grid consists of all (x, y, z, r)-cells with z fixed to c. The (c, r)-plane will be referred to as the c-plane when r is clear from the context. The (c, r)-plane can be decomposed into an infinite number of lines each identifiable with a unique integer. For example, index b ∈ Z uniquely identifies the (b, c, r)-line on the given plane. Also each grid-plane in the r-grid can be identified with a unique integer, e.g., the (c, r)-plane is identified by c. The proof of the following lemma is straight-forward. Lemma 2.5.1. Let M = {B1 , . . . , Bn } be of n balls in 3-space with radii r1 , . . . , rn and centers at c1 , . . . , cn . Let � a collection rmax = maxi {ri } and let dmin = mini, j d(ci , c j ) , where d(ci , c j ) is the Euclidean distance between ci and c j . Suppose M is stored in the 2rmax -grid G. Then
2.5. MAINTAINING UNION OF BALLS UNDER ATOM MOVEMENTS
41 3
(i) If rmax = O (dmin ) (i.e., Assumption 2.5.1 holds) then each grid-cell in G contains the centers of at most 64 ·(rmax /dmin ) = O (1) balls in M. (ii) Each ball in M intersects at most 8 grid-cells in G. (iii) For a given ball B ∈ M with center in grid-cell C, the center of each ball intersecting B lies either in C or in one of the 26 grid-cells adjacent to C. (iv) The number of non-empty (i.e., containing the center of at least one ball in M) grid-cells in G is at most n, and the same bound holds for grid-lines and grid-planes. At the heart of our data structure is a fully dynamic one dimensional integer range reporting data structure for word RAM described in [62]. The data structure in [62] maintains a set S of integers under updates (i.e., insertions and deletions), and answers queries of the form: report any or all points in S in a given interval. The following theorem summarizes the performance bounds of the data structure which are of interest to us. Theorem 2.5.2. (proved in [62]) On a RAM with w-bit words the fully dynamic one dimensional integer range reporting problem can be solved in linear space, and w.h.p. bounds of O (tu ) and O (tq + k) on update time and query time, respectively, where k is the number of items reported, and (i) tu = O (log w) and tq = O (log log w) using the data structure in [62]; and (ii) tu = O (log n/loglog n) and tq = O (log log n) using the data structure in [62] for small w and a fusion tree [42] for large w. The data structure can be augmented to store satellite information of size O (1) with each integer without degrading its asymptotic performance bounds. Therefore, it supports the following three functions: 1. I NSERT( i, s ): Insert an integer i with satellite information s. 2. D ELETE( i ): Delete integer i from the data structure. 3. Q UERY( l, h ): Return the set of all h i, s i tuples with i ∈ [l, h] stored in the data structure.
2.5.2 Description (Layout) of the Packing Grid Data Structure We are now in a position to present our data structure. Let DPG be the data structure. We represent the entire 3-space as a 2rmax -grid (see Definition 2.5.1), and maintain the non-empty grid-planes (see Definition 2.5.3), grid-lines (see Definition 2.5.2) and grid-cells (see Definition 2.5.1) in DPG. A grid component (i.e., cell, line or plane) is non-empty if it contains the center of at least one ball in M. The data structure can be described hierarchically. It has a tree structure with 5 levels: 4 internal levels (levels 3, 2, 1 and 0) and an external level of leaves (see Figure 2.28). The description of each level follows. The Leaf Level “Ball” Data Structure (DPG−1 ). The data structure stores the center c = (cx , cy , cz ) and the radius r of the given ball B. It also includes a Boolean flag exposed which is set to true if B contributes to the outer boundary of the union of the balls in M, and false otherwise. If another ball B′ intersects B, it does so on a circle which divides the boundary δ B of B into two parts: one part is buried inside B′ and hence cannot contribute to the union boundary, and the other part is exposed w.r.t. B′ and hence might appear on the union boundary. The circular intersections of all balls intersecting B define a 2D arrangement A on δ B which according to Theorem 2.5.1 has O (1) combinatorial complexity. A face of A is exposed, i.e., contributes to the union boundary, provided it is not buried inside any other ball. Observe that if at least one other ball intersects B, and A has an exposed face f , then each edge of f separates f from another exposed face f ′ which belongs to the arrangement A′ of a ball intersecting B. We store all exposed faces (if any) of A in a set F of size O (1), and with each face f we store pointers to the data structures of O (1) other balls that share edges with f and also the identifier of the corresponding face on each ball. Observe that if B does not intersect any other balls then F will contain only a single face and no pointers to any other balls. The Level 0 “Grid-Cell” Data Structure (DPG0 ). The “grid-cell” data structure stores the root (see Definition 2.5.1) (a, b, c) of the grid-cell it corresponds to. A grid-cell can contain the centers of at most O (1) balls in M (see Lemma 2.5.1). Pointers to
CHAPTER 2. SPATIAL OCCUPANCY
42
Figure 2.28: Hierarchical structure of DPG data structures of all such balls are stored in a set S of size O (1). Since we create “grid-cell” data structures only for non-empty grid-cells, there will be at most n (and possibly ≪ n) such data structures, where n is the current number of balls in M. The Level 1 “Grid-Line” Data Structure (DPG1 ). We create a “grid-line” data structure for a (b, c)-line provided it contains at least one non-empty grid-cell. The data structure stores the values of b and c. Each (a, b, c)-cell lying on this line is identified with the unique integer a, and the identifier of each such non-empty grid-cell is stored in an integer range search data structure RR as described in Section 2.5.1 (see Theorem 2.5.2). We augment RR to store the pointer to the corresponding “grid-cell” data structure with each identifier it stores. The total number of “grid-line” data structure created is upper bounded by n and possibly much less than n. The Level 2 “Grid-Plane” Data Structure (DPG2 ). A “grid-plane” data structure is created for a c-plane provided it contains at least one non-empty grid-line. Similar to the “grid-line” data structure it identifies each non-empty (b, c)-line lying on the c-plane with the unique integer b, and stores the identifiers in a range reporting data structure RR described in Section 2.5.1. A pointer to the corresponding “grid-line” data structure is also stored with each identifier. The data structure also stores c. The total number of “grid-plane” data structures created cannot exceed n, and will possibly be much less than n. The Level 3 “Grid” Data Structure (DPG3 ). This data structure maintains the non-empty grid-planes of the 2rmax -grid in an integer range reporting data structure RR (see Section 2.5.1). Each c-plane is identified by the unique integer c, and each such integer stored in RR is also accompanied by a pointer to the corresponding “grid-plane” data structure. The “grid” data structure also stores a surface-root pointer which points to the “Ball” data structure of an arbitrary exposed ball in M. We have the following lemma on the space usage of the data structure. Lemma 2.5.2. Let M be a collection of n balls as defined in Theorem 2.5.1, and let Assumption 2.5.1 holds. Then the packing grid data structure storing M uses O (n) space. P ROOF. The space usage of the data structure is dominated by the space used by the range reporting data structures, the grid-cells and the “ball” data structures. Since the range reporting data structures use linear space (see Theorem 2.5.2) and total number of non-empty grid components (i.e., planes, lines and cells) is O (n) (see Lemma 2.5.1), total space used by all such data structures is O (n). The grid cells contain pointers to “ball” data structures, and since no two grid-cells point to the same “ball” data structure, total space used by all grid-cells is also O (n). Each “ball” data structure contains the arrangement A and the face decomposition F of the exposed (if any) faces of the ball. The total space needed to store all such arrangements and
2.5. MAINTAINING UNION OF BALLS UNDER ATOM MOVEMENTS 43 � � decompositions is O (rmax /dmin )3 · n (see Theorem 2.5.1) which reduces to O (n) under Assumption 2.5.1. Thus the total space used by the data structure is O (n). ⊓ ⊔
2.5.3 Queries and Updates The queries and updates supported by the data structure are implemented as follows. Queries. (1) R ANGE( p, δ ): Let p = (px , py , pz ). We perform the following steps. i. Level 3 Range Query: We invoke the function Q UERY( l, h ) of the range reporting data structure RR under DPG3 (i.e., the level 3 “grid” data structure) with l = ⌊(pz − δ )/(2rmax )⌋ and h = ⌊(pz + δ )/(2rmax )⌋. This query returns a set S2 of tuples, where each tuple h c, Pc i ∈ S2 refers to a non-empty c-plane with a pointer Pc to its level 2 “grid-plane” data structure. ii. Level 2 Range Query: For each h c, Pc i ∈ S2 , we call the range query function under the corresponding level 2 data � � � � structure with l = (py − δ ′ )/(2rmax ) and h = (py + δ ′ )/(2rmax ) , where (δ ′ )2 = δ 2 − (c − pz )2 if c − pz < δ , and δ ′ = rmax otherwise. This query returns a set S1,c of triples, where each triple h b, c, Pb,c i ∈ S1,c refers to a non-empty ( b, c )-line with a pointer Pb,c to its level 1 “grid-line” data structure. We obtain the set S1 by merging all S1,c sets. iii. Level 1 Range Query: For each h b, c, Pb,c i ∈ S1 , we call the integer range query function under the corresponding level 1 “grid-line” data structure with l = ⌊(px − δ ′′ )/(2rmax )⌋ and h = ⌊(px + δ ′′ )/(2rmax )⌋, where (δ ′′ )2 = δ 2 − (b − py)2 − (c − pz)2 if δ 2 > (b − py )2 + (c − pz )2 , and δ ′′ = rmax otherwise. This query returns a set S0,b,c of quadruples, where each quadruples h a, b, c, Pa,b,c i ∈ S0,b,c refers to a non-empty ( a, b, c )-cell with a pointer Pa,b,c to its level 0 “grid-cell” data structure. We obtain the set S0 by merging all S0,b,c sets. iv. Ball Collection: For each h a, b, c, Pa,b,c i ∈ S0 , we collect from the level 0 data structure of the corresponding ( a, b, c )cell each ball whose center lies within distance δ from p. We collect the pointer to the leaf level “ball” data structure of each such ball in a set S, and return this set. The correctness of the function follows trivially since it queries a region in 3-space which includes the region covered by � � 2 a ball of radius δ centered at p. It is straight-forward to see that the function makes at most O π · (⌈δ /rmax ⌉ + 1) calls to � � a range reporting data structure, and collects balls from at most O 34 π · (⌈δ /rmax ⌉ + 1)3 grid-cells. Using Lemma 2.5.1 and � � Theorem 2.5.2, we conclude that w.h.p. the function terminates in O (δ /rmax )2 · tq + ((δ + rmax )/dmin )3 time. Assuming
rmax = O (dmin ) (i.e., Assumption 2.5.1) and δ = O (rmax ), the complexity reduces to O (tq ) (w.h.p.). (2) I NTERSECT( c, r ): Let B = (c, r) be the given ball. We perform the following two steps.
i. Ball Collection: We call R ANGE( c, r + rmax ) and collect the output in set S which contains pointers to the data structure of each ball in M with its center within distance r + rmax from c. ii. Identifying Intersecting Balls: From S we remove the data structure of each ball that does not intersect B, and return the resulting (possibly reduced) set. We know from elementary geometry that two balls of radii r1 and r2 cannot intersect unless their centers lie within distance r1 + r2 of each other. Therefore, step (i) correctly identifies all balls that can possibly intersect B, and step (ii) completes the identification. Step (i) � � takes � �
O tq + (rmax /dmin )3 time w.h.p., and step (ii) terminates in O (rmax /dmin )3 time in the worst case. Therefore, under Assumption 2.5.1 w.h.p. this function runs in O (tq ) time.
CHAPTER 2. SPATIAL OCCUPANCY
44
(a)
(b)
(c)
(d)
(a)
(b)
(c)
(d)
(a)
(b)
(c)
(d)
Figure 2.29: Top row: Level 3 Range Query. (a) Query region defined by the sphere of radius δ at point p inside the level 3 grid, (b) The level 3 grid as a collection of level 2 grid-planes, (c) and (d) Range reporting query returns the set of non-empty grid-planes within the query region. Middle row: Level 2 Range Query. (a) On each grid-plane, query region is defined by a circular slice of the sphere of radius δ at point p, (b), (c) and (d) Range reporting query on such a grid-plane returns the set of non-empty grid-lines within the query region. Bottom row: Level 1 Range Query. (a) and (b) Query region in each grid-line is defined as an interval, (c) and (d) For each grid-line, range reporting query returns the set of non-empty grid-cells (3) E XPOSED( c, r ): Let B = (c, r) be the given ball. We locate � by calling R ANGE( c, 0 ), and return � B’s data structure 3 the value stored in its exposed field. Clearly, the function takes O tq + (rmax /dmin ) time (w.h.p.) which reduces to O (tq ) (w.h.p.) under Assumption 2.5.1. (4) S URFACE( ): The surface-root pointer under the level 3 “grid” data structure points to the “ball” data structure of a ball B on the union boundary of M. We scan the set F of exposed faces of B, and using the pointers to other exposed balls stored in F we perform a depth-first traversal of all exposed balls in M and return the exposed faces on each such ball. Let m be�the number of balls � contributing to the union boundary of M. Then according to Theorem 2.5.1 the depth-first search takes 3 O (rmax /dmin ) · m time in the worst case which reduces to O (m) under Assumption 2.5.1. Updates. k j u , where u ∈ {x, y, z}. We perform the following steps. (1) A DD( c, r ): Let c = (cx , cy , cz ) and let c′u = 2rcmax i. If M 6= 0, / let G be the grid data structure, otherwise create and initialize G. Add input ball to M.
ii. Query the range reporting data structure G.RR to locate the data structure P for the c′z -plane. If P does not exist create and initialize P, and insert c′z along with a pointer to P into G.RR. iii. Query P.RR and locate the data structure L for the (c′y , c′z )-line. If L does not exist then create and initialize L, and insert c′y along with a pointer to L into P.RR. iv. Locate the data structure C for the (c′x , c′y , c′z )-cell by querying L.RR. Create and initialize C if it does not already exist, and insert c′x and a pointer to C into L.RR.
2.5. MAINTAINING UNION OF BALLS UNDER ATOM MOVEMENTS
45
v. Create and initialize a data structure B for the input ball and add it to the set C.S. vi. Call I NTERSECT( c, r ) and find the set I of the “ball” data structures of all balls that intersect the input ball. Create the arrangement B.A using the balls in I. The new ball may partly or fully bury some of the balls it intersects, and hence we need to update the arrangement B′ .A, the set B′ .F and the flag B′ .exposed of each B′ ∈ I. The set B.F is created and B.exposed is initialized using the information in the updated data structures in I. If the surface-root pointer was pointing to a ball in I that got completely buried by the new ball, we update it to point to B instead. Observe that the introduction of a new ball may affect the surface exposure of only the balls it intersects (i.e., bury some/all of them partly or completely), and no other balls. Hence, the updates performed in step (vi) (in addition to those in earlier steps) are sufficient to maintain the correctness of the entire data structure. Steps (i) and (v) take O (1) time in the worst case, and w.h.p. each of steps (ii), (iii) and (iv) takes O (tq + tu ) time. Finding the intersecting balls in step (vi) takes � � O tq + (rmax /dmin )3 time w.h.p., according to Theorem 2.5.1 creating and updating the arrangements and faces will take � � � � O (rmax /dmin )3 × (rmax /dmin )3 = O (rmax /dmin )6 time (w.h.p.). Thus the A DD function terminates in � � O tq + tu + (rmax /dmin )6 time w.h.p., which reduces to O (tu ) (w.h.p.) assuming rmax = O (dmin ) (i.e., Assumption 2.5.1).
(2) R EMOVE( c, r ): This function is symmetric to the A DD function, and has exactly the same asymptotic time complexity. Hence, we do not describe it here. (3) M OVE( c1 , c2 , r ): This function is implemented in the obvious way by calling R EMOVE( c1 , r ) followed by A DD( c2 , r ). It has the same asymptotic complexity as the two functions above. Therefore, we have the following theorem. Theorem 2.5.3. Let M be a collection of n balls in 3-space as defined in Theorem 2.5.1, and let Assumption 2.5.1 holds. Let tq and tu be as defined in Theorem 2.5.2. Then the packing grid data structure storing M on a word RAM: (i) uses O (n) space; (ii) supports updates (i.e., insertion/deletion/movement of a ball) in O (tu ) time w.h.p.; (iii) reports all balls intersecting a given ball or within O (rmax ) distance from a given point in O (tq ) time w.h.p., where rmax is the radius of the largest ball in M; and (iv) reports whether a given ball is exposed or buried in O (tq ) time w.h.p., and returns the entire outer union boundary of M in O (m) worst-case time, where m is the number of balls on the boundary. In Table 2.2 we list the time complexities of the operations supported by our data structure.
2.5.4 Molecular Surface Maintenace Using DPG In this section, we briefly describe applications of the packing grid data structure for efficient maintenance of molecular surfaces. Maintaining van der Waals Surface of Molecules For dynamic maintenance of the van der Waals surface of a molecule we can use the packing grid data structure directly. Each atom is treated as a ball with a radius equal to the van der Waals radius of the atom (see [19] for a list of van der Waals radius of different atoms). Maintaining Lee-Richards (SCS/SES) Surface We can use the packing grid data structure for the efficient maintenance of the Lee-Richards surface of a molecule under insertion/deletion/movement of atoms. The performance bounds given in Table 2.2 remain unchanged. We maintain two packing grid data structures: DPG and DPG’. The DPG data structure keeps track of the patches on the Lee-Richards surface, and DPG’ is used for detecting intersections among concave patches.
46
CHAPTER 2. SPATIAL OCCUPANCY
Before adding an atom to DPG, we increase its radius rs , where rs is the radius of the rolling solvent atom. The DPG data structure keeps track of all solvent exposed atoms, i.e., all atoms that contribute to the outer boundary of the union of these enlarged atoms. Theorem 2.5.1 implies that each atom in DPG contributes O (1) patches to the Lee-Richards surface, and the insertion/deletion/movement of an atom results in local changes of only O (1) patches. We can modify DPG to always keep track of where two or three of the solvent exposed atoms intersect, and once we know the atoms contributing to a patch we can easily compute the patch in O (1) time [10]. The Lee-Richards surface can self-intersect in two ways: (i) a toroidal patch can intersect itself, and (ii) two different concave patches may intersect [10]. The self-intersections of toroidal patches can be easily detected from DPG. In order to detect the intersections among concave patches, we maintain the centers of all current concave patches in DPG’, and use the I NTERSECT query to find the concave patch (if any) that intersects a given concave patch.
2.6 Clustering and Decimation of Molecular Surfaces In this section we discuss a multiresolution representation scheme for molecular shapes using the object’s skeletal structure (i.e. zero-shape). This scheme is coupled with error estimates that takes into account the actual boundary surface of the shape. The boundary representation is derived from the topological structure underlying the representation of the molecular body (see Figure 2.38). Specifically, we consider the following three different boundary surface models: the Solvent Accessible Surface (SAS), the Lee-Richards Solvent Contact Surface, and the molecular skin. These three surfaces all have an underlying topological structure based on the regular (weighted Delaunay) triangulation and power diagram of the input set of balls. In case of actual molecules the input is a set of atoms each represented as a ball with its van der Waals radius. The corresponding weighted-point representation is the center of the atom associated with a weight equal to the square of the van der Waals radius. See section 2.2.1 for details about this representation. A particular kind of vertex clustering as is used as decimation primitive. The clustering replaces two balls (atoms) with one. The weight of the new ball is chosen in order to preserve some covering relation between the coarse and fine levels of resolution. This covering property is important to guarantee a conservative estimate of the location where the molecule lies and can be used in several application domains such as collision detection and ray casting. The Delaunay property is preserved after the clustering by applying a sequence of flips in the triangulation. For fast traversal, the multiresolution data structure created using this ball clustering primitive is a Directed Acyclic Graph (DAG) of nodes, where each node represents a clustering operation and the edges denote dependencies between nodes. A cut in this graph is a collection of edges which intersect all paths from the root to the leaves once and only once. Any such cut represents a valid multi-resolution approximation of the model [29, 58]. A more adaptive and space-efficient model is a forest of binary trees storing the cluster ball as the parent of the two replaced balls. This model depends on run-time updates of the triangulation (flips), but supports a much larger space of possible triangulations due to the reduced number of dependencies. The hierarchy is built bottom up by a sequence of decimation stages until a maximum error tolerance is reached or there are no more balls to be removed. Several error norms are used to evaluate the quality of any adaptive level of detail including support for the estimation of conservative bounds of the exact Hausdorff distance. While the decimation scheme, the hierarchical structure and the error estimates are defined in any dimension, we show practical results for a 2D implementation.
2.6.1 Preliminary- Mixed Cell Complex The mixed cell complex consists of the weighted Delaunay triangulation, or regular triangulation (see the Related Math Section for definitions), at the lowest level, say the plane z = 0, and the corresponding weighted Voronoi diagram, or power diagram, at the highest level, say z = 1. Then each vertex of the power diagram is connected by line segments to the three vertices of the triangle to which it corresponds in the regular triangulation. (see Figure 2.30). Thus tetrahedra are formed by this construction; one example is tetrahedron PABC. Furthermore, two points connected by an edge in the power diagram are connected to two triangles that share an edge in the regular triangulation. Thus another set of tetrahedra is formed by the four endpoints of two such corresponding edges. For example, P and Q are connected to triangles △ABC and △ACE, and the edges PQ and AC form tetrahedron PQAC. For any value of z between 0 and 1 we can take a cross section of the structure defined above and obtain intermediate tessellation of the space into convex cells. In each non empty tile we have a portion of a quadratic surface (curve) that match in
2.6. CLUSTERING AND DECIMATION OF MOLECULAR SURFACES
47
R Q P
D E C
A
B
Figure 2.30: Scaffolding model. Points A, B,C, D, E, in the plane z = 0, are the atom centers, and are the vertices of a Delaunay triangulation. Points P, Q, R, in the plane z = 1, are the vertices of the corresponding Voronoi diagram. C1 continuity with the patches defined in the neighboring tiles. The whole surface is called the molecular skin and is used as a representation for molecular boundaries. At each level we can connect appropriate segments with A-splines or a molecular skin to represent the molecular surface at varying degrees of resolution. Figure 2.31 shows the power diagram and regular triangulation at z = 1/3 and z = 2/3, respectively.
2.6.2 Decimation of Molecular Shapes In this subsection we focus on the problem of decimating molecular shapes. We consider the problem from the viewpoint of decimating the set of weighted points that induces the molecular shape (the centers of the atoms) rather then decimating some triangulation of its boundary. This approach has two main advantages: (i) one has to deal with a set of smaller cardinality because a high quality representation of the boundary would require a dense sampling with many points per atom, (ii) the same multiresolution data structure induces a hierarchical representation for several types of molecular shapes (e.g. SAS, SCS or skin) instead of having a distinct multiresolution representation for each of them. Roughly speaking the goal of decimating a molecular shape is to produce a coarse but simpler representation of the original model that is too large for the available computational resources. Definition 2.6.1. (Coarsening). Given a model M (molecular shape) of cardinality k (number of balls) any coarse representation M ′ of M (written M ′ ≻ M) is a model of cardinality k′ < k and such that: p ∈ M ⇒ p ∈ M ′ . We say that M ′ is a coarsening of M. For example Figure 2.32(a-d) shows three coarse representations M1 , M2 , M3 of the molecular shape M in Figure 2.38. The four representations are in the following relationship: M3 ≻ M2 ≻ M1 ≻ M More generally it is easy to show that: Property 1. The relation “ ≻” is transitive. The transitive property of “ ≻” suggests a simple and efficient way to build a multiresolution representation of a molecular model by successive application of local coarsening primitives.
CHAPTER 2. SPATIAL OCCUPANCY
48
D’ 3
D’ 3
R’
E’ 3
E’ 3 C’ 3
E’ 2
T’ Q’
U’
C’ 3
E’ 2
C’ 2
1011111111 0000000 1010 1010
C’ 2
C’ 1
C’ 1
S’
P’
A’ 2 A’ 1
A’ 2
B’ 1
(a)
D" 3 R"
E" 3
E" 3 U"
E" 2
C" 2
Q"
101111111 000000 10 1010 10
S" A" 2
E" 2
C" 3 C" 2
C" 1
P" B" A" 1 1 (c)
(b)
D" 3 C" 3
T"
B’ 1
A’ 1
C" 1 A" 2 A" 1
B" 1
(d)
Figure 2.31: (a) Power diagram and (b) regular triangulation for the cross section of the mixed cell at z = 1/3, and (c) power diagram and (d) regular triangulation at z = 2/3.
2.6. CLUSTERING AND DECIMATION OF MOLECULAR SURFACES
(a) M1 ≻ M
(e) M1 ≻ M
(b) M2 ≻ M1
49
(c) M3 ≻ M2
(f) M2 ≻ M1
(g) M3 ≻ M2
(h) M4 ≻ M3
(d) M3 ≻ M
(i) M4 ≻ M
Figure 2.32: Top: Coarsening relationships between three representations M1 , M2 , M3 of the molecular shape M in Figure 2.38. Bottom: Coarsening relationships between four representations M1 , M2 , M3 , M4 of a second molecular shape M. Vertex Clustering General decimation schemes like edge-contraction do not preserve the Delaunay property which is the basis for all our molecular models. The known schemes like [28] for decimation that guarantee the Delaunay property while building a multiresolution hierarchy also do not seem appropriate in our case. This is because we do not use the triangulation as a direct shape representation of the molecular body. The triangulation is instead used to describe the skeletal structure of the molecule. Hence in the decimation process we have to take into account more than the modifications that occur in the triangulation itself the modifications that are induced to the corresponding molecular shape (union of balls, SAS, SCS, ...). Let pu = (u, wu ), pv = (v, wv ) be two weighted vertices. e = (u, v) is a part of the zero shape if: ku − vk2 − wu − wv < 0 (see [34] for the complete condition). This means that the two balls representing pu and pv overlap, and therefore they are good candidates for clustering. In order not to be dependent on the radius of the atoms, we actually use the Euclidean distance between the vertices to represent priority for clustering. Hence, we are looking on all atoms which overlap and cluster the closest ones first. Clustering is done by removing the two vertices from the triangulation and inserting a new one. We choose the weight and position of the new vertex such that its ball will enclose the two replaced vertices balls. The fact is, that if we choose a ball which is ε greater than the enclosing ball, and correct to preserve a regular triangulation, then the two old vertices will be redundant and will not need to be removed2. We use two variation of the Vertex Clustering primitive depending on the tradeoff between efficiency and accuracy. Definition 2.6.2. (Coarse Representation Ball). Let M = {bi }ki=0 be the set of balls representing the original atoms of a given molecular shape, and let M ′ ⊂ M. Then b is a coarse representation of M ′ if for each b j ∈ M‘, b ≻ b j . LVC (Local Vertex Clustering) is the simpler and more efficient version of vertex clustering (see Figure 2.33(a)): Definition 2.6.3. (LVC). Let b1 , b2 be be a coarse representation of M1 , M2 , (Mi ⊂ M). The Local Vertex Clustering (LVC) coarse representation of M1 ∪ M2 is a single ball b of radius r such that: b = min {b : b ≻ b1 ∪ b2 } . r
2 Note
that the points do not always become redundant in the sense that a flip will remove them from the triangulation. They are redundant only in the sense the points of their ball are also points of at least one other ball, hence their removal would not alter the molecular body itself (the set of boundary points does not change and the set of interior points remains the same).
CHAPTER 2. SPATIAL OCCUPANCY
50
Figure 2.33a shows the case where the balls a, b, c, d, e and f are in the following relation: e = LVC{a, b}, f = LVC{c, d} and g = LVC{e, f }. It is easy to see that the LVC can be computed in constant time. In particular consider two balls b1 , b2 of radii r1 , r2 and which centers c1 , c2 have distance d = kc1 − c2 k. The ball b = LVC{b1 , b2 } has radius r and center c given by: r=
d + r1 + r2 , 2
c=
c1 + c2 r1 − r2 + (c1 − c2 ). 2 2d
A more tight coarsening procedure is based on the following clustering scheme (see Figure 2.33(b)): Definition 2.6.4. (MVC). Let b1 , b2 be be a coarse representation of M1 , M2 , (Mi ⊂ M). The Minimum Vertex Clustering (MVC) coarse representation of M1 ∪ M2 is a single ball b of radius r such that: b = min {b : b ≻ M1 ∪ M2 } . r
Clearly, the computation of the MVC coarsening is more expensive than the LVC. We determine the MVC using the Smallest Enclosing Ball Library by Dave White [79] which implements the optimal algorithm by Emo Welzl [78] generalized from the case of a set of points to the case of a set of balls.
(a)
(b)
Figure 2.33: Two cascaded step of Vertex Clustering coarsening. (a) Local Vertex Clustering (LVC). (b) Minimal Vertex Clustering (MVC).
2.6.3 Multiresolution Hierarchy Construction The basic decimation operation used for building the hierarchy is vertex clustering of edges which lie on the zero-shape. Definition 2.6.5. (independent clustering). Let ev = (v0 , v1 ), eu = (u0 , u1 ) be two edges in the triangulation. and v2 , u2 the two new vertices introduced if ev , eu were clustered. ev and eu can be independently clustered if and only if ∀i, vi 6= ui . The construction algorithm proceeds by creating consecutive levels of coarser approximations of the triangulation. Each level is constructed by using a priority queue (heap) for the zero-shape edges according to the error norm used (see Section 2.6.4). For fast traversal, The decimation operations are collected in a DAG similar to [28]. This structure requires that only non-dependent vertices be clustered in each level. Definition 2.6.6. (Dependent Vertex). A vertex v is considered dependent at level k if one of the following is true: 1) v has been clustered at any level i < k. 2) v has been introduced (as a cluster of two others) at level k. 3) v is a neighbor of u, where u satisfies either 1 or 2 above.
2.6. CLUSTERING AND DECIMATION OF MOLECULAR SURFACES
51
In order to gain larger adaptiveness in the space of possible triangulations, and reduce considerably the storage size, our scheme introduces a cluster-forest of binary trees instead of the DAG. Each node in this forest represents a new ball as the parent of the two balls being clustered. The triangulation is updated during runtime while traversing the trees and inserting/removing balls. In this scheme, a vertex is considered dependent only if it satisfies the first two conditions of the above definition, hence the number of dependencies are much smaller and the space of possible triangulations is larger. In both hierarchies, to guarantee a broad structure, edges outside the zero-shape are considered if a predefined minimum percent of the vertices are not removed (very rare in practice). An outline of the algorithm for building the hierarchy is as follows: let T be the triangulation let Z be the zero-shape let H be a min heap of zero edges loop until coarse enough: insert all Z edges to H while H is not empty do: remove minimal e = (u, v) from H check that u and v are non-dependent cluster u and v to w: remove u from T and correct remove v from T and correct insert w to T and correct update Z update H
The supporting structures for this algorithm are the triangulation, the zero-shape, and the heap of zero edges. After each decimation step, the triangulation is changed, which induces a change in the zero shape. Some zero edges could be gone, and new zero edges can be created. This means the heap needs to be updated after each decimation step. Also, in order to maintain an independent set in each level, vertices are marked as dependent (and in the case of the DAG, also their neighbors).
2.6.4 Error Estimates While we use the zero-shape to guide the decimation process, it is important to have a bound on the geometric error while decimating, and during traversal of the hierarchy. The first type of error metric that we consider is just the length of the edge. In order not to be dependent on the radii of the atoms, we actually use the Euclidean distance between the vertices to represent the priority. Hence, we are looking at all atoms which overlap and cluster the closest ones first. However, since we are interested in the union of balls and not the actual zero shape, the second error metric we use involves the difference in area between the new ball and the two old balls. The larger this area is the more likely the shape will change drastically if this clustering is used. The last error metric actually computes the exact Hausdorff distance between the boundary of the two old balls and the new one. The Hausdorff distance function is defined as: Definition 2.6.7. (One Way Hausdorff Distance). Given two molecular shapes M1 , M2 and a point-point distance function (norm) d(p, q), the one-way Hausdorff distance h(M1 , M2 ) is the maximum of the minimum point-point distance function d(p, q) for all p in M1 and q in M2 : h(M1 , M2 ) = max { min d(p, q)} . p∈M1 q∈M2
Definition 2.6.8. (Hausdorff Distance). The Hausdorff distance between two molecular shapes H(M1 , M2 ) is the maximum between the two one-way Hausdorff distance functions: H(M1 , M2 ) = max{h(M1 , M2 ), h(M2 , M1 )} . By definition 2.6.1 of the relation “≻” we have immediately that: Property 2. M1 is a coarse representation of M2 if and only if the one-way Hausdorff distance of M2 from M1 is zero: M1 ≻ M2 ⇔ h(M2 , M1 ) = 0 . Property 3. If M1 is a coarse representation of M2 , then the Hausdorff distance between M1 and M2 is equal to the one-way Hausdorff distance of M1 from M2 : M1 ≻ M2 ⇒ H(M1 , M2 ) ≡ h(M1 , M2 ) .
CHAPTER 2. SPATIAL OCCUPANCY
52
We determine a conservative estimate of the Hausdorff distance H(M1 , M2 ) by computing the one-way Hausdorff distance between two adjacent levels in a Local Vertex Clustering step as follows.
(a)
(b)
Figure 2.34: The one-way Hausdorff distance between b3 and b1 ∪b2 is determined at the point p of intersubsection between ∂ b3 and the Voronoi separator between b1 and b2 . (a) Configuration of b1 ∩ b2 6= 0/ where l > 0 (note that in such 2D subsection of the balls, the Voronoi separator has a secondary closed curve inside the two circles that is not of our interest). (b) Configuration for b1 ∩ b2 = 0/ where l < 0. Consider two balls b1 , b2 of radii r1 , r2 > 0 and whose centers c1 , c2 are distance kc1 − c2 k = r1 + r2 − 2l apart (see Figure 2.34). We assume that neither b1 ⊆ b2 nor b2 ⊆ b1 , which implies l < min{r1 , r2 } or l > max{r1 , r2 }. Without loss of generality we place the centers of the two circles around the origin along the x axis so that their centers have coordinates c1 = (−r1 + l, 0) and c2 = (r2 − l, 0). The LVC ball b3 then has center c3 = (r2 − r1 , 0) and radius r1 + r2 − l. The point p where we can evaluate the distance H(b1 ∪ b2 , b3 ) is the intersubsection between the boundary of b3 and the Voronoi separator of b1 and b2 . It is hence given by the solution of the following system: (x − r2 + r1 )2 + y2 = (r1 + r2 − l)2 p 2 2 (x + r1 − pl) + y − r1 = (x − r2 + l)2 + y2 − r2 This has a closed form solution that can be readily derived from: 2 2 (r1 + r2 − 2l) x 2 2 + 2(r1 − r2 )[(r1 − l) + (r2 −2 l) ]x − (2r1 − l)(2r2 − l)(r1 − r2 ) = 0 y = ±[−x2 + 2(r2 − r1 )x + (r1 + r2 − l)2 − (r1 − r2 )2 ]1/2 .
Error of MVC Using the Minimal Vertex Clustering decimation we can achieve a tighter encapsulation between each level of resolution and the input model. This makes it more difficult to compute the error bound as we cannot simply accumulate the error bounds from level to level. This is because each level of resolution contains the input model but not the immediately finer approximation. This means that we have to compare each ball at the current level of approximation with the contained balls in the finest level of resolution, requiring the evaluation of the error function at several vertices of the actual Voronoi diagram (the real Voronoi diagram and not the Power diagram) and at the intersubsection between the Voronoi diagram and the cluster ball. Fortunately it can be shown (see Appendix 2.6.6 for details) that the square root of the norm of the Power distance can be used as an upper bound of the actual Euclidean distance so that we can use the Power diagram in place of the real Voronoi diagram. This makes such computation viable in practice because we have to compute the Power diagram and hence this error estimate does not substantially increase the complexity of the computation.
2.6. CLUSTERING AND DECIMATION OF MOLECULAR SURFACES
53
2.6.5 Analysis Hierarchy Construction. We first consider the case of LVC where the entire hierarchy is constructed by a sequence of vertex insertion steps. Each insertion can make at least two vertices in the previous level of resolution redundant or irrelevant. Redundant means they are removed from the triangulation by the flipping sequence. Irrelevant means they do not contribute to the boundary of the molecular shape any more and hence are not considered in the following decimation steps. Therefore, the complexity of the molecular shape decreases by at least one ball per decimation step so that for an initial shape based on n balls, the hierarchy is constructed with a sequence of less than n LVC steps. In other words the complexity of constructing the initial fine resolution mesh and the complexity of constructing the entire hierarchy are the same. If d is the dimension of the embedding space, then the complexity is O(n log n + n⌊d/2⌋) (or O(n log n + n⌈d/2⌉) if appropriate randomization applies) [38] since it is at most the triangulation time for 2n points. Note that the logarithmic factor introduced by the using a priority queue in the decimation does not increase the overall complexity. If MVC decimation is used the only difference is that instead of just inserting a vertex, each decimation step involves the insertion of one ball and the removal of two, which means a factor of three is added. Traversal As mentioned previously we consider two possible options: (a) explicit storage in the hierarchy of the sequence of flips performed during the decimation or (b) reduction of the hierarchy to a tree of balls. In the first case the storage size is O(n⌊d/2⌋ ) (which reduces to expected O(n⌈d/2⌉ ) in the randomized case), this being the order of the total number of d-simplices in the triangulation as well as the total number of flip operations performed during the construction of the hierarchy. In the second case, the storage size remains linear in any dimension, since it is only a balanced tree of 2n nodes in the worst case. The complexity of the traversal needed to transform the mesh from one cut of the hierarchy to another is proportional to the number of flips it takes to perform the transition, which is proportional to the number of simplices that are being replaced in the initial and final triangulations. In particular if k d-simplices are being created in the new cut then the transition time is O(k). The constant that is hidden in the O(k) depends on the kind of hierarchy that is used. For a full DAG representation the constant is very small since the new triangulation is just read from the DAG. In the case of a tree hierarchy the constant is large since each flip operation involves the determination of Delaunay conditions that are equivalent to computation of (d + 1) × (d + 1) determinants. Using for example Gaussian elimination for the determinant evaluation, it would make the overall complexity O(d 3 k). Note that in this case the space of possible adaptive triangulations corresponding to cuts of the tree hierarchy is much larger than in the case of the DAG hierarchy because one is not constrained by neighboring dependencies between the prerecorded sequences of flips.
2.6.6 Examples The method was tested on both artificial shapes and 2D projections of real molecules (see Figure 2.35). The hierarchies built would be different mainly in the order of decimation steps, and differences would be mostly local in nature. As can be seen in the examples, the desired behavior of preserving as much as possible the structure of the shape while decimating is met.
CHAPTER 2. SPATIAL OCCUPANCY
54
(a) 315
(b) 149
(c) 71
(d) 45
(e) 24
(f) 15
(a) 303
(b) 144
(c) 73
(d) 33
(e) 14
(f) 6
(a) 79
(b) 45
(c) 31
(d) 25
(e) 16
(f) 5
(a) 318
(b) 80
(c) 33
(d) 21
(e) 15
(f) 3
(a) 318
(b) 147
(c) 83
(d) 37
(e) 14
(f) 5
Figure 2.35: Multiresolution molecular shapes. The images show the boundary of the union of balls and the zero α -shape. The numbers denote the number of balls in each resolution. Rows 1-3 are artificial examples demonstrating how the topological structure is followed during decimation. The asymmetry in the spirals shape is a result of the pair-wise clustering. Rows 4 and 5 are two different parallel projections of the gramicidin molecule. There is a large amount of overlapping balls due to the projection, which accounts for the rapid drop in the number of balls at the first stages of decimation with small error.
Related Work Union of Balls using Voronoi-Cell Complexes Several different approaches have been developed to achieve this efficiency for molecular surface computations [27, 70, 71, 72, 75, 77]. Other work on surface representations features the use of metaballs, molecular surfaces, and blobby models [1, 20, 80, 31, 44, 47, 52, 60, 63, 64, 81, 82, 83]. In previous work on dynamic triangulations the focus has been mostly on the simpler Delaunay/Voronoi structures (unweighted case) [6, 53, 24, 43, 48, 2, 67, 68]. Little has been done on the more general case of dynamic Regular Triangulation/Power Diagrams and for dimensions greater than two. Moreover, the kinds of dynamic operations developed are usually
2.6. CLUSTERING AND DECIMATION OF MOLECULAR SURFACES
55
just the insertion/deletion of a single point. Such local operations become inefficient when we need to perform even a simple but global modification.
Molecular Surface Computation using Adaptive Grids Since Richards introduced the SES definition, a number of techniques have been devised to compute the surface, both static and dynamic, implicit and explicit. Connolly introduced two algorithms to compute the surface. First, a dot based numerical surface construction and second, an enumeration of the patches that make up the analytical surface (See [27], [26] and his PhD thesis). In [77], the authors describe a distance function grid for computing surfaces of varying probe radii. Our data structure contains approaches similar to their idea. A number of algorithms were presented using the intersection information given by voronoi diagrams and the alpha shapes introduced by Edelsbrunner [37], including parallel algorithms in [75] and a triangulation scheme in [1]. Fast computations of SES is described in [71] and [70], using Reduced sets, which contains points where the probe is in contact with three atoms, and faces and edges connecting such points. Non Uniform Rational BSplines ( NURBs ) descriptions for the patches of the molecular surfaces are given in [11], [10] and [12]. You and Bashford in [84] defined a grid based algorithm to compute a set of volume elements which make up the Solvent Accessible Region.
Maintaining Union of Balls Under Atom Movements Though a number of techniques have been devised for the static construction of molecular surfaces (e.g., [27, 26, 77, 37, 75, 1, 71, 70, 84, 46, 11, 10, 85, 16]), not much work has been done on neighborhood data structures for the dynamic maintenance of molecular surfaces as needed in MD. In [12] Bajaj et al. considered limited dynamic maintenance of molecular surfaces based on Non Uniform Rational BSplines ( NURBS ) descriptions for the patches. Eyal and Halperin [39, 40] presented an algorithm based � on dynamic graph connectivity that updates the union of balls molecular surface after a conformational change in O log2 n amortized time per affected (by this change) atom.
Clustering and Decimation of Molecular Surfaces
Using multiresolution models for molecules can substantially improve rendering speed and interactive response rates in molecular interaction tools. Similar improvements in performance would be achieved when a set of balls is used as an approximate representation of a generic object either for modeling (meta-balls [47, 64], blobby models [83]) or for collision detection [52]. Direct application of previous approaches for the decimation and multiresolution representation of the surfaces themselves [71, 56] can have serious embedding and self-intersection problems and are specific to the surface definition. A possible solution if this problem has been addressed in [74] but limited to the case of the boundary surface of tetrahedral meshes. Our multiresolution scheme updates the underlying structure of the molecule, maintaining at any level of detail a regular triangulation of the current weighted point-set. In this way we explicitly track the topology of the molecular body at any adaptive level of resolution. Moreover this guarantees correct embedding in all resolutions and creates an approximation from which the surface boundary can be computed in any of the previous schemes. There are many approaches for creating multiresolution representations of geometric data for graphics and visualization [69, 59, 54]. They vary in both the simplification scheme like vertex removal [28], edge contraction [50], triangle contraction [45], vertex clustering [73], wavelet analysis [32], and also in the structure used to organize the levels of detail (either a linear order or a using a DAG). Maintaining the regular triangulation at all resolutions rules out the possibility of using decimation techniques like edge or triangle contraction, which do not guarantee the (weighted) Delaunay property. Other known decimation schemes that can guarantee this property such as vertex removal, do not seem appropriate in this case since they do not preserve the molecule features as a subset of the whole triangulation. Techniques which preserve features in the triangulation by tagging specific edges or vertices [23] are more suitable for preserving specific edges or regions. We are more interested in applying the decimation on a subset of the triangulation while this subset can change during the decimation. Sphere trees have also been used in [51] for the purpose of fast collision detection. In this work, Sphere hierarchies are built around a given object either by replacing special octree regions or by placing balls on the medial-axis surfaces approximated using voronoi edges of some point sampling of the object. The basic approach of building the hierarchy by clustering pairs of balls for collision detection [52] is similar to ours. However in this scheme the simplification process does not update the underlying triangulation and hence does not track the topological changes induced by the decimation process. This make also the scheme unable to cluster balls that get in contact only after some simplification steps.
CHAPTER 2. SPATIAL OCCUPANCY
56
Relevant Mathematics Voronoi-Delaunay Diagram For a finite set of points P in R3 , the Voronoi cell of p ∈ P is Vp = {x ∈ R3 : ∀q ∈ P − {p}, kx − pk ≤ kx − qk)}. If the points are in general position, two Voronoi cells with non-empty intersection meet along a planar, convex Voronoi facet, three Voronoi cells with non-empty intersection meet along a common Voronoi edge and four Voronoi cells with non-empty intersection meet at a Voronoi vertex. A cell decomposition consisting of the Voronoi objects, that is, Voronoi cells, facets, edges and vertices is the Voronoi diagram Vor P of the point set P. The dual of Vor P is the Delaunay diagram Del P of P which is a simplicial complex when the points are in general position. The tetrahedra are dual to the Voronoi vertices, the triangles are dual to the Voronoi edges, the edges are dual to the Voronoi facets and the vertices (sample points from P) are dual to the Voronoi cells. We also refer to the Delaunay simplices as Delaunay objects.
Euclidean VS Power distance. For MVC the choice of using the Power distance in place of the Euclidean distance is motivated by the the efficiency and simplicity of the construction of the power diagram together with the fact that the power distance can be proven to be an upper bound of the Euclidean distance.
(a)
(b)
Figure 2.36: Relationship between the Euclidean distance E(p, B) between the point p and the ball B and their Power distance P(p, B), (a) Configuration for d > r. (b) Configuration for d < r. Consider a point p at distance d from the center c a ball B of radius r as in Figure 2.36. We define: q E(p, B) = |d − r| , P(p, B) = |d 2 − r2 | .
Then we have the following chain of inequalities (where r and d are positive numbers): 0 ≤ 4dr(d − r)2 = 4d 3 r − 8d 2 r2 + 4dr3 (d − r)4 = d 4 − 4d 3r + 6d 2 r2 − 4dr3 + r4 d 4 − 2d 2r2 + r4 = (d 2 − r2 )2 q E(p, B) = |d − r| ≤ |d 2 − r2 | = P(p, B) . ≤
2.6. CLUSTERING AND DECIMATION OF MOLECULAR SURFACES
57
In conclusion we have that for any given ball B and point p, the function P(p, B) provides an upper bound on the distance E(p, b): E(p, B) ≤ P(p, B) , (6.28) with equality holding only when d = r, i. e. the point is on the surface of the ball (and in trivial cases where d or r is zero). For a collection of n balls B = {B1 , . . . , Bn } the distance functions are extended as follows: E(p, B) = min |di − ri |
(6.29)
1≤i≤n
P(p, B) =
r
min |di2 − ri2 |
(6.30)
1≤i≤n
The problem in comparing E(p, B) with P(p, B) is that they may achieve their minimum for different values of i because in general the Power diagram is not coincident with the Voronoi diagram. Figure 2.6.6 shows an example of comparison between the Voronoi diagram of two circles (in red) with the corresponding Power diagram (in blue). In this example the minimum distance of the point p from the set B = {B1 , B2 } is achieved at i = 1 for P(p, B) and at i = 2 for E(p, B): P(p, B) = P(p, B1 ) E(p, B) = E(p, B2 ) . In general for a given point p we call iP , iE the two indices such that: P(p, B) = P(p, BiP ) E(p, B) = E(p, BiE ) . From equations (6.29) and (6.28) we have that: E(p, B) = ≤
(a)
E(p, BiE ) ≤ E(p, BiP ) P(p, BiP ) = P(p, B) .
(b)
Figure 2.37: Power diagram (in blue) and Voronoi diagram (in red) of two circles. (a) Case of nonintersecting circles. (b) Case of intersecting circles.
CHAPTER 2. SPATIAL OCCUPANCY
58
(a)
(b)
(c)
(d)
(e)
(f)
Figure 2.38: The combinatorial and geometric structures underlying a molecular shape: (a) The collection of balls (weighted points). (b) Power diagram of a set of the points. (c) Regular triangulation. (d) The α -shape (with α = 0) of the points. (e) Partitioning of the molecular body induced by the power diagram. (f) The boundary of the molecular body.
Power Diagram Given a weighted point P = (p, w p ) where p ∈ IRn and w ∈ IR, the power distance from a point x ∈ IRn to P is defined as
πP (x) =
q kp − xk2 − w p ,
where kp − xk is the ordinary Euclidean distance between p and x. In molecule context, we define the weight of an atom B with center at p and radius r to be wB = r2 . The power distance of x to B is q πB (x) = kp − xk2 − r2 . Given a set {Pi } of weighted vertices (each vertex has a weight wi associated with it), the Power Diagram is a tiling of the space into convex regions where the ith tile is the set of points nearest to the vertex Pi , in the power distance metric [4]. The power diagram is similar to the Voronoi diagram using the power distance instead of Euclidean distance. The weighted Voronoi cell of a ball B in a molecule B is the set of points in space whose weighted distance to B is less than or equal to their weighted distance to any other ball in B [36]: VB = {x ∈ IR2 |πB (x) ≤ πC (x) ∀C ∈ B} . The power diagram of a molecule is the union of the weighted Voronoi cells for each of its atoms (Figure 2.38(b)).
Regular Triangulation The regular triangulation, or weighted Delaunay triangulation, is the dual (face adjacency graph) of the power diagram, just as the Delaunay triangulation is the dual shape of the Voronoi diagram. Vertices in the triangulation are connected if and only if their corresponding weighted Voronoi cells have a common face (Figure 2.38(c)). This implies that two vertices are connected if and only if they have a nearest neighbor relation measured in power distance metric Given a set of n 2D points with weights, it has been shown [38], that their regular triangulation can be computed in O(n log n) time, by incrementally inserting new points to the existing triangulation and correcting it using edge flips.
Weighted Alpha Shapes A simplex s in the regular triangulation of {Pi } belongs to the α -shape of {Pi } only if the orthogonal center of (the weighted point orthogonal to the vertices of) s is smaller than α (see [34] for the complete condition). The alpha shape where α = 0, called the zero-shape, is the topological structure of molecules [41]. For example, an edge e = (u, v) is a part of the zero-shape only if ku − vk2 − wu − wv < 0, which means that the two balls centered at u and v intersect (Figure 2.38(d)).
2.6. CLUSTERING AND DECIMATION OF MOLECULAR SURFACES
59
Adaptive grid, Oct-tree and k-d tree B-splines and B-patches A-splines and A-patches An A-patch of degree n over the tetrahedron [∂1 ∂2 ∂3 ∂4 ] is defined by Gn (x, y, z) := Fn (α ) = Fn (α1 , α2 , α3 , α4 ) = 0, where
Fn (α1 , α2 , α3 , α4 ) =
∑
(6.31)
ai jkl Bnijkl (α1 , α2 , α3 , α4 ),
(6.32)
i+ j+k+l=n
Bnijkl (α1 , α2 , α3 , α4 ) = and (x, y, z)T and (α1 , α2 , α3 , α4 )T are related by x � y = ∂1 z 1 1
∂2 1
n! α i α j α kα l , i! j!k!l! 1 2 3 4
∂3 1
∂4 1
�
α1 α2 α3 . α4
(6.33)
Control points computation for trimmed NURBS patches In this appendix we explain the computation of the NURBS control points. The approach we take is to compute the control points once for all molecule atoms. That is each atom will be represented by its specific domain D in (u, v) space and the same set of normalized control points that represent the unitary sphere with center in the origin. Then we apply an affine transformation to map the unitary sphere to the position taken by the atom. To have a unique base set of control points (defining a portion of the normalized sphere) that can represent any atom we need to be sure that for each ball B in B there is at least a ¯ that intersects B for the smallest portion. This is because we wish to compute the control points of a portion of neighbor ball B, sphere which is a (bounded) rectangular domain and a minimum superset of any domain D of any atom. Fortunately this condition is satisfied for all molecules. For example in the ball and stick representation used in Raster3D [5, 61] a bond (stick) is drawn between to atoms of radii r1 , r2 if the distance r between the centers of the two atoms is less than 0.6(r1 + r2 ). Since in a molecule there is at least one bond per atom we have that for each atom there is at least a neighbor atom ◦
◦
for which r < 0.6(r1 + r2 ). If we also consider that minimum atom size in a molecule is 1.3 A and the maximum is 2.18 A we have that each atom is intersected by a neighbor atom for at least 0.15477% of its radius. This means that, with reference to equation (2.2) we can always assume to have d ≤ 0.84523 that is l ≤ 3.45288299571568. For this fixed value of l we apply a change of polynomial basis to get the coordinates (x, y, z) of one quarter of the control points (and relative weight w) as in the table below. The other control points are just computed mirroring these twice with respect to the x and y axis. The knots vectors are u : [−1 − 1 − 100111] v : [−1 − 1 − 100111].
CHAPTER 2. SPATIAL OCCUPANCY
60
P1 P2 P3 P4 P5 P6 P7 P8 P9
x 0 0 0 1 1 1 2 2 2
y 0 1 2 0 1 2 0 1 2
z w −1 1 −1 1 0 2 −1 1 −1 1 0 2 0 2 0 2 1 3
Figure 2.39: Control point computation
BIBLIOGRAPHY
61
Bibliography [1] N. Akkiraju and H. Edelsbrunner. Triangulating the surface of a molecule. Discrete Applied Mathematics, 71(1-3):5–22, 1996. [2] G. Albers and T. Roos. Voronoi diagrams of moving points in higher dimensional spaces. In Proc. 3rd Scand. Workshop Algorithm Theory, volume 621 of Lecture Notes in Computer Science, pages 399–409. Springer-Verlag, 1992. [3] J. Arvo. A simple method for box-sphere intersection testing. pages 335–339, 1990. [4] F. Aurenhammer. Voronoi diagrams: A survey of a fundamental geometric data structure. ACM Computing Surveys, 23:345–405, 1991. [5] D. J. Bacon and W. F. Anderson. A fast algorithm for rendering space-filling molecule pictures. Journal of Molecular Graphics, 6:219–220, 1988. [6] C. Bajaj and W. J. Bouma. Dynamic Voronoi diagrams and Delaunay triangulations. In Proceedings of the 2nd Canadian Conference on Computational Geometry, pages 273–277, 1990. [7] C. Bajaj, R. Chowdhury, and M. Rasheed. A dynamic data structure for flexible molecular maintenance and informatics. Technical Report TR-10-31, ICES, Univ. of Texas at Austin, July 2010. [8] C. Bajaj, R. A. Chowdhury, and M. Rasheed. A dynamic data structure for flexible molecular maintenance and informatics. In SPM ’09: 2009 SIAM/ACM Joint Conference on Geometric and Physical Modeling, pages 259–270, New York, NY, USA, 2009. ACM. [9] C. Bajaj and M. Kim. Generation of configuration space obstacles: The case of moving algebraic curves. Algoritmica, 4:157–172, 1989. [10] C. Bajaj, H. Y. Lee, R. Merkert, and V. Pascucci. NURBS based B-rep models for macromolecules and their properties. In Proceedings of the 4th ACM Symposium on Solid Modeling and Applications, pages 217–228, New York, NY, USA, 1997. ACM. [11] C. Bajaj, V. Pascucci, A. Shamir, R. Holt, and A. Netravali. Multiresolution molecular shapes. Technical report, TICAM, Univ. of Texas at Austin, Dec. 1999. [12] C. Bajaj, V. Pascucci, A. Shamir, R. Holt, and A. Netravali. Dynamic maintenance and visualization of molecular surfaces. Discrete Applied Mathematics, 127(1):23–51, 2003. [13] C. Bajaj and A. Royappa. Finite representations of real parametric curves and surfaces. International Journal of Computational Geometry Applications, 5(3):313–326, 1995. [14] C. Bajaj and V. Siddavanahalli. Fast error-bounded surfaces and derivatives computation for volumetric particle data. ICES Tech Report 06-03, U.T. Austin, 2006. [15] C. Bajaj, G. Xu, R. Holt, and A. Netravali. NURBS approximation of a-splines and a-patches. International Journal of Computational Geometry and Applications, 13(5):359–389, November 2003. [16] C. Bajaj, G. Xu, and Q. Zhang. A fast variational method for the construction of resolution adaptive c2 -smooth molecular surfaces. Computer Methods in Applied Mechanics and Engineering, 198(21-26):1684–1690, 2009. [17] C. L. Bajaj and V. Pascucci. Splitting a complex of convex polytopes in any dimension. In Proceedings of the Twelfth Annual Symposium On Computational Geometry (ISG ’96), pages 88–97, May 1996. [18] C. L. Bajaj and V. Pascucci. Wrapping the Voronoi diagram: A constructive approach to duality. Technical report, University of Texas at Austin, 1997. [19] S. Batsanov. Van der Waals radii of elements. Inorganic Materials, 37:871–885(15), September 2001. [20] J. F. Blinn. A generalization of algebraic surface drawing. ACM Transactions on Graphics, 1(3):235–256, July 1982. [21] T. M. Y. Chan, J. Snoeyink, and C. K. Yap. Output-sensitive construction of polytopes in four dimensions and clipped Voronoi diagrams in three. In Proceedings of the Sixth Annual ACM-SIAM Symposium on Discrete Algorithms, pages 282–291, San Francisco, California, January 1995. [22] B. Chazelle. An optimal convex hull algorithm in any fixed dimension. Discrete & Computational Geometry, 10:377–409, 1993. [23] L. P. Chew. Constrained Delaunay triangulations. In Proc. 3rd Annual ACM Symposium Computational Geometry, pages 215–222, 1987. [24] P. Chew. Near-quadratic bounds for the L1 Voronoi diagram of moving points. Computational Geometry Theory and Applications, 7, 1997. [25] K. L. Clarkson, H. Edelsbrunner, L. J. Guibas, M. Sharir, and M. Welzl. Combinatorial complexity bounds for arrangements of curves and spheres. Discrete Computational Geometry, 5(2):99–160, 1990. [26] M. Connolly. Solvent-accessible surfaces of proteins and nucleic acids. Science, 221(4612):709–713, 19 August 1983.
62
BIBLIOGRAPHY
[27] M. L. Connolly. Analytical molecular surface calculation. Journal of Applied Crystallography, 16:548–558, 1983. [28] M. de Berg and K. T. G. Dobrindt. On levels of detail in terrains. Graphical Models and Image Processing, 60:1–12, 1998. [29] L. De Floriani. A pyramidal data structure for triangle-based surface description. IEEE Computer Graphics and Applications, 9(2):67–78, March 1989. [30] C. J. A. Delfinado and H. Edelsbrunner. An incremental algorithm for Betti numbers of simplicial complexes on the 3-sphere. Computer Aided Geometric Design, 12(7):771–784, 1995. [31] M. Desbrun and M. Gascuel. Animating soft substances with implicit surfaces. In R. Cook, editor, SIGGRAPH 95 Conference Proceedings, Annual Conference Series, pages 287–290, Los Angeles, August 1995. Addison Wesley. [32] M. Eck, T. DeRose, T. Duchamp, T. Hoppe, H. Lounsbery, and W. Stuetzle. Multiresolution analysis of arbitrary meshes. In ACM Computer Graphics Proceedings, SIGGRAPH’95, pages 173–180, 1995. [33] H. Edelsbrunner. Algorithms in Combinatorial Geometry, volume 10 of EATCS Monographs on Theoretical Computer Science. Springer-Verlag, Heidelberg, West Germany, 1987. [34] H. Edelsbrunner. Weighted alpha shapes. Technical Report 1760, University of Illinois at Urbana-Champaign, 1992. [35] H. Edelsbrunner. The union of balls and its dual shape. Discrete Computational Geometry, 13(3-4):415–440, 1995. [36] H. Edelsbrunner, M. Facello, and J. Liang. On the definition and the construction of pockets in macromolecules. Tech Report UIUCDCS-R-95-1935, University of Illinois Urbana-Champaign, 1995. [37] H. Edelsbrunner and E. P. Mücke. Three-dimensional alpha shapes. ACM Transactions on Graphics, 13(1):43–72, 1994. [38] H. Edelsbrunner and N. R. Shah. Incremental topological flipping works for regular triangulations. Algorithmica, 15:223– 241, 1996. [39] E. Eyal and D. Halperin. Dynamic maintenance of molecular surfaces under conformational changes. In SCG ’05: Proceedings of the 21st Annual Symposium on Computational Geometry, pages 45–54, 2005. [40] E. Eyal and D. Halperin. Improved maintenance of molecular surfaces using dynamic graph connectivity. Algorithms in Bioinformatics, pages 401–413, 2005. [41] M. A. Facello. Geometric Techniques for Molecular Shape Analysis. PhD thesis, University of Illinois, 1996. Department of Computer Science Technical Report # 1967. [42] M. L. Fredman and D. E. Willard. Surpassing the information theoretic bound with fusion trees. Journal of Computer and System Sciences, 47(3):424–436, 1993. [43] J. J. Fu and R. C. T. Lee. Voronoi diagrams of moving points in the plane. International Journal of Computational Geometry Applications, 1(1):23–32, 1991. [44] T. Fujita, K. Hirota, and K. Murakami. Representation of splashing water using metaball model. Fujitsu, 41(2):159–165, 1990. in Japanese. [45] T. S. Gieng, B. Hamann, K. I. Joy, G. L. Schussman, and I. J. Trotts. Constructing hierarchies for triangle meshes. IEEE Transactions on Visualization and Computer Graphics, 4(2):145–161, 1998. [46] J. Grant and B. Pickup. A gaussian description of molecular shape. Journal of Physical Chemistry, 99:3503–3510, 1995. [47] G. Graves. The magic of metaballs. Computer Graphics World, 16(5):27–32, 1993. [48] L. Guibas, J. S. B. Mitchell, and T. Roos. Voronoi diagrams of moving points in the plane. In Proceedings of the 17th Internatational Workshop on Graph-Theoretical Concepts in Computer Science, volume 570 of Lecture Notes in Computer Science, pages 113–125. Springer-Verlag, 1991. [49] D. Halperin and M. H. Overmars. Spheres, molecules, and hidden surface removal. In SCG ’94: Proceedings of the 10th Annual Symposium on Computational Geometry, pages 113–122, 1994. [50] H. Hoppe. Progressive meshes. In ACM Computer Graphics Proceedings, SIGGRAPH’96, pages 99–108, 1996. [51] P. H. Hubbard. Collision Detection for Interactive Graphics Applications. PhD thesis, Department of Computer Science, Brown University, Providence, Rhode Island, April 1995. [52] P. M. Hubbard. Approximating polyhedra with spheres for time-critical collision detection. ACM Transactions on Graphics, 15(3), 1996. [53] H. Imai, M. Iri, and K. Murota. Voronoi diagram in the laguerre geometry and its applications. SIAM J. Comput., 14:93–10, 1985. [54] R. Klein and J. Kramer. Multiresolution representations for surface meshes. In Proceedings of the SCCG, 1997. [55] S. Krishnan, D. Manocha, and A. Narkhede. Representation and evaluation of boolean combinations of NURBS solids. In Fifth MSI-Stony Brook Workshop on Computational Geometry, Stony Brook, October 1995. [56] S. Kumar, D. Manocha, and A. Lastra. Interactive display of large-scale NURBS models. IEEE Transactions on Visualization and Computer Graphics, 2(4):323–336, 1996.
BIBLIOGRAPHY
63
[57] B. Lee and F. Richards. The interpretation of protein structures: estimation of static accessibility. Journal of Molecular Biology, 55(3):379–400, February 1971. [58] P. Magillo. Spatial Operations for Multiresolution Cell Complexes. PhD thesis, Universitá di Genova, 1998. Dipartimento di Informatica e Scienze dell’Informazione. [59] A. Maheshwari, P. Morin, and J. R. Sack. Progressive tins: Algorithms and applications. In Proceedings 5th ACM Workshop on Advances in Geographic Information Systems, Las Vegas, 1997. [60] N. L. Max. Computer representation of molecular surfaces. IEEE Computer Graphics and Applications, 3(5):21–29, August 1983. [61] E. A. Merritt and M. E. P. Murphy. Raster3d version 2.0: A program for photorealistic molecular graphics. Acta Cryst., D50:869–873, 1994. [62] C. W. Mortensen, R. Pagh, and M. Pˇatraçcu. On dynamic range reporting in one dimension. In STOC ’05: Proceedings of the 37th Annual ACM Symposium on Theory of Computing, pages 104–111, 2005. [63] H. Nishimura, M. Hirai, T. Kawai, T. Kawata, I. Shirakawa, and K. Omura. Object modeling by distribution function and a method of image generation. Transactions IECE Japan, Part D, J68-D(4):718–725, 1985. [64] T. Nishita and E. Nakamae. A method for displaying metaballs by using Bézier clipping. In Computer Graphics Forum, volume 13, pages 271–280. Eurographics, Basil Blackwell Ltd, 1994. Eurographics ’94 Conference issue. [65] L. Piegl and W. Tiller. Curve and surface construction using rational b-splines. Computer-Aided Design, 19(9):485–498, 1987. [66] F. Richards. Areas, volumes, packing, and protein structure. Annual Review of Biophysics and Bioengineering, 6:151–176, June 1977. [67] T. Roos. Vorono˘ı diagrams over dynamic scenes. Discrete Applied Mathematics. Combinatorial Algorithms, Optimization and Computer Science, 43(3):243–259, 1993. [68] T. Roos. New upper bounds on Voronoi diagrams of moving points. Nordic Journal of Computing, 4(2):167–171, 1997. [69] J. Rossignac and P. Borrel. Multi-resolution 3d approximation for rendering complex scenes. In B. Falcidieno and T. Kunii, editors, Geometric Modeling in Computer Graphics, pages 455–465. Springer-Verlag, 1993. [70] M. Sanner, A. Olson, and J. Spehner. Fast and robust computation of molecular surfaces. In Proceedings of the eleventh annual symposium on Computational geometry, pages 406–407. ACM Press, 1995. [71] M. Sanner, A. Olson, and J. Spehner. Reduced surface: an efficient way to compute molecular surfaces. Biopolymers, 38(3):305–320, March 1996. [72] M. F. Sanner and A. J. Olson. Real time surface reconstruction for moving molecular fragments. In Proceedings of the Pacific Symposium on Biocomputing ’97, Maui, Hawaii, January 1997. [73] W. J. Schroeder. A topology modifying progressive decimation algorithm. In R. Yagel and H. Hagen, editors, IEEE Visualization ’97, pages 205–212. IEEE, nov 1997. [74] O. G. Staadt and M. H. Gross. Progressive tetrahedralizations. In Proceddings of the IEEE Visualization Conference, pages 397–402, 1998. [75] A. Varshney and F. Brooks. Fast analytical computation of richards’s smooth molecular surface. In VIS ’93: Proceedings of the 4th conference on Visualization ’93, pages 300–307, 1993. [76] A. Varshney, F. P. Brooks Jr., and W. V. Wright. Computing smooth molecular surfaces. IEEE Computer Graphics Applications, 14(5):19–25, 1994. [77] R. Voorintholt, M. T. Kosters, G. Vegter, G. Vriend, and W. G. Hol. A very fast program for visualizing protein surfaces, channels and cavities. Journal of Molecular Graphics, 7(4):243–245, December 1989. [78] E. Welzl. Smallest enclosing disks (balls and ellipsoids). In H. Maurer, editor, New Results and New Trends in Computer Science, number 555 in Lecture Notes in Computer Science, pages 359–370. Springer, 1991. [79] D. White. Enclosing ball software library. Source code available at http://vision.ucsd.edu/˜dwhite/ball.html. [80] J. B. with C. Bajaj, J. Blinn, M.-P. Cani-Gascuel, A. Rockwood, B. Wyvill, and G. Wyvill, editors. Introduction to Implicit Surfaces. Morgan Kaufmann Publishers, San Francisco, 1997. [81] B. Wyvill, C. McPheeters, and G. Wyvill. Animating soft objects. The Visual Computer, 2(4):235–242, 1986. [82] B. Wyvill, C. McPheeters, and G. Wyvill. Data structure for soft objects. The Visual Computer, 2(4):227–234, 1986. [83] S. Yoshimoto. Ballerinas generated by a personal computer. Journal of Visualization and Computer Animation, 3(2):55– 90, 1992. [84] T. You and D. Bashford. An analytical algorithm for the rapid determination of the solvent accessibility of points in a three-dimensional lattice around a solute molecule. Journal of Computational Chemistry, 16(6):743–757, 1995. [85] W. Zhao, G. Xu, and C. Bajaj. An algebraic spline model of molecular surfaces. In SPM ’07: Proceedings of the 2007
BIBLIOGRAPHY
64 ACM symposium on Solid and physical modeling, pages 297–302, 2007.
Appendix A
Molecules A.1
Internal Coordinates
�� ��
��
� ��
��
��
��
�
�
�
� �� ������� �����
�
��
�
�
��� �����
Figure A.1: A polypeptide chain with backbone dihedrals (ψ , φ , ω ) and side-chain dihedrals (χ ) shown. Proteins have a naturally occurring backbone consisting of −NH − C(H)R − CO− sequences, where R is some functional group defined for 20 different amino acids. These functional groups appear as side-chains connected to the backbone. As in all organic molecules, each type of bond formed in a protein conforms to the characteristic bond length and bond angles for that type. Hence, the conformation of a protein can be approximately defined by a set of dihedral angles (or torsional angles) that determine the orientation of different chemical groups along and around the backbone. The following three dihedral angles determine the conformation of the backbone (see Figure A.1).
φi . This is the angle between the planes Ci−1 − Ni − Cαi and Ni − Cαi − Ci′ , i.e., the angle of rotation (−180◦ ≤ φi < +180◦) around the Ni − Cαi bond. A positive change in the φi value occurs by counter-clockwise rotation of the Ci−1 − Ni − Cαi plane around the Ni − Cαi bond. ψi . This is the angle of rotation (−180◦ ≤ ψi < +180◦) around the Cαi − C′ i bond, and is determined by the angle between the Ni − Cαi − C′ i and Cαi − C′ i − Ni+1 planes. 65
APPENDIX A. MOLECULES
66 V
C B E D A @ ?
" # $ %# &
! � � � � TY
T U
45 123
67
L M L NO PM
''()*+
FG H JKII
LQ RS M
'/')0+
=> ;< 89:
X
" " , %& C B @A ?
T U
! � . � �
W
Figure A.2: A peptide plane with all bond lengths and bond angles shown [9]. ′ − N ), and is given by the dihedral angle between the C ωi . This is the angle of rotation around the peptide bond (Ci−1 i αi−1 − ′ ′ Ci−1 − Ni and Ci−1 − Ni − Cαi planes. The partial (40 %) double-bond character of the peptide bond and the steric ′ interactions between adjacent side-chains causes the amide group (Ni , Cαi , Hi , Ci−1 , Oi−1 and Cαi−1 ) to be almost planar with the distance between Cαi−1 and Cαi as large as possible (see Figure A.1 for bond lengths and bond angles on this plane). Therefore, almost always ωi ≈ 180◦ (for trans-peptides), or ωi ≈ 0◦ (for cis-peptides).
More than than 99.9% of all residues (except proline) are trans-peptides, and hence have ωi ≈ 180◦. Approximately 5% of all proline peptide bonds have ωi ≈ 0◦ .
The side chains change conformation through torsional changes in the χi angles.
χi . Depending on the amino acid type of the side chain there can be up to 4 such successive angles per side chain: χi,1 , χi,2 , χi,3 and χi,4 . However, for Glycine side chain which consists of only one hydrogen atom, and Alanine whose side chain is only a single methyl group, these angles are undefined. For all other side chains χi,1 is defined as the dihedral angle between the planes N −Cα −Cβ and Cα −Cβ − X, where X is either Cγ , or Cγ1 (Val, Ile), Oγ (Ser), Oγ1 (Thr), or Sγ (Cys). All side chain dihedrals have values clustered near three conformers known as gauche+ or g+ (+60◦), trans or t (180◦), and gauche− or g− (−60◦). Figure A.3 shows the side-chain dihedrals of all amino acids except Glycine and Alanine. Table A.1 shows that about 90% of all side-chains in proteins can be completely described with three dihedral angles (i.e., χ1,1 , χ1,2 and χ1,3 ), and only two dihedral angles (i.e., χ1,1 and χ1,2 ) are necessary to completely specify more than two-thirds of them. number of dihedrals (d) frequency (%) d≤4 100.00 d≤3 89.48 d≤2 70.64 23.46 d≤1 Table A.1: Amino acid frequencies in proteins based on the number of (side-chain) dihedrals they have (based on data in [26]).
A.2. LEG (LABELLED EMBEDDED GRAPH) REPRESENTATIONS stkquoipn dvfuq wpqxgl wpqxgl [\ Z
defghijfk mnopqrnel mnopqrnel
defghijfkl defghijfkl Z[` Z]
67
Z
Z[` Z]
Z[`
Z[\
Z[
Z[` Z]
Z[`
Z
Z[`
[
Z]
Z[\ Z[`
^[
Z[\
Z]
Z
[\Z
[
a[\_ Z][
^[
Z[\
dkfofk iuo jhtfp dvfot ytpfzijfzt{l ytpfzijfzt{l
Z]
Z[\
Z
_[\
^
^
^
^
Z ^c Z] Z[\
Z]
Z[\
Z
Z[\
_[\
_[\a
Z[\
Z[\
Z[\
_[`a
Z[\
Z]
Z[\
Z[\
Z[\
Z
Z]
Z[\
Z a[_
_[\
Z[ _[
Z [
dpqvijfkl dpqvijfkl
sxe}xp~ sxe}xp~kqujifuful kqujifuful Z[\
[ _
Z]
Z[\
^c
Z
Z[\
Z[\
|i{fkl |i{fkl
Z]
Z]
b
Z[`
Z]
b[
Z[\
¡
Z]
Z[\
Z]
¢
^[
Z[\
£
Z[\
Z [Z
_ [
Z]
¤
Figure A.3: Side-chain dihedrals (χi,1 , χi,2 , χi,3 , χi,4 ) are shown for 18 of the 20 amino acids. The remaining two, i.e., Glycine (Gly) and Alanine (Ala), do not have any side-chain dihedrals. Adapted from [28].
A.2
LEG (Labelled Embedded Graph) Representations
The LEG representation of a molecule is simply an annotated graph representation of the chemical structure of the molecule, in which each node represents an atom and each edge a chemical bond. Each atom may be annotated by its symbol and the vdW radius, each edge may be annotated by the length of the corresponding chemical bond and possibly a dihedral angle, and each pair of consecutive edges by a bond angle. In Figure A.3 we show the chemical structures of various amino acids, and in Tables A.2, A.3 and A.4 we list all possible vdW radii, bond lengths and bond angles, respectively, that appear in these chemical structures. Using these information, it is straight-forward to construct the required LEG representations of the amino acids. Since secondary structures (e.g., α -helices and β -sheets) are composed of primary structures (i.e., amino acids), the LEG representation of secondary structures can also be constructed from the information in Figure A.3 and Tables A.2, A.3 and A.4. However, the (φ , ψ ) dihedral angles of the residues in α -helices and β -sheets lie in fairly restricted ranges: (−45◦, −60◦ ) for α -helices, (−120◦, 115◦ ) for parallel β -sheets, and about (−140◦, 135◦) for anti-parallel β -sheets. The bond lengths and bond angles may also change slightly. We can use geometric properties of α -helices and β -sheets in order to extract them from the LEG representation L of the given protein P. Extracting α -helices from L. We traverse L along the peptide backbone of P, and using the internal coordinates (i.e., bond lengths, bond angles, dihedral angles, etc.), bond types and atom types specified in L, we detect and output all maximal contiguous segments of this backbone (along with side chains) that satisfy the following properties of α -helices. • The amino acids in an α -helix are arranged in a right-handed helical structure with each amino acid corresponding to a 100◦ turn in the helix and a 1.5 Å translation along the helical axis. Thus there are 13 atoms and 3.6 amino acid residues
APPENDIX A. MOLECULES
68 »¼½¾¿À Á½¾ÂÀ ÃÄž¿Æ
¥
¯· ¯¸ ´
´µ
¯³
¯²
ª§«
¹
ª§«®
º
¯± ¯°
¦§
ª§«¬ ª§«§ ¨§
©§
¯¶ ¥
Figure A.4: A Lysine side-chain with side-chain dihedrals (χ1,1 , χ1,2 , χ1,3 , χ1,4 ). per turn, and each turn is 5.4 Å wide (see Figure A.5). • The C=O group of residue i forms a hydrogen bond with the N-H group of residue i + 4. • Amino acid residues in an α -helix typically have dihedral angles φ ≈ −45◦ and ψ ≈ −60◦. Extracting β -sheets from L. We scan the peptide backbone of P given in L, and detect and output all maximal contiguous segments of this backbone (along with side chains) that satisfy the following properties of β -sheets. • Each β -strand can be viewed as a helical structure with two residues per turn. The distance between two such consecutive residues is 3.47 Å in anti-parallel β -sheets and 3.25 Å in parallel β -sheets. • Unlike α -helices the C=O groups in the backbone of a β -strand form hydrogen bonds with the N-H groups in the backbone of adjacent strands. – In parallel β -sheets all N-termini of adjacent strands are oriented in the same direction (see Figure A.7(b)). If the Cα atoms of residues i and j of two different strands are adjacent, they do not hydrogen bond to each other, rather rasidue i may form hydrogen bonds to residues j − 1 or j + 1 of the other strand.
– In anti-parallel β -sheets the N-terminus of one strand is adjacent to the C-terminus of the next strand (see Figure A.7(a)). If a pair of Cα atoms from two successive β -strands are adjacent, then unlike in parallel β -sheets they form hydrogen bonds to each other’s flanking peptide groups.
• The (φ , ψ ) dihedrals are about (−120◦, 115◦) in parallel β -sheets, and about (−140◦, 135◦ ) in anti-parallel β -sheets. • Unlike in α -helices, peptide carbonyl groups in successive residues point in alternating directions.
A.3
FCC (Flexible Chain Complex) Representations
Complex biomolecules have a naturally occurring backbone, forming chains which flex through their torsion angles. This nerve is biochemically well defined, and described by a labeled complex. Structural (shape) and functional properties of a biomolecule
A.3. FCC (FLEXIBLE CHAIN COMPLEX) REPRESENTATIONS
Table A.2: List of van der Waals radii for 25 protein atoms [21].
Table A.3: Bond lengths in proteins [7].
69
APPENDIX A. MOLECULES
70
Table A.4: Bond angles in proteins [7]. can be described as a labeled sheath around the central nerve. This combined representation (Flexible Chain Complex, or FCC) of a nerve and a sheath describe a flexible biomolecule. The nerve of the FCC. The chain complex consists of the following elements. • Vertices: Atom or pseudo atom positions. Atom positions are obtained typically from the PDB files. For pseudo atoms, we use the centers of a set of enclosing spheres which represent the finer level using some error norm like the Hausdorff error. • Edges: Bonds or pseudo bonds. This is again from the PDB or from the hierarchical complex formed by clustering the finer resolutions to a DAG. • Faces: Residues, bases or pseudo structures. These elements are labeled with the following attributes.
A.3. FCC (FLEXIBLE CHAIN COMPLEX) REPRESENTATIONS
Figure A.5: Geometric structure of an α -helix [9].
Figure A.6: Geometric structure of a β -sheet [9].
71
APPENDIX A. MOLECULES
72
Figure A.7: Two types of β -sheets: (a) anti-parallel, and (b) parallel [13].
Figure A.8: Flexible Chain Complex: Combined volume (through hardware accelerated 3D texture mapping based volume rendering) and imposter rendering, showing the chain together with the high density volumetric regions formed by the functional groups protruding outwards from the chain. • Position, length, areas. • Ranges for flexible angles, lengths. • Sub structural markers. • Field attributes. We allow the molecules to flex around their torsion angles as it is widely accepted that bond angles and bond lengths do not have much flexibility. In protein chains, the φ and ψ angle variations are obtained and stored in the complex attributes. For RNA, we have 8 different torsion angles along the backbone. The ranges for these atoms are obtained either from molecular dynamics simulations or from NMR analysis for certain structures. The sheath of the FCC. The surrounding volume, sub volumes and surfaces of a biomolecule are used to represent shape, volumetric properties (like electrostatics, hydrophobicity) and surface properties (like curvatures). These representations enjoy a dual implicit and explicit representation. • Implicit volumetric representation In this representation, we have a vector containing of (a). A set of centers of expansion points, (b) A parameter referred to as the blobbiness parameter which is useful to represent the van der Waals forces in a continuous and hierarchical fashion, and (c), a set of radii. These parameters are necessary and sufficient to define the
A.3. FCC (FLEXIBLE CHAIN COMPLEX) REPRESENTATIONS
(a) Atom level
73
(b) Residue level with a low (c) Residue level with a high Gdropo f f factor Gdropo f f factor
Figure A.9: LOD volume rendering of a large ribosomal subunit (1JJ2.pdb). The parameter Gdropo f f controls the spread of the density around a pseudo atom when blurring the chain complex electron density function of a molecule. For functions like hydrophobicity and electrostatics, charges at each center of expansion is required. • Explicit volumetric representation There are three representations which can be used for explicitly describing a volumetric function. – Simplicial representation: The data is described over a simplex like a surface grid at the vertices. – Tensor product: An explicit grid is used to represent the functions. The size of such a representation can be very large. Hence it is useful to develop compression based algorithms to represent and visualize such a representation. – Multipole summations: Since our data set consists of a set of vertices and functions which are summations of functions defined over this limited set, Multi-Pole type summations can be used efficiently to represent the data sets.
A.3.1 Hierarchical Representation Both the skeletal and the volumetric features are represented in a hierarchical fashion. We have a biochemical based static hierarchy of the molecules, with atoms at the finest resolution. Groups of atoms are collapsed to form residues and residues form secondary structures. Chains consist of a set of these secondary structures. A dynamic hierarchy, which could be more useful for interactive dynamic level of detail rendering and manipulation is also performed as outlined in [1]. Once a flexible chain complex hierarchy is rebuilt due to dynamic changes in the molecule, the implicitly defined volumetric and surface properties can be quickly updated. Explicit volumes can also be extracted in a hierarchical fashion. When we have a hierarchical representation of a FCC skeleton, we implicitly have a hierarchical representation of the surrounding differentiable sheath. In figure A.9, we show the large ribosomal subunit at three different levels of a hierarchy.
A.3.2 Flexibility representation The paper [38] describes how to store the flexibility information in a structure. More specifically, they describe existing and new methods to obtain new atom positions when rotations are performed. Three schemes for storing and manipulating rotation matrices are given below. Simple rotations scheme. A tree is constructed from the molecule by taking any atom as the root, and bonds in the molecule as bonds in the tree. Rings in a protein are simply taken as a single atom. When a torsional angle changes at a node, then all the nodes below it are rotated to new positions. This rotation update involves a matrix multiplication. The update has to be from the node to the leaves and numerical errors can occur due to manipulating positions of atoms down a chain for each rotation. Consider a bond bi rotated by angle θi . Let v be a vector along the bond and T be the translation matrix formed by the ith atoms position. Then the update matrix is
APPENDIX A. MOLECULES
74 v2x + (1 − v2x )cosθi vx vy (1 − cosθi ) + vzsinθi T vz vx (1 − cosθi) − vy sinθi 0
vx vy (1 − cosθi) + vz sinθi v2y + (1 − v2y )cosθi vy vz (1 − cosθi) + vx sinθi 0
vz vx (1 − cosθi ) + vy sinθi vy vz (1 − cosθi ) − vx sinθi v2z + (1 − v2z )cosθi 0
0 0 T −1 0 1
(3.1)
A.3.3 Denavit-Hartenberg scheme In this scheme, we again maintain a tree, with matrices and update from a root to the leaf. But now, the matrices no longer need the information on the current position of the atom, but only the rotations it underwent as a single matrix. Hence this is numerically stable. To construct the matrix, we first define a local frame at each node. The origin and the vectors are the node position and • w the bond from the node to its parent • u a vector perpendicular to the previous vector and the bond containing this atom and a child. This means that a frame is to be defined for each child. • v a vector perpendicular to the above two. The matrix which takes a point from one frame defined at a node to the frame of the parent of that node is defined as cosθi −sinθi 0 0 sinθi cosφi−1 cosθi cosφi−1 −sinφi−1 −li sinφi−1 sinθi sinφi−1 cosθi sinφi−1 cosφi−1 −li cosφi−1 0 0 0 1
θi φi−1
(3.2)
is the torsional angle of bond bi is the bond angle between bonds bi−1 and bi
Atomgroup scheme. This scheme eliminates the requirement for multiple frames and frames where the bond does not rotate. It simply aggregates the tree into a new tree where sets of vertices ( atoms ) which do not have rotatable bonds are collapsed into a new vertex. Here, we define the local frame as the atomgroup origin and the vectors • wi as a vector along the bond to atomgroup i − 1 • ui as any vector perpendicular to wi • vi as any vector perpendicular to the above two. Let the frames after and before rotation be [xi , ui , vi , wi ] and [x′i , u′i , v′i , w′i ]. In this case the transformation matrix, which takes a point in frame i to local frame at i − 1 ( rotated by θ around the connecting bond ) is defined as the product cosθi −sinθi 0 0 ui−1 .u′i ui−1 .v′i ui−1 .wi ui−1 .(xi − xi−1 vi−1 .u′ vi−1 .v′ vi−1 .wi vi−1 .(xi − xi−1 sinθi cosθi 0 0 i i (3.3) wi−1 .u′i wi−1 .v′i wi−1 .wi wi−1 .(xi − xi−1 0 0 1 0 0 0 0 1 0 0 0 1 The concatenation of such matrices until the root gives the global position of the atomgroup.
A.3.4 Flexibility analysis in molecules - creation of flexible models One classification of flexibility analysis methods in the biomolecular area is given by [14] as • Molecular dynamics
Molecular dynamics involves simulation of the protein in a solvent environment and saving the conformation state at regular time intervals. Since this simulation is often at very small time scales, ( pico or nano seconds ), large conformational changes ( which occur over micro or milli seconds ) will not be recorded. Hence obtaining flexibility analysis through
A.3. FCC (FLEXIBLE CHAIN COMPLEX) REPRESENTATIONS
75
molecular dynamics is limited. An adaptive solver is given in [17]. By allowing users to interact with the system, conformational changes can be forced and observed [20], [32]. A multiple grid method for solving the electrostatics efficiently [31]. Compact structural domains were computed in [12] using simple force calculations in a protein structure. • Xray Crystallography and Nuclear Magnetic Resonance ( NMR )
Xray Crystallography is used to obtain high resolution images of proteins, upto the atomic level. Most structure in the PDB are generated using this method. NMR techniques have been used to obtain dynamic conformations of proteins. The basic idea behind NMR is that atoms have an intrinsic property spin, which determines its behavior when exposed to magnetic fields. Different atoms are seen to emit different frequencies of light, providing an image of the underlying protein as a signature. NMR imaging yields lower resolution results than xray crystallography. Given the large number of states which could be obtained from molecular dynamics, NMR and xray crystallography, the following methods generate certain important conformal states by reducing the number of degrees of freedom in the protein.
• Comparison of conformal states
Protein dynamics give rise to a large number of conformations. Analyzing these conformations for any problem, including flexible protein docking is not computationally feasible. Hence many methods are used to reduce these conformations to a new basis, where the principal basis gave the large fluctuations efficiently. Many authors [35], have shown that the main conformational changes of a protein is mostly captured by using only a few bases and projection vectors, [34]. Normal mode analysis and principal component analysis are two methods to reduce the dimensionality of the problem. Singular Value Decomposition (SVD) is commonly used to find basis vectors to reduce the dimensionality of a set of vectors. An equivalent formulation using Principal Component Analysis (PCA) is also done. Consider the column vectors of a matrix A as the zero mean weighted atomic displacement positions. Usually, this vector is also aligned with a given conformation, so that the displacements are relative. The SVD of a matrix is SV D(A) = U ∑ V T
(3.4)
U,V are orthonormal matrices The diagonal matrix has entries are all non negative and decreasing, called the sinis a diagonal matrix ∑ gular values. In this decomposition, the set of left column vectors of U are the basis set for A, and the vectors in V T are the projections along these basis vectors with magnitudes given by the singular values. Hence, we have an ordering on the influence of the basis vectors for the matrix. To apply the PCA algorithm, a matrix A is defined with elements ai j as follows ai j = ((xi − xi,avg )(x j − x j,avg))
(3.5)
The eigenvector problem AW = W ζ is solved to get the axis vectors and the corresponding fluctuations in the eigenvectors and eigenvalues [19]. In [10], a theorem relating the atom displacements to the frequencies of vibrations is presented. In this paper, the authors prove that if a large molecule only flexes around a certain minimal energy state, approximated by a multidimensional parabola, then the average displacements of the atom positions is the sum of the contributions from each normal mode, which is proportional to the inverse square of the frequency [19]. For Normal Mode Analysis ( NMA ), the moment matrix diagonalized is A = kB T F −1 (3.6) kB T F
is the Boltzmann constant, is the absolute temperature, is a matrix of the second derivatives of the potential energy at a minimum point.
Successful modeling of the Chaperonin GroEL was performed using NMA in [22]. To avoid the computations on a large matrix, [33] compute a blocked version of NMA by grouping residues.
APPENDIX A. MOLECULES
76
Gaussian Network Models ( GNM ) are used in [18]. In this model, the correlation matrix is formed as (3kT /γ [T −1 ]i j ) k T γ T
(3.7)
is the boltzmann constant, is the absolute temperature, is a harmonic potential, is a nearness matrix, called Kirchoff matrix
The kirchoff matrix inverse can only be approximated since its determinant is 0. • Deriving flexibility through a single structure.
Non polar regions in protein tend to lie in the interior and this hydrophobic effect folds the protein. In [37], the authors describe how to capture this information into rigid domains of the protein. Their assumption is that rigid domains folded by the hydrophobic effect behave as a compact unit during conformational changes. To quantify this, they hierarchically grouped residues in a protein to form a tree, using a coefficient of compactness Z given by Z=
accessible surface area of segment surface area of sphere of equal volume
(3.8)
Static core or the backbone of molecules and their associated rigid domains were computed in [3] using two different conformations of a given protein. α helices, β strands and loops were segmented. Similar pairs of segments were clustered in a tree-like fashion using a rmsd calculation. Domains or compact units of a protein were also computed by [30]. The heuristic they used was that the amount of internal contact a domain had was larger than the amount of contact it had with the rest of the protein. Hence by choosing suitable split planes along the sequence, they form compact sequences. Extending this idea, a Monte Carlo sampling in internal coordinates using relevant torsion angles was performed in [23]. They obtained a set of low energy conformations for any given protein structure as a representation of its flexibility. Using graph theoretical algorithms, [14] obtained flexible and rigid domains in a protein.
A.4
Flexibility in RNA
Flexibility in RNA is given by three sets of angles • The backbone torsion angles. • The angles on the sugar ring, also defined by amplitude and a phase. • An angle about which the residue can flex. The angles are shown in figure A.10. Due to the large number of angles, people have studied and proposed various means to reduce the conformational space.
A.4.1 Reduced conformation space Due to the large number of angles defining the flexibility of nucleotides, it is useful to find fewer pseudo torsion angles to represent the other angles. Reduction to two angles. Duarte et al. have reduced the number of torsion angles necessary to describe an RNA molecule to two, η and θ [5], [4]. Figure A.11 gives the relative positions of these angles and the specific atoms of the backbone involved. η is the torsion angle resulting from C4′i−1 − Pi − C4′i − Pi+1 . The atoms connected Pi − C4′i − Pi+1 − C4′i+1 create θ [5]. In their most recent publication, Duarte et al. combined the η and θ data with position information to describe the overall structure of the RNA molecule. Using PRIMOS [6] to create an "RNA worm" - a sequential description of the angle data allows for analysis of the structure on a nucleotide by nucleotide basis. After all η and θ angles have been calculated from the PDB [8], NDB [2], and RNABASE [36] data, PRIMOS creates an RNA worm file which gets deposited into a database. The two angles are plotted and a 3rd dimension, sequence, is added to the graph to form a 3D representation of structure. See Figure A.12.
A.4. FLEXIBILITY IN RNA
77
(a) The six backbone torsion an- (b) The torsion angles defined (c) Nucleotides can rotate about gles for a RNA along the sugar ring the χ torsion angle
Figure A.10: The torsion angles around which a RNA can flex.
Figure A.11: The backbone torsion angles are represented by just two pseudo rotation angles η and θ . In this plot, A-helices (the most common form of RNA; represented in blue) travel in relatively straight lines, whereas the motifs/other features of the RNA show large deviations from the straight line (shown in red). To compare RNA worm representations, and thus conformational variations between molecules, it is necessary to find the difference between the η and θ values in the two molecules. Simply put: q (4.9) ∆(η , θ )i = (η A − ηiB )2 + (θ A − θiB)2
The larger the value of ∆(η , θ )i the more extreme the disparity between the two RNA fragments, chains, or molecules. Further, Duarte et al. use this method to compare ribosomal complexes, search for existing motifs, identify new motifs, and characterize two different types of the same motifs. To compare ribosomal complexes, Duarte et al use PRIMOS to calculate differences in h and q when the ribosome is in different conformational states. For example, the conformational state of the ribosome is altered during antibiotic binding or during different stages of translation. The same method can be used to compare conformational states of ribosomes from different species. To find existing motifs in RNA structures, they used PRIMOS to create another RNA worm database. From this database, a fragment of RNA that contained the motif of interest was selected and compared to every other fragment of the same size within the database and given a score according to equation 4.10. ∑ni=1 ∆(η , θ )i n The scores were sorted in increasing order. The smaller scores indicate a closer match. ∆(η , θ ) =
(4.10)
Reduction to four angles and binning. Hershkovitz et al. [11] suggest a more complex, yet complementary, method to that of Duarte [5]. This method involves calculating four torsion angles, α , γ , δ and ζ , and binning these angles into allowable ranges. "Binning" is a term used to describe the technique used by Hershkovitz to classify various RNA configurations into discrete
APPENDIX A. MOLECULES
78
Figure A.12: Example of 3D representation of RNA structure. Plotting the RNA chains using only two angles per residue in a 3D plot shows similar structures along the worms Angle α γ δ ζ
Bin 1 40 - 90 35 - 75 68 - 93 255 - 325
Bin 2 135 - 190 150 - 200 130 - 165 other
Bin 3 260 - 330 260 - 320 other
Bin 4 other other
Table A.5: Classification of angles:discrete ranges of angles or "bins" as defined by Hershkovitz. bins. For example, nucleotides in the A-form helix, the most common conformation of RNA, have a bin number of 3111 where each number represents which "bin", or range, the torsion angles belong to (i.e. α is in bin 3, or 260◦ - 320◦ and γ , δ and ζ and are in bin 1, or 35◦ - 75◦ ). See Table A.5. The bin number combination 3111 is then assigned an ASCII character, "a". All combinations of bin numbers are assigned a unique ASCII character, enabling the entire RNA chain to be described by a sequence of letters that represent the structure of the molecule. Their goals were to recognize and catalogue all the RNA conformational states, eliminate any unnecessary angle information, and to assess the validity of their binning model by comparing it to a torsion-matching model. The torsionmatching method for RNA motif searching is a brute force method. So while it is highly accurate, it is computationally expensive as it involves calculating all backbone angles including a ribopseudorotation phase angle, P, for each residue and comparing each set of angles to all other sets of angles in the molecule. After using the binning method for all RNA fragments and molecules in their database, Hershkovitz et al found 37 distinct conformational states of RNA. Table A.13 lists the assigned bin numbers, the corresponding ASCII symbols, and the observed frequency of these 37 conformational states. Because this method allows the three dimensional structure of an RNA molecule to be displayed as a sequence of characters, it facilitates motif searching. Without computational aides, one could see that a string of repeating letters (other than "a") represents a possible motif. Hershkovitz et al suggest an alternative to the Ramachandran plots traditionally used for representing angle distributions. The tree diagram in figure A.14 is a natural progression from the four integer code, or bin. Here the widths of the line correspond to the log of the number of residues in each bin.
A.4.2 Classification of RNA using clustering Nucleotides from the large ribosomal subunit (1JJ2.pdb) were clustered into commonly occurring structures by Schneider et al. [29]. They classified the non A-type nucleotides separately ( 830 of them ). Eighteen distinct non A-type conformations and fourteen A-type conformations were reported. They report that a large number of the RNA were very close ( in a RMSE sense ) to the clusters. The authors also say that their results agree with those from Murray et al. [24]. The steps used in obtaining the conformations were as follows. • Separate the A-type from the non A-type nucleotides. • Plot the histogram for the backbone (α , β , γ , δ , ε , ζ ) and the base (χ ) angles.
A.4. FLEXIBILITY IN RNA
79
Figure A.13: Classification into 37 clusters through binning
APPENDIX A. MOLECULES
80
Figure A.14: This tree represents the case where α is 1. There are three others; one for each possible value of α . – α and γ were seen to have tri-modal distributions. – β has a wide gaussian with 180 as its center. – ε has values greater than 180 due to the ring, and lacked a gaussian shape. – delta also was constrained by the ring, and had a sharp bimodal distribution due to the C3’-endo and C2’-endo ribose puckers. – The base χ angle was largely bimodal, due to the two main configuration of bases (anti and syn). – There was a wide distribution of ζ . • Plot 2D scatter plots for the following angle pairs : [α , ζ ], [β , ζ ], [ε , ζ ], [γ , α ], [χ , ζ ] and [χ , δ ]. – The reason for choosing the above sets were not given. – Clusters were found in the pairs [ζ , α ], [α , γ ] and [χ , δ ]. – The lack of clusters in other plots led to clustering of 3 tuples of angles. • From the features and distributions seen in the 1D and 2D plots, the authors choose six 3D plots to base their clusters on to classify the structure of nucleotides. – The following six 3tuples were chosen for clustering: [ζi , αi+1 , δi ], [ζi , αi+1 , γi+1 ], [αi , γi , δi ], [ζi , αi+1 , χi ], [ζi , αi+1 , εi ] and [ζi , δi , χi ]. – The clusters in the 3D plots were assigned peaks and labeled. – Each nucleotide was assigned the corresponding label from each plot, if any, or simply a ’-’. • Each nucleotides 6 letter classification was clustered using lexicographic clustering. The authors do not mention why this method was used. • From this clustering, eighteen distinct non A-type conformations and fourteen A-type conformations were reported.
A.4.3 Division of RNA backbone by suites Murray et al. [24] identify several problems associated with the methods of Murthy [25], Hershkovitz [11], and Duarte [5]. While these methods are excellent at finding and comparing RNA motifs in a large nucleic acid sample, they oversimplify the problem of determining RNA backbone structure. As a result, Murray et al. propose to analyze the folding structure of RNA molecules on a more detailed level, correct the artifacts created in the data structures (sometimes caused by NMR or X-ray crystallography), produce low-noise data distributions, and create a list of the resulting, distinct RNA backbone conformers. The traditional nine angles of the RNA backbone and its bases (i.e. α , β , γ , δ , ε , ζ , χ , and the 2 puckering angles of the sugars) were reduced to six. χ was not included in the model. The two puckering angles were combined and represented as δ , where δ was bimodal - either C3’ endo or C2’ endo. This allowed the six remaining angles two be divided into 2 sets of
A.4. FLEXIBILITY IN RNA
81
Figure A.15: Division of angles into residue and "suite" data 3D distributions, α , β , γ and δ , ε , ζ . Dividing the RNA backbone into heminucleotides, a term coined by Malathi and Yathinda [27], in this manner provided some advantage to the traditional phosphate - phosphate division in that it reduced the dimension of the problem and made visualization more feasible. In other words, two 3D plots can be created using α , β , γ data and δ , ε , ζ data respectively. See figure A.15 The methods of Murray et.al were fairly straightforward. They obtained the sequence and structure data samples from the Protein Database and/or the Nucleic Acid Database. From these samples they calculated all the dihedral angles and added hydrogens with REDUCE [15]. The backbone steric hindrances were calculated with PROBE and CLASHLIST [16]. A clash was noted when the overlap between two atoms was greater than 0.4Å. The angles, quality, resolution, base id, highest crystallographic B factor, and d-e-z values were entered into excel. Images were created using the software PREKIN and MAGE from the same authors. For each of the seven peaks created in the δ , ε , ζ distributions, the α , β , γ set was plotted. Finally, a quality filter was applied to rule out nucleotides with greater than 2.4Å resolution. 210 potential RNA conformers were determined from which 146 had an acceptable (low) amount of steric hindrance. 42 conformers had actual cluster points from the data.
BIBLIOGRAPHY
82
Figure A.16: 3D visualization of clusters
Bibliography [1] C. Bajaj, V. Pascucci, A. Shamir, R. Holt, and A. Netravali. Dynamic maintenance and visualization of molecular surfaces. Dis. App. Math., 127(1):23–51, 2003. [2] H. M. Berman, W. K. Olson, D. L. Beveridge, J. Westbrook, A. Gelbin, T. Demeny, S.-H. Hsieh, A. R. Srinivasan, and B. Schneider. The nucleic acid database: A comprehensive relational database of three-dimensional structures of nucleic acids. Biophys. J., 63:751–759, 1992. [3] N. Boutonnet, M. Rooman, and S. Wodak. Automatic analysis of protein conformational changes of by multiple linkage clustering. Journal of Molecular Biology, 253(4):633–647, 1995. [4] D. CM and P. AM. Stepping through an rna structure: a novel approach to conformational analysis. Journal of Molecular Biology, 284:1465–1478, 1998. [5] D. CM, W. LM, and P. AM. Rna structure comparison, motif search and discovery using a reduced representation of rna conformational space. Nucleic Acids Research, 31:4755–4761, 2003. [6] C. Duartes. Primos. software:www.pylelab.org. [7] R. A. Engh and R. Huber. Accurate bond and angle parameters for x-ray protein structure refinement. Acta Crystallographica Section A, 47(4):392–400, July 1991. [8] F.C.Bernstein, T.F.Koetzle, G.J.B.Williams, E. Jr, M.D.Brice, J.R.Rodgers, O.Kennard, T.Shimanouchi, and M.Tasumi. The protein data bank: a computer-based archival file for macromolecular structures. J. Mol. Biol., 112:535–542, 1977. [9] R. Garrett and C. Grisham. Biochemistry. Saunders Collge Publishing, New York, 2nd edition, 1999. [10] N. Go. A theorem on amplitudes of thermal atomic fluctuations in large molecules assuming specific conformations calculated by normal mode analysis. Biophysical Chemistry, 35(1):105–112, January 1990. [11] E. Hershkovitz, E. Tannenbaum, S. B. Howerton, A. Sheth, A. Tannenbaum, and L. D. Williams. Automated identification of rna conformational motifs: theory and application to the hm lsu 23s rrna. Nucleic Acids Res., 31(21):6249–6257, November 2003. [12] L. Holm and C. Sander. Parser for protein folding units. Proteins, 19(3):256–268, July 1994. [13] H. R. Horton, L. A. Moran, R. S. Ochs, D. J. Rawn, and K. G. Scrimgeour. Principles of Biochemistry. Prentice Hall, 3rd edition, July 2002. [14] D. J. Jacobs, A. J. Rader, L. A. Kuhn, and M. F. Thorpe. Protein flexibility predictions using graph theory. Proteins: Structure, Function, and Genetics, 44:150–165, 2001. [15] W. JM, L. SC, R. JS, and R. DC. Asparagine and glutamine: using hydrogen atom contacts in the choice of side-chain amide orientation. J Mol Biol., 284(4):1735–1747, January 1999. [16] W. JM, L. SC, L. TH, T. HC, Z. ME, P. BK, R. JS, and R. DC. Visualizing and quantifying molecular goodness-of-fit: small-probe contact dots with explicit hydrogen atoms. J Mol Biol., 285(4):1711–1733, January 1999. c R. Skeel, M. Bhandarkar, R. Brunner, A. Gursoy, N. Krawetz, J. Phillips, A. Shinozaki, K. Varadarajan, and [17] L. Kalà , K. Schulten. Namd2: greater scalability for parallel molecular dynamics. J. Comput. Phys., 151(1):283–312, 1999. [18] O. Keskin, R. L. Jernigan, and I. Bahar. Proteins with similar architecture exhibit similar large-scale dynamic behavior. Biophysical Journal, 78(4):2093–2106, April 2000. [19] A. Kitao and N. Go. Investigating protein dynamics in collective coordinate space. Current Opinion in Structural Biology,
BIBLIOGRAPHY
83
9(2):164–169, 1999. [20] J. Leech, J. Prins, and J. Hermans. Smd: Visual steering of molecular dynamics for protein design. IEEE Computational Science and Engineering, 3(4):38–45, 1996. [21] A.-J. Li and R. Nussinov. A set of van der waals and coulombic radii of protein atoms for molecular and solvent-accessible surface calculation, packing evaluation, and docking. Proteins: Structure, Function, and Genetics, 32(1):111–127, 1998. [22] J. Ma and M. Karplus. The allosteric mechanism of the chaperonin groel: A dynamic analysis. Proceedings of the National Academy of Sciences USA., 95(15):8502–8507, July 1998. [23] V. N. Maiorov and R. A. Abagyan. A new method for modeling large-scale rearrangements of protein domains. Proteins, 27:410–424, 1997. [24] L. J. Murray, W. B. A. III, D. C. Richardson, and J. S. Richardson. Rna backbone is rotameric. Proceedings of the National Academy of Sciences U S A, 100(24):13904–13909, November 2003. [25] V. L. Murthy, R. Srinivasan, D. E. Draper, and G. D. Rose. A complete conformational map for rna. Journal of Molecular Biology, 291(2):313–327, August 1999. [26] J. Park, S. Teichmann, T. Hubbard, and C. Chothia. Intermediate sequences increase the detection of homology between sequences. Journal of Molecular Biology, 273(6):349–354, 1997. [27] M. R and Y. N. Backbone conformation in nucleic acids: an analysis of local helicity through heminucleotide scheme and a proposal for a unified conformational plot. Journal Biomolecular Structural Dynamics, 3(1):127–144, August 1985. [28] T. Schlick. Molecular Modeling and Simulation: An Interdisciplinary Guide. Springer-Verlag New York, Inc., Secaucus, NJ, USA, 2002. [29] B. Schneider, Z. Morávek1, and H. M. Berman. Rna conformational classes. Nucleic Acids Research, 32(5):1666–1677, 2004. [30] A. S. Siddiqui and G. J. Barton. Continuous and discontinuous domains: an algorithm for the automatic generation of reliable protein domain definitions. Protein Science, 4(5):872–884, May 1995. [31] R. D. Skeel, I. Tezcan, and D. J. Hardy. Multiple grid methods for classical molecular dynamics. Journal of Computatioanl Chemistry, 23(6):673–684, 2002. [32] J. E. Stone, J. Gullingsrud, and K. Schulten. A system for interactive molecular dynamics simulation. In Proceedings of the 2001 symposium on Interactive 3D graphics, pages 191–194. ACM Press, 2001. [33] F. Tama, F. X. Gadea, O. Marques, and Y. H. Sanejouand. Building-block approach for determining low-frequency normal modes of macromolecules. Proteins, 41(1):1–7, October 2000. [34] M. Teodoro, J. G. N. Phillips, and L. E. Kavraki. Molecular docking: A problem with thousands of degrees of freedom. In Proc. of the 2001 IEEE International Conference on Robotics and Automation (ICRA 2001), pages 960–966, Seoul, Korea, May 2001. IEEE press. [35] M. L. Teodoro, G. N. Phillips, Jr., and L. E. Kavraki. A dimensionality reduction approach to modeling protein flexibility. In Proceedings of the sixth annual international conference on Computational biology, pages 299–308. ACM Press, 2002. [36] M. VL and R. GD. Rnabase: an annotated database of rna structures. Nucleic Acids Research, 31(1):502–504, 2003. [37] M. H. Zehfus and G. D. Rose. Compact units in proteins. Biochemistry, 25(19):5759–5765, September 1986. [38] M. Zhang and L. E. Kavraki. A new method for fast and accurate derivation of molecular conformations. Journal of Chemical Information and Computer Sciences, 42(1):64–70, 2002.