Journal of Scientific & Industrial Research Vol 74, April 2015, pp. 223-224
Computational studies of the nanoindentation load depth curves A S Bhattacharyya Centre for Nanotechnology, Central University of Jharkhand, Ranchi-835205 Received 25 June 2014; revised 30 December 2014; accepted 26 February 2015 The load depth curves obtained during nanoindentation depends on several factors. Load depth curves were generated computationally and an insight in the different parameters have been presented in this article. Keywords: Nanoindentation, load-depth curves.
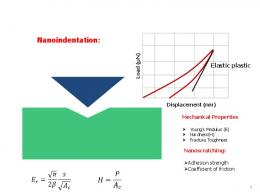
Introduction Nanoindentation is an effective tool for determination of material properties based on its depth sensing capabilities. The load-depth curve obtained during nanoindentation gives the load which is required to penetrate a certain depth in the material and also provides the elastic and plastic work done during the indentation process. The nature of the loaddepth is a function of both the material under test and tip blunting 1-4.
Fig 1(e). Fig 2 shows the possible load depth curves for different elastic plastic responses of the film. For a 100% elastic response the unloading curve follows exactly the same path followed by the loading curve. As the plastic repose starts to take place the unloading curve starts to deviate from the loading curve. However it should be kept in mind that the nature of
Results and discussions For initial penetration, the load and depth follow the relation P = k h when the initial spherical blunt potion of the indenter is in contact. The relation changes to P = k h1.5 and later to P = k h 2 for higher depths as the conical sides comes in contact5. For the loading portion of the curve the relation P = k h m where m varies from 1 to 3 has been plotted in Fig 1 (a). A closer variation is observed in Fig 1(b) where m has varied from 1.75 to 2.25.The experimental load depth curve for SiCN coatings deposited on Si (100) substrates 6 was fitted with a computer generated load-depth curve using the relation P = k h 2 for the loading curve and P = k h 2 - k (h max - h) 2 for the unloading curve. The value of the k for the fitted simulated curve came out to be 2.19e-4. For a depth of 500nm, the experimental load-depth curve reaches to a maximum value of 28 mN for an electropolished 304SS material and 54mN for SiCN deposited on Si (100). The simulated load depth curves for different values of k are given in ______________ * Author for correspondence E-mail:
[email protected]
Fig. 1- (a, b) Simulated loading curves corresponding to different m values (c) simulated loading curves corresponding of different k values (d) experimental and simulated P- h curves (e) experimental load depth curves for 304SS substrate.
J SCI IND RES VOL 74 APRIL 2015
224
determine the stiffness in which h is the penetration depth and hf the final displacement. S=dP/dh at h = hmax which in our case comes out to be S = m k hmax m-1 which is comparatively much simpler than the existing form S=B m (h - hf) m-1/ hmax. Conclusions Computational studies were done to generate load depth curves on nanoindentation based on Oliver and Pharr model. The parameters for generating the curves showed a significant effect on the nature of the curves which corresponds to experimental and sample conditions while doing the nanoindentation experimentally. Fig. 2- Simulated load-depth curves corresponding to different elastic plastic responses7
the curve are also a function to wear as for the same material, a blunt tip will give higher elastic response for the same depth compared to a sharper tip. The unloading curve equations were different for each of the cases. P = k h 2; P = k h 2- k 2 (hmax - h) 1/2 P = k h2 - k (h max -h) 2 P = k h 2- k (h max -h) 5/2 P = k h 2- k 2 (hmax -h) 3/2 So the parameters k, m, n and r are the ones which are actually controlling the shape of the load depth curve. Integration of these expressions gives us the area under the curves. A further research is however required to get a further insight about these parameters ∫ k h m d h = Total energy ∫ [k (hmax – h) r ] d h = Elastic energy ∫ [k h m –k n (hmax – h) r ] d h = plastic energy n
The established power law equation P = (h – hf)m to fit the unloading portion of the curve is used to
Acknowledgments: The author would like to thank Dr. C. Sarkar for computational studies and Dr. S.K.Mishra. National Metallurgical Laboratory for valuable suggestions. References 1 Fischer-Cripps, A C. Nanoindentation. Springer: New York, 2004. 2 Oliver W C & Pharr G M, An improved technique for determining hardness and elastic modulus using load and displacement sensing indentation experiments ,J Mater Res, 7 (1992) 1564-1583. 3 Malzbender J, den Toonder J M J, Balkenende A R & de With G, Measuring mechanical properties of coatings: a methodology applied to nano-particle-filled sol-gel coatings on glass, Mater Sci Eng Reports, 36 (2002) 47-103. 4 Oliver W C & Pharr G M, Measurement of hardness and elastic modulus by instrumented indentation: advances in understanding and refinements to methodology, J Mater Res, 19 (2004) 3-20. 5 Bull SJ, Nanoindentation of coatings, J Phy D, 38 (2005) 393–413. 6 Bhattacharyya A S, Das G C, Mukherjee S & Mishra SK, Vacuum ,83 (2009) 1464–1469. 7 Bhattacharyya A S & Sarkar C, Deformation and computational studies based on nanoindentation, IndiaAustralia Int Workshop on Nanotechnol, Jadavpur University (2011) 46.