show the stability of the obtained solutions. ... The most common approach to the segmentation of satellite images is based on data clustering algorithms [3].
Computationally efficient methods of clustering ensemble construction for satellite image segmentation I.A. Pestunov1, S.A. Rylov1, Yu.N. Sinyavskiy1, V.B. Berikov2 1
Institute of computational technologies SB RAS, 6 acad. Lavrentiev ave., 630090, Novosibirsk, Russia 2 Sobolev institute of mathematics SB RAS, 4 acad. Koptug ave., 630090, Novosibrsk, Russia
Abstract Combining multiple partitions into single ensemble clustering solution is a prominent way to improve accuracy and stability of clustering solutions. One of the major problems in constructing clustering ensembles is high computational complexity of the common methods. In this paper two computationally efficient methods of constructing ensembles of nonparametric clustering algorithms are introduced. They are based on the use of co-association matrix and subclusters. The results of experiments on synthetic and real datasets confirm their effectiveness and show the stability of the obtained solutions. The performance of the proposed methods allows to process large images including multispectral satellite data. Keywords: ensemble; co-association matrix; nonparametric clustering algorithm; multispectral image segmentation
1. Introduction Segmentation is one of the most important steps in the analysis of digital images [1]. It consists of dividing an image into non-overlapping regions based on similarity of their spectral and spatial characteristics (texture, size, shape, etc.). Segmentation methods have found wide application in many applied fields including Earth remote sensing [2], which is developing rapidly in recent years. The most common approach to the segmentation of satellite images is based on data clustering algorithms [3]. Generally, clustering problem has to be solved without any a priori information about the number of clusters and their probabilistic characteristics. Under these conditions, the most attractive is nonparametric approach, which is famous for its ability to discover arbitrary-shaped clusters without hard assumptions on the density distribution function [4]. Nonparametric density-based algorithms define clusters as high density regions in the feature space separated by low density regions. Histogram and Parzen-window density estimates are the most popular for nonparametric clustering algorithms. The resulting estimate is highly dependent on the smoothing bandwidth parameter, which defines the scale of observation. Larger values result in smoother density estimate, while for smaller values the contribution of each sample to overall density has the emphasized local character, resulting in density estimate revealing details on a finer scale. Bandwidth selection in practical tasks is very complicated [5]. Ensemble approach is well known as a prominent method for improving robustness, stability and accuracy of clustering solutions [6-15]. Ensemble approach combines multiple partitions generated by clustering algorithms into a single consensual solution. Research on clustering ensembles focuses on two challenging aspects: how to generate different and diverse partitions and how to design consensus function. There are four common ways of generating multiple data partitions for clustering ensemble [6]: applying different clustering algorithms [7], applying the same clustering algorithm with different values of parameters or initializations [8], combining data representations (feature spaces) [9] and different subsets of initial dataset [10]. The optimal consensual result can be obtained by solving median partition problem [11]. In this case, one seeks to find the partition, which minimizes the sum of distances to all partitions in the ensemble with respect to a clustering distance function. The direct solution turns out to be NP-hard for any reasonable clustering distance function [12]. Therefore, in practice other ways of solving this problem are used (e.g. hypergraph partitioning, voting approach, mutual information algorithm, coassociation based functions and finite mixture model). Nevertheless, all these methods suffer from high time complexity [7,8] and they cannot be applied directly to large images containing millions of pixels [10,13]. In this paper, two computationally efficient methods of constructing clustering ensembles based on co-association matrix and subclusters are proposed and compared. Besides, the use of co-association matrix for improving the stability of ensemble results is theoretically substantiated. 2. Description and theoretical foundation of the ensemble approach based on consensus co-association matrix One of the most efficient approaches for constructing cluster ensemble is the use of consensus co-association matrix [15]. The elements of this matrix characterize the pairwise dissimilarity of objects as a number of partitions in which a pair do not belong to the same cluster. To obtain final solution, the co-association matrix is considered as a matrix of distances between objects. In this role, it is used as input for the one of the standard hierarchical clustering algorithms. This method does not require the equality of the number of clusters in all partitions. This condition is necessary for nonparametric clustering, when the number of clusters is not determined in advance. In this work, we propose to construct an ensemble on the basis of L particular results obtained by nonparametric clustering algorithm with different values of bandwidth parameter. The method of the ensemble construction is described as follows. 3rd International conference “Information Technology and Nanotechnology 2017”
194
Image Processing, Geoinformation Technology and Information Security / I.A. Pestunov et al.
Suppose that the set of classified objects consists of vectors in feature space Rd : X {xi ( xi1 ,..., xid ) R d , i 1, N } . Let a set of particular clustering results G {G(1) ,, G(l ) ,, G( L) } be obtained with use of some algorithm ( ) depending on a vector of parameters taken at random from certain set of parameters Θ ; here G (l ) is the l th variant of partitioning on M (l ) clusters. Denote by H ( l ) the binary matrix of size N N defined for the l th partition as follows:
0, if the objects xi and x j are assigned to the same cluster, H i , j (l ) otherwise, 1,
where i, j 1,, N , i j . After constructing a set of particular clustering results, it is possible to determine the consensus co-association matrix 1 L H Hi , j , Hi , j H i , j (l ) , L l 1 where i, j 1,, N . The quantity H i , j equals the frequency of classifying xi and x j into separate clusters in the set of
clusterings G . A value close to zero suggests that these objects have a large chance of falling into the same group. A value close to 1 indicates that the chance of being in the same cluster is negligible for the pair. After calculating the consensus co-association matrix, hierarchical clustering algorithm UPGMA with unweighted average linkage rule is applied to find the collective clustering result [16]. This method has the advantage that it allows discovering hierarchical structure of clusters, what greatly simplifies the process of interpreting the results. To study the properties of cluster ensemble construction method, we suggest the following probabilistic model. Suppose that there exists a latent (directly unobservable) variable U that determines the belonging of each object to some of M 2 classes. Each class is characterized by certain conditional distribution p ( x | U r ) f r ( x ) , r 1,, M . Consider a model of data generation. Let an object’s attributed class be determined in accordance with a priori probabilities Pr P (U r ) ,
r 1,, M , where
M
P r 1
r
1 . Then according to distribution f r ( x) the value of x is obtained. This procedure is repeated
independently for each object. Let some clustering algorithm be used to partition the dataset X into M subsets. Since the labeling of clusters do not matter, it is convenient to consider the equivalence relation, i.e. to indicate whether the algorithm assigns a pair of objects to the same class or not. For each pair of objects a and b , we define the value 0, if the objects are assigned to the same cluster, H a ,b ( ) otherwise, 1, where a, b X , a b . Let us choose an arbitrary pair a and b of different objects. Let PU P (U (a ) U (b)) be the probability of assigning the objects to different classes. For example, for M 2 this probability equals 2 f (a) f r (b) Pr2 PU 1 P (U (a ) 1| a)P (U (b) 1| b) P (U (a) 2 | a) P (U (b) 2 | b) 1 r , p(a) p(b) r 1 2
where p( ) f r ( ) Pr , a, b . r 1
Denote by Per ( ) the probability of error for algorithm in assigning a and b to different classes, where
if Ha ,b ( ) 0, PU , Per ( ) 1 PU , if Ha ,b ( ) 1. One can easily notice that
Per ( ) (1 Ha,b ( )) PU Ha,b ( )(1 PU ) PU (1 2PU )Ha,b ( ) .
Algorithm depends on the random vector of parameters Θ : () . To emphasize the dependence of the results on the parameter , in what follows we shall denote Ha,b ( ()) Ha ,b () , Per ( ()) Per () . Let a collection H (1 ), , H ( L ) be obtained by algorithm running L times with randomly and independently selected parameters 1 , , L . For definiteness, we may assume that L is odd. The function 1 L 1 H (l ) , 0, if H( H (1 ), , H ( L )) L l 1 2 1, otherwise
will be called a collective (ensemble) decision by majority voting for a pair of objects. Within the framework of the model described above, the following properties of the suggested collective decision are fulfilled [15]. Proposition 1. Mathematical expectation and variance of the value of error probability for algorithm () are equal, respectively, to: 3rd International conference “Information Technology and Nanotechnology 2017”
195
Image Processing, Geoinformation Technology and Information Security / I.A. Pestunov et al.
E Per () PU (1 2 PU ) PH ,
Var Per () (1 2PU )2 PH (1 PH ) ,
where PH P ( H () 1) . Denote by Per (1 , , L ) the random function which for fixed arguments takes a value equal to the probability of error in classifying a and b by the ensemble algorithm. Here we denote by 1 , , L independent statistical copies of random vector . Consider the behavior of error probability for collective decision. Proposition 2. Mathematical expectation and variance of the value of error probability for collective decision are equal, respectively, to:
E 1 ,,L Per (1 ,, L ) PU (1 2PU ) PH, L , Var1 ,,L Per (1 , , L ) (1 2 PU ) 2 PH , L (1 PH , L ) , L 1 1 L where PH, L P H (l ) CLl PHl (1 PH ) L l , · denotes the integer part. 2 l L / 21 L l 1 We use the following a priori information about cluster analysis algorithm. We assume that the expected probability of erroneous classification E Per () 1 / 2 . That is, it is believed that the algorithm classifies with better quality than the algorithm of random equiprobable choice. It follows from Proposition 1 that one of two variants should be fulfilled: a) PH 1 / 2
and PU 1 / 2 ; b) PH 1 / 2 and PU 1 / 2 . Let us consider, for definiteness, the first case. Proposition 3. If E Per () 1 / 2 , and at that PH 1 / 2 and PU 1 / 2 , then with increasing an ensemble size, the expected probability of erroneous classification decreases, tending to the limit of 1 PU , and the variance of the value of error probability tends to zero. The last statement allows to conclude that under the fulfillment of quite natural requirements, the usage of the ensemblebased approach will improve the quality of clustering. 3. Computationally efficient methods of clustering ensemble construction Constructing ensemble solution based on consensus co-association matrix requires formation and processing of the square matrix of size N N ( N is the number of elements). This method is not applicable for satellite image segmentation due to its quadratic complexity. This problem can be overcome by processing groups of elements instead of single elements. The way of grouping and choosing representatives may depend on algorithm specific features. Two methods of data grouping in order to construct consensus co-association matrix are proposed below. The first method allows combining results obtained by arbitrary clustering algorithm. Having L partitions, each data element xi can be associated with a label vector ci (ci1 ,, ciL ) where cij is a label of cluster containing xi in j th partition. Data elements with the same label vectors are merged into subclusters, because corresponding elements of co-association matrix (the distance between such elements) is zero. Subclusters are labeled as related data elements and will act as data elements while constructing of consensus co-association matrix. The distance between subclusters labeled as ci and c j is defined as
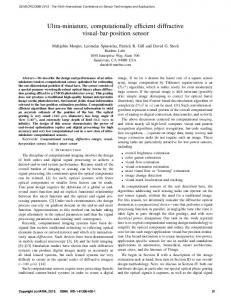
1, if a is true; 1 L I cil clj , where I (a ) L l 1 0, otherwise. In this case, the size of co-association matrix is equal to the number of subclusters, which can vary from the maximum number of clusters in partitions to their product. The second method allows to construct an ensemble solution for nonparametric mode-seeking clustering algorithms. In this case, each cluster contains one or more local density maxima (modes). Data elements are first divided into subclusters corresponding to single modes. Modes are used as representatives of subclusters and will act as data elements while constructing consensus co-association matrix. All elements of the subcluster are labeled as corresponding mode. Consensus co-association matrix is formed on the set of representatives from the basic partition (the most detailed partition in the ensemble). The correspondence between different partitions is established by determining clusters containing the representatives from the basic partition (as points in the feature space). Therefore, the size of co-association matrix is much less than N and equal to the number of modes in base partition. Fig. 1 illustrates the second method and shows two different partitions ( L 2 ) of the same data into clusters (highlighted by colors) that correspond to some density modes. First partition is considered basic and it contains three representatives (A, B, C). When establishing the correspondence between partitions, representatives A and B are assigned to one cluster in the second partition and representative C – to another. Thus, the distance between representatives A and B equals 1/2 (since they lie in different clusters in the basic partition) while the distances between pairs A, B and B, C are equal to 2/2. The proposed methods were used to construct an ensemble of nonparametric clustering algorithms: MeanSC (based on Parzen density estimation), CCA and HCA (based on the histogram density estimation). Ensemble algorithms EMeanSC [17] and HECA [18] were designed using the first and the second ensemble construction method respectively. Basing on clustering algorithm CCA two ensemble algorithms were developed: CCAE (using first method) and ECCA [19] (using second method). The implementation of both proposed methods based on the same clustering algorithm allows to compare these methods. Hi, j
3rd International conference “Information Technology and Nanotechnology 2017”
196
Image Processing, Geoinformation Technology and Information Security / I.A. Pestunov et al.
Fig. 1. Illustration of the second method of clustering ensemble construction using representatives.
4. Experimental results Experimental results show that proposed clustering ensemble construction methods improve the quality and the stability of obtained results. Moreover, they significantly simplify algorithm parameters selection. Computational efficiency of the proposed methods allows processing large satellite images. Experimental results on both synthetic and real datasets were obtained on Intel Core i7 3.2 GHz quad-core CPU. Experiment 1. Two different two-dimensional synthetic datasets [20] were clustered. First dataset consists of 3 classes containing 1000 points each with uniformly distributed “bridge” (200 points) and uniformly distributed noise (1000 points). Fig. 2 shows initial data (Fig. 2a) and the result of EMeanSC ensemble clustering algorithm (Fig. 2b). Correct data decomposition with MeanSC clustering algorithm requires precise parameter setting while ensemble algorithm successfully detects 4 clusters and noise (black points in Fig. 2) even with bad interim results (Fig. 2e). Second synthetic dataset (“bananas”) was built in PRTools toolbox [21] with parameter 0.7 . It consists of 400 points and represents 2 linearly inseparable classes (Fig. 2c). Ensemble clustering result of EMeanSC algorithm is shown in Fig. 2d.
a
b
c
d
e Fig. 2. Experiment 1: synthetic datasets (a,c) and clustering results obtained by ensemble EMeanSC algorithm (b,d) and MeanSC algorithm with different bandwidth parameter values (e).
Experiment 2. Two-dimensional synthetic dataset containing 5 classes [20] was clustered. Three classes represent normal distribution with mathematical expectation vectors 1 (188,100) , 2 (75,100) , 3 (75,150) and covariance matrices
122 0 212 0 42 0 1 , , respectively. Fourth class represents uniformly distribution along the ring 2 3 2 2 2 0 12 0 8 0 4 with center at (188,100) and radiuses Rmin 20 and Rmax 25 . Fifth class represents uniform distribution along the circle with center at (188,100) and radius R 45 . Elements of the fifth class were further radially displaced by a random value having normal distribution with standard deviation 4 . Clusters containe 220, 600, 600, 400 and 500 points respectively (Fig. 3a). There we have a generated reference partition (Fig. 3a), so the accuracy of clustering is determined as the percentage of correctly classified elements. Each class from the reference partition is associated with a cluster (one or none) containing the largest number of elements from this class. 3rd International conference “Information Technology and Nanotechnology 2017”
197
Image Processing, Geoinformation Technology and Information Security / I.A. Pestunov et al.
Fig. 3b represents results obtained by ECCA clustering algorithm ( L 8 ). The accuracy of clustering is 99.48%. Clustering algorithms from open source package ELKI [22] could not correctly separate all 5 classes. The best results (Fig. 3c and 3d) were obtained by density-based hierarchical algorithm OPTICS (79.7% for parameters epsilon 12 , minpts 8 and hierarchy cutoff level 4.9) and hierarchical nearest neighbor algorithm SLINK (72.72% for parameter threshold 5 ).
a
b
c
d
Fig. 3. Experiment 2: synthetic dataset (a) and results obtained by ECCA (b), OPTICS (c) and SLINK (d) clustering algorithms.
Experiment 3. The purpose of this experiment is to demonstrate an increasing stability of the ensemble clustering results with ensemble size ( L ) growth. The accuracy of clustering “bananas” dataset (see Fig. 2c) with respect to grid parameter m (bandwidth) for CCA( m, T ) algorithm and corresponding ensemble algorithms ECCA( m, L, T ) and CCAE(m, L, T ) with L 5 and L 10 is shown in Fig. 4. Parameter T was fixed at value 0.3. As it can be seen from the graph, the stability of the results increases with ensemble size growth.
a
b
Fig. 4. Graph of the clustering accuracy with respect to grid parameter for CCA, CCAE (a) and ECCA (b) algorithms.
Experiment 4. Fig. 5 shows the result of WorldView-2 satellite image clustering (Burmistrovo, Novosibirsk region). Image size is 2048×2048 pixels; four spectral bands (1, 3, 5 and 8) were used. Image was processed by ECCA algorithm (with L 8 ) in 0.5 seconds. This experiment confirms the ability of the developed ensemble algorithm to effectively process multispectral satellite images. Experiment 5. The purpose of this experiment is to demonstrate computational efficiency of the proposed ensemble construction methods and to compare them. Six images were used (Fig. 5a and 6) [23], including 3 satellite ones (WorldView-2 and Landsat-8, 4 bands selected). Table 1 shows the time of constructing clustering ensemble containing 8 elements with CCAE and ECCA algorithms. The time for 8 CCA runs (in parallel) performed before the ensemble construction is shown separately. 3rd International conference “Information Technology and Nanotechnology 2017”
198
Image Processing, Geoinformation Technology and Information Security / I.A. Pestunov et al.
The results show that second ensemble constructing method based on the use of density-modes (ECCA algorithm) leads to much smaller size of consensus co-association matrix that substantially reduces processing time.
a
b
Fig. 5. RGB-composite (bands 5, 3, 2) of the WorldView-2 satellite image (a) and segmentation result obtained by ECCA clustering algorithm (b). Table 1. Comparison of the proposed ensemble construction methods (the time is in seconds). Image size Number of Time for 8 Subclusters number, CCAE ensemble (megapixels) bands CCA runs CCAE construction time
Subclusters number, ECCA
ECCA ensemble construction time
1
3
0.08
1697
0.3
155
0.005
5
3
0.3
2199
2.8
161
0.02
14
3
0.6
3520
4.9
79
0.03
4
4
0.5
9975
5.6
1278
0.06
12
4
0.9
4640
2.1
1414
0.1
50
4
2.5
9625
32
1518
0.2
Fig. 6. Color pictures and images from WorldView-2 and Landsat-8 satellites.
5. Conclusion In this paper, two methods of constructing clustering ensemble based on co-association matrix are proposed and theoretically substantiated. Developed ensemble clustering algorithms are based on nonparametric density estimates and they don’t make hard assumptions on the density distribution function. Experimental results on both synthetic and real datasets confirm high quality of the obtained solutions and their stability. Unlike common ensemble construction methods, the proposed approaches can be directly applied to large satellite images (containing millions of pixels) and demonstrate high performance. Acknowledgements This work was partially supported by Presidium of the RAS (project 0316-2015-0006). References [1] Gonzalez RC, Woods RE. Digital image processing. Moscow: Tekhnosphera, 2006; 812 p. (in Russian) [2] Dey V, Zhang Y, Zhong M. A review on image segmentation techniques with remote sensing perspective. Proceedings of ISPRS TC VII Symposium – 100 Years ISPRS. Vienna: ISPRS, 2010; XXXVIII(7A): 31–42. [3] Pestunov IA, Sinyavsky YuN. Clustering algorithms in problems of segmentation of satellite images. Bulletin KemSU 2012; 52(4/2): 110–125. (in Russian). [4] Jain AK. Data clustering: 50 years beyond K-means. Pattern Recognition Letters 2010; 31(8): 651–666. [5] Krstinic D, Skelin AK, Slapnicar I. Fast two-step histogram-based image segmentation. Image Processing, IET 2011; 5(1): 63–72. 3rd International conference “Information Technology and Nanotechnology 2017”
199
Image Processing, Geoinformation Technology and Information Security / I.A. Pestunov et al. [6] Ghaemi R, Sulaiman M, Ibrahim H, Mustapha N. A survey: clustering ensembles techniques. International Journal of Computer, Electrical, Automation, Control and Information Engineering 2009; 3(2): 365–374. [7] Kashef R, Kamel M. Cooperative clustering. Pattern Recognition 2010; 43(6): 2315–2329. [8] Hore P, Hall LO, Goldgof DB. A scalable framework for cluster ensembles. Pattern Recognition 2009; 42(5): 676–688. [9] Strehl A, Ghosh J. Cluster ensembles – a knowledge reuse framework for combining multiple partitions. The Journal of Machine Learning Research 2003; 3: 583–617. [10] Jia J, Liu B, Jiao L. Soft spectral clustering ensemble applied to image segmentation. Frontiers of Computer Sciense in China 2011; 5(1): 66–78. [11] Franek L, Jiang X. Ensemble clustering by means of clustering embedding in vectorspaces. Pattern Recognition 2014; 47(2): 833–842. [12] Filkov V, Skiena S. Integrating microarray data by consensus clustering. International Journal on Artificial Intelligence Tools 2004; 13(4): 863–880. [13] Tasdemir K, Moazzen Y, Yildirim I. An approximate spectral clustering ensemble for high spatial resolution remote-sensing images. IEEE Journal, Selected Topics in Applied Earth Observations and Remote Sensing 2015; 8(5): 1996–2004. [14] Berikov V, Pestunov I. Ensemble clustering based on weighted co-association matrices: Error bound and convergence properties. Pattern Recognition 2017; 63: 427–436. [15] Berikov VB. Construction of an ensemble of decision trees in the cluster analysis. Computational Technologies 2010; 15(1): 40–52. (in Russian) [16] Gronau I, Moran S. Optimal implementations of UPGMA and other common clustering algorithms. Information Processing Letters 2007; 104(6): 205–210. [17] Pestunov IA, Berikov VB, Sinyavskiy YuN. Segmentation of multispectral images based on an ensemble of nonparametric clustering algorithms. Vestnik SibGAU 2010; 5(31): 56–64. (in Russian) [18] Pestunov IA, Rylov SA, Berikov VB. Hierarchical clustering algorithms for segmentation of multispectral images. Optoelectronics, Instrumentation and Data Processing 2015; 51(4): 329–338. [19] Pestunov IA, Kulikova EA, Rylov SA, Berikov VB. Ensemble of clustering algorithms for large datasets. Optoelectronics, Instrumentation and Data Processing 2011; 47(3): 245–252. [20] Rylov SA. Model datasets. URL: https://drive.google.com/open?id=0ByK9GtU5ExExRnZwdFNmRHRWdFk (30.05.2017). [21] A Matlab Toolbox for Pattern Recognition. URL: http://www.prtools.org (30.05.2017). [22] Schubert E, Koos A, Emrich T, Züfle A, Schmid KA, Zimek A. A framework for clustering uncertain data. Proceedings of the VLDB Endowment 2015; 8(12): 1976–1979. [23] Image datasets for clustering. URL: https://drive.google.com/open?id=0ByK9GtU5ExExWXpGRjU5WVFHcDg (30.05.2017).
3rd International conference “Information Technology and Nanotechnology 2017”
200