Computer Aided Disease Detection System for Gastrointestinal Examinations Michael Riegler1 , Konstantin Pogorelov1 , Jonas Markussen1 , Mathias Lux3 , Håkon Kvale Stensland1 Thomas de Lange2,4 , Carsten Griwodz1 , Pål Halvorsen1 , Dag Johansen5 , Peter T Schmidt6 , Sigrun L. Eskeland4 1 Simula
2 Cancer Registry of Norway 3 Klagenfurt University Research Laboratory & University of Oslo 4 Vestre Viken Hospital Trust 5 Univeristy of Tromsø - The Arctic University of Norway 6 Department of Medicine Solna, Karolinska Institutet, Center for Digestive Diseases, Karolinska University Hospital
[email protected],
[email protected],
[email protected],
[email protected],
[email protected]
ABSTRACT In this paper, we present the computer-aided diagnosis part of the EIR system [9], which can support medical experts in the task of detecting diseases and anatomical landmarks in the gastrointestinal (GI) system. This includes automatic detection of important findings in colonoscopy videos and marking them for the doctors. EIR is designed in a modular way so that it can easily be extended for other diseases. For this demonstration, we will focus on polyp detection, as our system is trained with the ASU-Mayo Clinic polyp database [5].
CCS Concepts •Information systems → Multimedia and multimodal retrieval;
Keywords Medical Multimedia; Information Systems; Classification
1.
INTRODUCTION
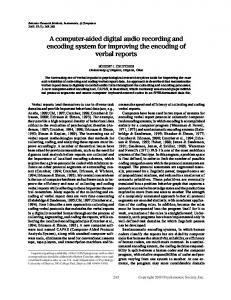
Colonoscopy is an invasive medical procedure, where medical experts (endoscopists) investigate and operate on the colon, i.e., by using a flexible endoscopes as shown in figure 1(a). From the tip of the endoscope, a video is transmitted, and the endoscopists rely on the video stream to diagnose disease and apply treatments. As the camera is the virtual eye of the endoscopist and the video stream is all the endoscopist perceives, research in medical imaging focuses on diagnosis and detection of diseases and anatomical landmarks based on video. A video capsule endoscope (VCE) (camera pill see figure 1(b)) is an alternative noninvasive technique to record videos from the colon. The capsule with a camera is swallowed, it records a video of the gastrointestinal (GI) tract, and an endoscopist analyses the videos afterwards for endoscopic findings. Permission to make digital or hard copies of part or all of this work for personal or classroom use is granted without fee provided that copies are not made or distributed for profit or commercial advantage and that copies bear this notice and the full citation on the first page. Copyrights for third-party components of this work must be honored. For all other uses, contact the owner/author(s). MMSys’16 May 10-13, 2016, Klagenfurt, Austria c 2016 Copyright held by the owner/author(s).
ACM ISBN 978-1-4503-4297-1/16/05. DOI: http://dx.doi.org/10.1145/2910017.2910629
(a)
An endoscope as it is used for (b) Examples for two video standard colonoscopies. It consists of capsular endoscopes. The a control device, the tube and the cam- upper one has two cameras era at the tip. and the lower has one.
Figure 1: videos.
Two devices that produce endoscopic
In this paper, we present a demo that shows how the visualization and computer-aided diagnosis part of our system works and how it can be used by medical experts to support them at the time of the colonoscopy procedure, as well as after the procedure has finished. There are several potential benefits of such a system for patients and the healthcare sector. It could be a useful tool for training of new endoscopists in recognizing and classifying endoscopic findings, and probably also improve endoscopists’ live detection of polyps. Early detection prevents the polyps from developing into colorectal cancers (CRC), the second most common cancer for both genders with a 6% lifetime risk of contracting the disease. The automatic detection could also be applied to VCE videos, thus eliminating or reducing the time to review the video footage and freeing time for the endoscopist to perform other important medical tasks. The automatic computer interpretation makes it also possible to generate automatic text reports from the procedures, and the patients can receive the results from the examination faster. The detection subsystem is used in combination with our previously developed TagAndTrack tool [1] to be able to provide computer-aided diagnosis to endoscopists. The detection subsystem is released as open source software 1 . The automatic detection of irregularities and the segmentation of videos can help doctors to save time, and can further increase the accuracy of diagnosis and be used to verify the completeness of an examination. Moreover, our system is very easy to train, to modify and to expand so that it can be used and improved by everyone, even by non experts. We also want to point out that our system is not limited to the medical use case. It could be expanded to many different use cases that can be solved by 1
https://bitbucket.org/mpg_projects/opensea
visual content-based classification, like for example contentbased segmentation of sport events like soccer games. The remainder of the paper presents the architecture and the implementation of the application. Furthermore, we show how the system can be used. A demo video of the tool can be found at https://youtu.be/gb2BqMuZ2h0. In this demo video, one can easily see the challenges that come with colonoscopy videos, i.e., blurry frames, low resolution, reflections and fluids, etc.
2.
RELATED WORK
Automatic detection of polyps in colonoscopy has been in focus of research for a long time [12, 14, 11]. However, few complete systems exist that are able to do real-time detection, or that can support endoscopists by computer-aided diagnosis for colonoscopies in real-time and at the same time maintain a high detection accuracy. The most recent and best working approach is Polyp-Alert [13], which is able to give near real-time feedback during colonoscopies. The system can process 10 frames per second, and visual features and a rule-based classifier are used to detect the edges of polyps. The researchers report a performance of 97.7% correctly detected polyps in their data set. Compared to our EIR system [9], this system seems to reach higher detection accuracy, but our system is faster and can at the moment detect polyps in real-time. Furthermore, our system is not restricted to detecting polyps and will be extensible to detect several different diseases at the same time. To achieve realtime for a multi-class detection, we plan to utilize heterogeneous architectures such as GPUs. Another recent approach that is related to our system is presented by Nawarathna et al. [6]. The authors describe a method to detect abnormalities like bleeding, but also polyps in colonoscopy videos using a texton histogram of an image block. In a nutshell, our system uses global image features for the classification of frames and a search-based approach that leads to low classification times per frame. It is well known that global image features are very easy to extract and analyze in terms of time and easy to store in terms of space. This makes our EIR well suited for applications on huge amounts of data [4].
3.
ARCHITECTURE & IMPLEMENTATION
Our detection subsystem consists of two modules, (i) an indexer and (ii) a classifier as shown in figure 2. The indexer analyzes input data and extracts global features from the training videos. The classifier is in principle a binary KNearest-Neighbor (K-NN) classifier, which utilizes the index to search the training set for visually similar cases. The results of multiple global features are fused and weighted by the classifier module and result in a proposed class. The classifier works on single frames, but also accepts a complete video as input. In this case, it will classify every single video frame, and it will output a result file. We modified the previously developed TagAndTrack tool [1], which can open and interpret the results of the classifier for visualizing the classification results. We have implemented the indexer as well as the classifier in Java. We are using LIRE [4] for extracting global image features, and LIRE internally uses Lucene 2 for creating 2
https://lucene.apache.org/
Figure 2: The overall architecture of our demo. The detection subsystem provides the output that we use in a visualization tool that presents it to the medical experts. and searching indexes. Further, we are using OpenCV 3 for reading and decoding video files. The indexer as well as the classifier both use multiple threads.
3.1
Detection Subsystem
The classification of each frame is based on the analysis of search results for a given query image. As mentioned before, the classification algorithm is a modified K-NN algorithm. K-NN is a non-parametric algorithm, which means that the algorithm uses the rank of the values rather then the parameters of each frame. The frame classification is a simple majority decision based on the outcome of the K-NN algorithm. The classification algorithm used in the system differs in some points from the original K-NN algorithm. The first difference is that the algorithm is based on a ranked list of a search results, which can be generated in real-time or pre-indexed for each query frame of the video. The second is that weighted values are used for generating a decision antithetical to the non-parametric behaviour of K-NN. The weights are based on the search result’s ranked list. This part is designed in a way that it can easily be replaced with other different methods (for example visual page rank, etc.). As mentioned before, the classification tool is implemented as a search for similar images in indices that are generated off-line or on-the-fly, based on single or multiple image features. For each image in the input index or video, it searches the provided classifier indices and finds the images with the most similar image features, whereas similarity is determined based on low-level features and their associated distance (in this case Tanimoto distance). Based on the class of the similar images retrieved from the index, the input image is classified. The result for every single image feature, as well as the result of late fusion for all the selected image features is displayed on-screen. Late fusion means that each feature has an own classification step that is combined with other classifiers’ output for the final result. When classifying previously indexed images, an HTML page is created with a visual representation of all the classified images. When classifying a video sequence, the results are stored to a file in JSON format instead. The classification tool also determines the performance of the classification and calculates several evaluation scores such as recall, precision, weighted F1-score, etc.. For this to work, the input data must be labelled correctly before it is classified. This can either be done by prefixing the file names of the files in the index with ’p’ or ’n’ for positive and negative samples respectively, or by supplying separate indices with the command line options ’-P’ and ’-N’ for the input data. 3
http://opencv.org/
3.2
Detection Subsystem Usage Examples
In the following, some examples are presented of how to use the detection subsystem to classify input videos. java - jar classifier . jar \ -p / pos / index -n / neg / index \ -i / my / index -f JCD -f FCTH
This example shows how to classify images from the index /my/index using the image features JCD and FCTH, by finding the most similar images among the positive samples from /pos/index and the negative samples from /neg/index. For the calculation of the evaluation metrics, it is required that the images indexed in /my/index have names starting with ’p’ or ’n’ for positive or negative samples, respectively. This generates visual classification output in HTML format. java - jar classifier . jar \ -p / pos / index -n / neg / index \ -v / my_video . avi -f JCD
In our last example, a video file is supplied as input to the classifier. All video frames of this input video are classified by searching the most similar images among the positive samples from /pos/index and the negative samples from /neg/index using the global image feature JCD. In addition to the on-screen output, a JSON file is generated, which contains a list of all the positive frames and a list of all the negative ones. To process videos in real-time, we have also parallelized the classifier. Again, the number of threads created depends on the number of processors reported by the JVM. Each thread holds a separate instance of the classifier indices, but all threads share the same queue for the input data to be classified. Therefore, every image or video frame is only loaded once, is then processed by a single thread and the result is written to a shared data structure. This allows for all threads to operate independently, with only two critical sections, one for dequeuing the next input image and one for writing to the shared result data structure. When processing a video as input data, an additional thread is created for reading the video from a file and filling the input frame queue. The classifier tool further provides different options for weighting the count or distance score of similarity results. The different weighting methods can be chosen by adding the flag −m followed by the rank method that should be applied to the command. As default mode, no weight is set, and the classifier uses only the count per class. We support 3 additional weighting methods: (i) weighted by rank position, i.e., the weight is computing from the position in the returned ranked list; (ii) weighted by distance, which uses the Tanimoto distance from the search as weight; and (iii) weighted by average distance, which uses the average distance of all returned documents in the ranked list instead of the number of documents to calculate the weight. Moreover, various different combinations of global image features can be evaluated separately or combined in late fusion. This makes the tool ideal for experimenting with different approaches and finding an optimal set of features to use for a specific use case.
4.
DATA AND DEMO
To show how the system performs, we used the ASUMayo Clinic polyp database [5]. It is at the moment the largest publicly available dataset of colonoscopy videos. The dataset comes with a ground truth that indicates if a frame
Evaluation method EIR - standard MCB - standard EIR - LOOC MCB - LOOC
Precision 0.903 0.683 0.895 0.636
Recall 0.919 0.683 0.903 0.636
F1 score 0.910 0.683 0.899 0.636
Table 1: Evaluation results of the detection subsystem. The table shows the EIR system and majority class baseline (MCB) performance for the standard train test set split evaluation and LOOC evaluation. of a video contains a polyp in the colon or not. The polyps in the dataset are diverse and vary in terms of shape, color and texture. The dataset consist of 20 videos. 10 videos do not contain polyps at all, and 10 of them contain polyps in the whole video or parts of it. Table 1 gives an overview of all results. First, we split the dataset into test and training sets. The test set contains two separate videos that are not used in the training dataset. To measure the performance, we used precision, recall and F1 score. All the tests were conducted without a weighting method (default mode). In this first test, we achieved a precision of 0.903, a recall of 0.919, and an F1 score of 0.910. Remember that the best existing system, Polyp-Alert [13], achieved around 0.97 for the recall, but it was tested on another dataset. For these results, we used a fusion of the features JCD and OpponentHistogram, which we found to perform best in some additional experiments. The number of visual neighbours (size of the rank list returned by the search part of the classifier) was 71. The majority class baseline (MCB, all negative) is 0, 683 for precision, 0, 683 for recall and F1 score of 0, 683. To evaluate the robustness of the classifier, and to check if the good results were not just overfitting, we decided to perform a leave-one-out-cross-validation (LOOC) with all 20 videos of the dataset. In LOOC, all videos of the dataset are used to train the model except for one that is used as the test example. This is repeated, so that all the sample videos are excluded once. To be able to recreate the experiments and test the software, we added indexes to the official repository. We used the same features and number of visual neighbours as in the test before. For LOOC, the average precision is 0, 895, the average recall is 0.903 and the average F1 score is 0, 899. In comparison, the LOOC for the majority class baseline (all negative) has a precision of 0.636, a recall of 0.636 and a F1 score of 0.636. It is important to point out that we chose the class with the highest number for the majority vote baseline against the common practice to decide for the positive one. This makes it harder to outperform the baseline, but it also shows the real performance of the classifier. The results shows that our system performs well in cross validation and that it is robust and not overfitted for the dataset. We also want to point out that the classification time is very low. For a single frame, the time is around 30 milliseconds (it ranges from 10 to 30 milliseconds depending of features used and resolution of the video). To be able to do it in real time for videos with 30 frames per second, 33, 3 milliseconds is the deadline. In the best case, if we use a single feature, we can even get a classification time of around 10 milliseconds. The parallization is not yet optimized and we are working on an even faster system, but this is out of scope for this paper. Our system can also achieve higher a recall, at the cost
ongoing medical examinations, not only in post-examination analysis. A candidate for future improvement is therefore to run multiple classifiers of different diseases, like explored by Riegler et al. [10], in parallel by offloading the processing to multiple machines connected in a PCI Express network [8, 2]. This optimized version of the application will be able to dynamically allocate and release compute resources on demand from a pool of available GPUs. The use of multiple GPUs will also enable the system to run in real-time [7].
6.
ACKNOWLEDGMENT
This work has been performed in the context of the FRINATEK project EONS (#231687) and the BIA project PCIe (#235530) funded by the Norwegian Research Council. The authors also acknowledge Zeno Albisser for his contributions.
7. Figure 3: Visualisation of the output. A positive finding is marked red on the timeline of the video. of the precision (or vice versa). For example, we can easily increase the recall by using more visual neighbours. This makes it very interesting for the medical use case, because we can get a recall of 1, so that doctors can be sure that we do not miss a true positive example, while still saving them working time because the high precision allows to remove a considerable number of frames. One may criticize us for using only polyp detection at the moment, but the Mayo data set is currently the only medical data set for our use case that is big enough and publicly available to show our performance. The system can easily be extend to different diseases by simply using a separate classifier for each category, which will make it better parallelizable and more accurate (since it is late fusion and late fusion has been proven as being more accurate [3]). Possible ways to use the output of the classification tool are presented in the following figures. Here, we use it in a system that allows computer-aided diagnosis. It helps medical experts to find polyps in colonoscopies and also to save medical personnel’s working time because they do not have to analyse the whole video. Figure 3 shows the classification performance and how it is presented in a computer-aided diagnosis (CAD) tool for a standard colonoscopy video. One can see that the tool is able to classify videos in a way that can help experts to find irregularities but also help them reduce the time spent on video analysis.
5.
CONCLUSION AND FUTURE WORK
In this paper, we have presented an application for computeraided diagnosis that can support medical doctors in analysing colonoscopy videos. We showed that we can reach high performance in terms of processing time, which would make it possible to use the system during live colonoscopies. At the same time, we reach high detection performance. While extending the application to support multiple disease detection is trivial by adding more classifiers, the increased workload will also increase the total runtime of the detection algorithm. We strongly believe that if our tool is to be widely deployed and used by medical staff, it must be able to do classification and detection preferably during
REFERENCES
[1] Z. Albisser, M. Riegler, P. Halvorsen, J. Zhou, C. Griwodz, I. Balasingham, and C. Gurrin. Expert driven semi-supervised elucidation tool for medical endoscopic videos. In Proc. of MMSys. ACM, 2015. [2] L. B Kristiansen, J. Markussen, H. Kvale Stensland, M. Riegler, H. Kohmann, F. Seifert, R. Nordstrøm, C. Griwodz, and P. Halvorsen. Device lending in PCI express networks. In Proc. of NOSSDAV. ACM, 2016. [3] H. J. Escalante, C. A. Hérnadez, L. E. Sucar, and M. Montes. Late fusion of heterogeneous methods for multimedia image retrieval. In Proc. of ACM ICMR, pages 172–179. ACM, 2008. [4] M. Lux. Content based image retrieval with lire. In Proc. of ACM MM, pages 735–738. ACM, 2011. [5] Mayo-Clinic. Polyp dataset. http://polyp.grand-challenge.org/site/Polyp/AsuMayo/. [last visited, 04.04, 2016]. [6] R. Nawarathna, J. Oh, J. Muthukudage, W. Tavanapong, J. Wong, P. C. De Groen, and S. J. Tang. Abnormal image detection in endoscopy videos using a filter bank and local binary patterns. NC, 2014. [7] K. Pogorelov, M. Riegler, P. Halvorsen, P. T. Schmidt, C. Griwodz, D. Johansen, S. L. Eskeland, and T. de Lange. GPU-accelerated real-time gastrointestinal diseases detection. In Proc. of CBMS. IEEE, 2016. [8] K. Pogorelov, M. Riegler, J. Markussen, H. Kvale Stensland, P. Halvorsen, C. Griwodz, S. L. Eskeland, and T. de Lange. Efficient processing of videos in a multi auditory environment using device lending of GPU. In Proc. of MMSys. ACM, 2016. [9] M. Riegler, K. Pogorelov, P. Halvorsen, T. de Lange, C. Griwodz, P. T. Schmidt, S. L. Eskeland, and D. Johansen. EIR - efficient computer aided diagnosis framework for gastrointestinal endoscopies. In Proc. of CBMI, 2016. [10] M. Riegler, K. Pogorelov, M. Lux, P. Halvorsen, C. Griwodz, T. de Lange, and S. L. Eskeland. Explorative hyperbolic-tree-based clustering tool for unsupervised knowledge discovery. In Proc. of CBMI, 2016. [11] Y. Wang, W. Tavanapong, J. Wong, J. Oh, and P. C. de Groen. Computer-aided detection of retroflexion in colonoscopy. In Proc. of CBMS, pages 1–6. IEEE, 2011. [12] Y. Wang, W. Tavanapong, J. Wong, J. Oh, and P. C. de Groen. Near real-time retroflexion detection in colonoscopy. IEEE BMHI, 17(1):143–152, 2013. [13] Y. Wang, W. Tavanapong, J. Wong, J. H. Oh, and P. C. de Groen. Polyp-alert: Near real-time feedback during colonoscopy. CMPBM, 2015. [14] Y. Wang, W. Tavanapong, J. S. Wong, J. Oh, and P. C. de Groen. Detection of quality visualization of appendiceal orifices using local edge cross-section profile features and near pause detection. IEEE BME, 57(3):685–695, 2010.