690
IEEE TRANSACTIONS ON INSTRUMENTATION AND MEASUREMENT, VOL. 50, NO. 3, JUNE 2001
Computer-Based Automated Test Measurement System for Determining Magnetization Characteristics of Switched Reluctance Motors Adrian David Cheok, Member, IEEE, and Nesimi Ertugrul, Member, IEEE
Abstract—This paper describes a fully automated method of measuring the magnetization characteristics (flux linkage versus current and position) of switched-reluctance (SR) motors. The measuring scheme was developed using a graphical programming environment (LabVIEW), a data acquisition card, and external interface hardware. The graphical programming method allows a high degree of software modularity and provides the features needed for sensor zero adjustment, data acquisition and analysis, and automated presentation of results. Furthermore, the experimental setup described in this paper can be used to obtain the magnetization characteristics of other electromechanical devices. Experimentally measured results from a test SR motor using the scheme are presented in the paper. Index Terms—Automated, flux, measurement, reluctance motor.
I. INTRODUCTION
S
WITCHED reluctance (SR) motor drives have become the subject of considerable attention because of their inherent advantages in variable-speed motor drive systems. Due to lack of any windings or brushes on the rotor, SR motors have an exceptionally robust structure, a wide range of speeds, and can operate in very hostile environments [1]. They can also tolerate various fault conditions, which make them well suited to many commercial applications. Even though the motor’s operation is easily understood qualitatively, because of the magnetic nonlinearity, the SR motor is very difficult to model and simulate by analytical methods. The double saliency of the machine and its methods of excitation produce current, torque, and flux linkage waveforms, that are highly nonsinusoidal in both space and time. Moreover, since the motor normally operates under heavy saturation in its magnetic circuit, there is no closed- form equation as in other electrical machines. In essence, the SR motor never functions in steady-state operation. Therefore, it is necessary to have an accurate knowledge of the motor’s magnetic flux linkage characteristics, in order to predict the motor’s performance for research, design, and education purposes. It is also possible to calculate the magnetization curves without experimental measurement of the motor waveforms by using finite element methods [2], [3]. However, the accuracy Manuscript received March 14, 2000; revised January 26, 2001. A. D. Cheok is with the Department of Electrical and Computer Engineering, National University of Singapore, Singapore (e-mail:
[email protected]). N. Ertugrul is with the Department of Electrical and Electronic Engineering, The University of Adelaide, Adelaide, Australia. Publisher Item Identifier S 0018-9456(01)04395-9.
of such methods varies according to the choice of the elements used, and, in addition, they are computationally complex. Secondary effects, such as manufacturing irregularities, three-dimensional (3-D) fields, and nonuniform iron structure, are difficult to model. Furthermore, in all cases, experimental evaluation is eventually necessary. Therefore, a number of measuring techniques [4]–[11] have been proposed in the literature: 1) modeling of the magnetic characteristics via computer simulation; 2) measuring the flux linkage inside the motor directly via a magnetic sensor; 3) measuring inductance directly; 4) measuring flux linkage indirectly. However, as it will be explained below, the previous methods have practical difficulties such as the need for expensive sensors, low measurement bandwidth, measurement drift and error, laborious measurements, difficult test requirements, or lack of automation. In this paper, previous methods and their practical difficulties are detailed, and, then, the principles of new method are discussed. The hardware and software details of the new method are also given. Finally, the results of the method are shown in determining the magnetization characteristics of a test motor. II. PREVIOUS METHODS OF MAGNETIC CHARACTERISTIC DETERMINATION Although there is a need for the measurement of flux linkage versus current and position in switched reluctance and other motors, there is currently no readily available equipment on the market for this purpose. This has led to various methods being proposed. A. Measuring Flux Directly One method of determining magnetic flux is to employ magnetic sensors that measure the flux inside the motor directly [4], [5]. This method is not usually applied, as it is very expensive. It requires sensors to be installed when the motor is assembled, thus complicating the motor design. In addition, the flux sensor may not be able to measure a wide range of the flux variation accurately. B. Measuring Inductance Directly Another method for obtaining the motor characteristics is to measure the inductance of the motor directly, for various
0018–9456/01$10.00 © 2001 IEEE
CHEOK AND ERTUGRUL: COMPUTER BASED AUTOMATED TEST MEASUREMENT SYSTEM
values of currents. Motor inductance can be determined by ac bridge methods [6]. However, these are limited effectively to low-power rated machines, since they require additional equipment to superimpose an ac signal on a large dc current that is injected into the motor phase. In addition, the incremental inductance is normally measured with a sinusoidal signal with about 1 kHz frequency. This means the measurement will not be valid for all operating conditions because the motor current normally contains many high- and low-frequency harmonic components. Another disadvantage of this scheme is that, at each angle, a number of measurements must be made, which makes the procedure very time consuming. C. Measuring Flux Linkage Indirectly The most preferred method of obtaining the motor’s magnetization characteristics is to indirectly measure the stator flux linkage from voltage and current measurements on the phase winding circuit. In these methods, a voltage source is applied to the phase winding, and the terminal voltage and current are measured. If the phase resistance is known, then the flux linkage can be found from integration. In most integration techniques, the general principle is to apply a voltage pulse to the motor winding with the rotor clamped to some fixed position. The current will rise up to some level, and then the voltage is turned off. Throughout this time, integration takes place to determine the instantaneous flux linkage, and, in practice, analog and digital integration can be employed, as it will be discussed below. 1) Analog Integration: Analog integration techniques use operational amplifier circuits to integrate the signal. However, the accuracy of the result can be affected by drift in the amplifiers [7] and the need for accurate components. There is also the problem of temperature sensitivity of analog circuits and component imperfections. An analog integration scheme has been developed in [8] in which a large current pulse is injected into a motor phase with a discharging capacitor, and the corresponding flux linkage is measured with a hardware integrator. However in this method, there is the need for a power resistor that exactly matches the motor phase resistance. This would be difficult to obtain with good accuracy, and a different resistor would be needed for different motors. A small error in the resistance value could produce a significant difference between the actual and measured flux linkage. In addition, the temperature drift of the resistor would rarely match that of the phase winding resistance. This particular test method is also time consuming because a separate test must be done for each point of current and position. 2) Digital Integration: Digital integration involves converting the current and voltage measurements to digital data using analog-to-digital (A/D) converters. The digital data is then used in the integration. An advantage of evaluating the flux linkage by digital techniques is that the problem of drift and component imperfections found in analog integration can be eliminated. In addition, the digital flux measurements can readily be used in computer-based analysis and data graphing programs.
691
A novel digital integration scheme has been described in [9] that uses two different methods of determining the flux at a given current and angle. In the first method the rotor is kept in a fixed position, whilst the winding is excited with a sinusoidal voltage. This will produce a current and flux waveform in the motor that is essentially sinusoidal. Thus, a plot of flux versus current can be produced. The second method uses a dc current, whilst the rotor is rotated at a constant speed. If the current and speed are constant, then the flux linkage versus position at that constant current may be found. This is because, for constant current and speed, the flux linkage will be a function of time only (which for constant speed will make it a function of angle). Instead of changing position, the current level is changed for each test. A problem with this scheme is the great difficulty in maintaining a constant current and speed during the test. Some recently introduced digital methods have used a personal computer [10] or digital oscilloscope [11] to acquire the voltage and current waveforms, and then to integrate and plot the flux linkage. However, a disadvantage with these methods is that the measurement is still not fully automated in terms of controlling the motor voltage switching during the test, or providing calibration of the sensors. An improvement on the above digital methods was, therefore, made by constructing a PC-based digital integration system that provides control of both phase voltage turn on and turn off, and voltage and current measuring. In addition, the system constructed was very user friendly and the operator is only required to change and fix the rotor angle. The measurement test is fully automated, and produces a graphical output of the flux linkage curves for viewing and storage. The principles of the method will be described below. III. OPERATING PRINCIPLES OF THE METHOD The method implemented in the paper is based on indirectly measuring the stator flux linkage at standstill from the instantaneous voltage and the current measurements on the phase winding circuit. The voltage across a phase winding is given by (1) where instantaneous phase voltage; instantaneous phase current; instantaneous flux linkage of the winding; phase number ( = 1, 2, 3, 4 for the four-phase machine). Assuming the machine phases are decoupled from each other, the flux linkage characteristics of a motor phase can be obtained by rearranging and integrating (1) over a time period. If the total voltage drop of the external components, the winding resistance , and the value of the initial flux linkage are known, a general flux linkage equation per phase can be given by (2)
692
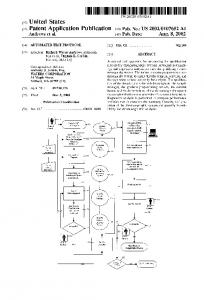
Fig. 1.
IEEE TRANSACTIONS ON INSTRUMENTATION AND MEASUREMENT, VOL. 50, NO. 3, JUNE 2001
Test system and cross section of the SR motor.
where is the total voltage drop including the switching device and the connections, and is the time interval. The voltage drop across the switching device and the resistance of the winding are usually assumed to be constant, whilst can be measured using an isolation amthe phase voltage plifier. Due to the very short integration time in the test, the value of the resistance is assumed to be constant during the integration. In addition, as will be explained below, the current is applied to the winding before each test so that the winding reaches a warm operating temperature. Hence, the resistance value measured in the warm winding condition is used in the integration. is very signifiThe initial value of the flux linkage cant only in electromagnetic circuits containing remnant fluxes, such as permanent magnets. However, in the switched reluctance motor, there are no magnets on the rotor or stator, and thus the initial flux value (when there is no current) will be zero. As discussed above, to perform the integration in (2), analog methods can be used. However, analog integration is not preferred due to the drift in the analog integrator circuits, and the expense of highly accurate component values (such as capacitors and resistors) in the practical integrator [12]. Thus, evaluating the flux linkage by digital techniques eliminates the error involved with the analog integrators. In the digital method, the phase resistance must be known to a good degree of accuracy, and if a step voltage is applied to a motor phase winding and the instantaneous current and voltage are measured, the flux linkage at any instant can be found. The digital integration and the measurement method implemented in this work have the following principal benefits over analog integration methods i) no drift in the integrator; ii) greatly reduced measurement time; iii) an almost continual range of data points available for further use, such as for performance prediction. IV. EXPERIMENTAL SETUP AND SOFTWARE A. Experimental Setup The test setup used to measure the magnetization characteristics (flux linkage curves) consisted of a 4-kW, four-phase SR motor, a rotor clamping and positioning device, an IGBT switching device, custom written LabVIEW [13] software, and a computer and data acquisition card. Fig. 1 illustrates the com-
plete block diagram of the automated experimental setup and the cross section of the SR motor under test. The dc voltage supply that was switched onto the motor phase consisted of a three-phase rectifier supplied by a three-phase auto-transformer. The applied dc voltage was adjusted so that the peak current reached during the test did not exceed approximately 22 A, which is a higher current level than all operating currents for the test motor. The hardware used in the test facility included an IGBT switching device (Fig. 1) that was used to switch on the dc supply to the motor phase winding. The IGBT was controlled by the LabVIEW based custom written software, which provides a control signal via the digital output port of the data acquisition board. In the test setup, the phase current and the phase voltage were measured by using a Hall effect device and an isolation amplifier respectively, which present small amplitude voltage signals to the data acquisition (DAQ) board. A PC bus based plug-in DAQ board fully compatible with the LabVIEW software was used to collect data, as well as to provide digital control signals. The board used had a maximum sampling rate of 100 kS/s, and provided a 16-bit sampling A/D converter with up to eight differential inputs. The inputs are software configured for either 0 to 10 V or 10 to 10 V operation. In addition, each channel had software programmable gains of 1, 2, 5, 10, 20, 50, and 100. Also, provided on the board were eight digital input/output lines and two 16-bit D/A converters. As shown in Fig. 1, the motor clamping and positioning device consists of a disc, attached to the motor’s shaft, with small holes on the outer diameter spaced by one mechanical degree. This arrangement is used to fix the rotor position to a given angle by inserting a pin into the given angle pinhole, and to lock the disc with an attached clamp. Note that the clamping/disc device must be carefully designed and assembled so that errors in rotor position are minimized. In addition, the clamping action must be strong enough to hold the rotor through the impulse torque, attempting to align the rotor with the rotor pole with the nearest stator pole, when current is applied. A photograph of the rotor clamping device attached to the SR motor shaft is shown in Fig. 2. As the test motor has eight poles and six rotor poles, the electrical angle is 30 , and therefore, the complete characteristics of the motor can be obtained by measuring only 30 . However, the characteristics of a full 360 revolution may be measured, if desired, to check for phase asymmetry.
CHEOK AND ERTUGRUL: COMPUTER BASED AUTOMATED TEST MEASUREMENT SYSTEM
693
Fig. 2. Rotor clamping device constructed for measurement test.
B. Software The general steps carried out by the algorithm of the LabVIEW-based software are shown in Fig. 3. The PC-based system initiates the test on the SR motor and the following steps are performed. i) An offset error adjustment of the voltage and current sensors is performed. ii) The motor phase voltage is switched on, and then switched off, and the instantaneous voltage and current are acquired. iii) The flux linkage is calculated. iv) The graphical output is produced for viewing and storage purposes. v) The rotor is rotated by one mechanical degree and the above process is repeated. The LabVIEW environment is based on the concept of virtual instruments (VIs), which can be defined as layers of software and hardware, added to a personal computer, in such a way that the computer acts as a custom-designed instrument. The VIs consist of two main elements which are a front panel and a block diagram. The front panel is a graphical-user interface used for data presentation and control inputs, and can be highly customized by the user for their specific application. The front panel of the software developed in this paper allows the user to enter the resistance of the motor phase winding and displays the graphs of the current, voltage, flux linkage versus time, and also displays flux linkage versus current graphs (Fig. 4). The layer behind the front panel is called the block diagram and is essentially the program that implements the user-defined analysis, acquisition, and control. Four principal steps of the block diagram are followed in the designed algorithm.
Fig. 3.
Flowchart of the LabVIEW-based software.
i) In the first step, the user is asked to check that the rectified dc power supply is off so that the current sensor can be calibrated. ii) The second step of the block diagram performs the calibration (offset error zero adjustment) of the current sensor with a calibration sub-VI, and informs the user when this step is finished. This is required in practical systems since Hall effect current sensors normally have some offset error, which should be removed for higher measurement accuracy. Furthermore, as the offset error can drift over time, the sensor must be calibrated
694
IEEE TRANSACTIONS ON INSTRUMENTATION AND MEASUREMENT, VOL. 50, NO. 3, JUNE 2001
(a)
(b) Fig. 4. Front panel (screen shots) of the magnetization characteristic measurement test. (a) Measuring characteristics with motor phase in linear region. (b) Measuring characteristics with motor phase in saturation region.
periodically to obtain accurate results. The calibration sub-VI reads 50 random values from the current sensor when the applied current is zero, and averages the values to determine the offset voltage of the Hall effect current sensor. After each calibration, the data measured is automatically corrected using the offset calibration factor. The front panel also displays a plot of the current values and their mean during the execution of this step. The voltage measurement circuit may also have some small offset error, due to offset in the ground plane of
the voltage measurement circuit. Hence, a similar offset adjustment is also made with respect to the voltage measurement circuit. iii) In the third sequence of the block diagram, the user is then instructed to set the rotor position (using the rotor clamping device), to turn on the main dc voltage supply to the motor, and to press the on screen button to start the test. The user is requested to enter the angle that is being measured (for graphical plotting purposes) and the maximum current required.
CHEOK AND ERTUGRUL: COMPUTER BASED AUTOMATED TEST MEASUREMENT SYSTEM
695
iv) In the final step, the IGBT is turned on and off repeatedly for a short period. This was executed so that the current would flow in the motor phase, and thus the winding would be at a warm operating temperature before the actual test was performed (so that the actual phase resistance corresponded more closely to the previously measured phase resistance that was taken after motor running). The IGBT is turned on via a low-level sub-VI that controls the state of the digital output port. After this is performed, a sub-VI turns on the IGBT again, the voltage and current are measured and then the IGBT is turned off. The measured voltage and current are integrated to calculate the flux linkage by a sub-VI that performs the integration (using the measured values and sampling period). From this, the user is presented with on-screen plots of current, voltage, flux linkage, and flux linkage versus current. These values are also automatically stored numerically onto the computer disk drive. A separate file is created to store a set of data regarding the rotor position. The file name is also automatically created in such a way that it indicates the measured rotor position. A safety feature has also been added to the software so that if any error occurs, the IGBT is automatically turned off. This ensures against a sustained high current if the IGBT is left on during some software or data overflow error.
V. TEST RESULTS As stated above, the flux linkage versus current curves for each test performed on a single rotor angle is automatically saved to a file at the end of each test. A set of experimental results is given in Fig. 5. The figure illustrates the measured instantaneous current, the estimated flux linkage waveforms [based on (2)], and the flux linkage versus current curve for the aligned rotor position (when the rotor pole is fully aligned with the stator pole). In these results, one can observe the distinct saturation seen on the magnetization characteristics when the current is above approximately 6A. A number of tests are performed, and the flux linkage characteristics are plotted on the same graph to show the complete magnetization characteristics of the SR motor (Fig. 6). In the four-phase motor that was tested, the electrical cycle is 30 , and hence the magnetization curves are symmetrical for each rotor angle variation of 30 from alignment to unalignment. Therefore, the motor flux linkage characteristics are plotted over 30 , and, in this case, 30 is defined as the unaligned position, while 0 is defined as the aligned position. To evaluate the accuracy of the test, a comparison (Table I) was made with [14], where the flux linkage curve for the aligned position was shown for the identical SR motor, 4 kW, Tasc drives. It can be seen from the table that the values are in very good agreement. The closeness of the values suggests that a high confidence can be placed on the results obtained by the automated measurement method. However, due to small manufacturing irregularities in motors, it should also be emphasised
Fig. 5 Set of experimental results for the aligned rotor position. (a) Waveforms of measured current. (b) Estimated flux linkage. (c) Flux linkage versus current.
Fig. 6. Experimentally measured flux linkage curves of the four-phase test motor.
696
IEEE TRANSACTIONS ON INSTRUMENTATION AND MEASUREMENT, VOL. 50, NO. 3, JUNE 2001
TABLE I COMPARISON OF MEASURED FLUX LINKAGES AT ALIGNED POSITION
here that even the same model motor can be expected to have slightly different magnetic characteristics. VI. CONCLUSION An automated and user-friendly experimental method for the measurement of the magnetization characteristics of the SR motor was explained in the paper. The determination of such characteristics is necessary for performance evaluation and advance control of SR motors. The new measurement scheme is based on LabVIEW software, which provided a graphical programming environment, allowed a high degree of software modularity, and provided the features needed for acquiring and analyzing data, control, and presentation of the results. The designed software achieves a very user-friendly environment, in which the operator was only required to change and fix the rotor angle, and then instruct the program to begin testing. During each measurement test, automatic sensor calibration is carried out, and a graphical output of the flux linkage curves for viewing and for storage is produced. In addition, the method can be used to determine the magnetization characteristics of any other electromagnetic device, such as relays, actuators, and even permanent magnet machines. REFERENCES [1] H. H. Moghbelli, M. Moallem, and C. M. Ong, “Operational characteristics of switched reluctance motor drives,” in Proc. IEEE Int. Symp. Ind. Electron., 1992, pp. 643–647. [2] H. H. Moghbelli, “Prediction of the instantaneous and steady state torque of the switched reluctance motor using FEM with experimental results comparison,” Electr. Mach. Power, vol. 19, pp. 287–302, 1991. [3] A. Omekanda, C. Broche, M. Crappe, and R. Baland, “Prediction of the steady state performance of the switched reluctance motor using quadratic biem-FEM field solutions in the linear model,” in Proc. ICEM, Paris, France, 1994, pp. 59–64.
[4] J. C. Prescot and A. K. El-Kharashi, “A method for measuring self-inductance applicable to large electrical machines,” Proc. Inst. Elect. Eng. A, vol. 106, pp. 169–173, 1959. [5] R. Krishnan and P. Majeru, “Measurement and instrumentation of a switched reluctance motor,” in Proc. IEEE Ind. Applicat. Soc. Annu. Meeting, 1989, pp. 116–121. [6] P. P. Acarnley and R. Aggarwal, “Inductance and static torque measurements in small reluctance type machines,” in Proc. UPEC, Nottingham, U.K., 1988. [7] T. Williams and R. Carter, “Measurement of machine inductances using an operational amplifier integrator,” Int. J. Elect. Eng. Educ., vol. 10, pp. 177–181, 1972/73. [8] W. F. Ray and F. Erfan, “A new method of flux or inductance measurement for switched reluctance motors,” in Proc. Power Electron. Variable Speed Drives, IEE Conf. Pub. 399, 1994, pp. 137–140. [9] A. Ferrero and A. Racati, “A digital method for the determination of the magnetic characteristic of variable reluctance motors,” IEEE Trans. Instrum. Meas., vol. 39, pp. 604–608, Aug. 1990. [10] V. N. Walivadekar, S. K. Pillai, S. S. Sadistap, and R. Bhandhari, “PC based data acquisition system for measurement of switched reluctance motor (SRM),” in Proc. Int. Conf. Power Electron., Drives Energy Syst. Ind. Growth, New Delhi, India, 1996, pp. 957–963. [11] V. Ramanarayanan, L. Venkatesha, and D. Panda, “Flux-linkage characteristics of switched reluctance motor,” in Proc. Int. Conf. Power Electron., Drives Energy Syst. Ind. Growth, New Delhi, India, 1996, pp. 281–285. [12] Nonlinear Circuits Handbook, Analog Devices, Norwood, MA, 1976. [13] National Instruments, LabVIEW User Manual for Windows, 1996. [14] P. W. Lee and C. Pollock, “Flux linkage estimation in electrical machines,” in Proc. ICEM, Paris, France, Sept. 1994.
Adrian David Cheok (M’92) received the B.S. (Hons. First) and the Ph.D degrees from the University of Adelaide, Australia, in 1993 and 1998, respectively. From 1996 to 1998, he worked at Mitsubishi Electric Corporation, in the Transmission and Distribution, Transportation Systems Center, Amagasaki Japan. Since 1998, he has been Assistant Professor in the Department of Electrical Engineering, National University of Singapore. His research interests include power electronics and motor drives, fuzzy logic and soft computing, nonlinear modeling and control, noise and EMI, and digital signal processing.
Nesimi Ertugrul (M’95) received the B.Sc. and M.Sc. degress in electrical and in electronic and communication engineering from the Istanbul Technical University, Istanbul, Turkey, in 1985 and 1989, respectively, and the Ph.D. degree from the University of Newcastle upon Tyne, U.K., in 1993. He joined the University of Adelaide, Australia, in 1994, where he is a Senior Lecturer. His research topics include rotor position sensorless operation of brushless permanent magnet and switched reluctance motors, real-time control of electrical machines, fault-tolerant motor drives, and power electronics systems. He is currently engaged in research in the field of interactive computer-based teaching and learning systems involving object-oriented programming and data acquisition.