www.nature.com/scientificreports
OPEN
received: 20 April 2016 accepted: 12 September 2016 Published: 05 October 2016
Computer keyboard interaction as an indicator of early Parkinson’s disease L. Giancardo1,*, A. Sánchez-Ferro1,2,3,4,5,*, T. Arroyo-Gallego1,6, I. Butterworth1, C. S. Mendoza1, P. Montero7, M. Matarazzo2,3,4,5, J. A. Obeso2,3,4, M. L. Gray1,8 & R. San José Estépar9 Parkinson’s disease (PD) is a slowly progressing neurodegenerative disease with early manifestation of motor signs. Objective measurements of motor signs are of vital importance for diagnosing, monitoring and developing disease modifying therapies, particularly for the early stages of the disease when putative neuroprotective treatments could stop neurodegeneration. Current medical practice has limited tools to routinely monitor PD motor signs with enough frequency and without undue burden for patients and the healthcare system. In this paper, we present data indicating that the routine interaction with computer keyboards can be used to detect motor signs in the early stages of PD. We explore a solution that measures the key hold times (the time required to press and release a key) during the normal use of a computer without any change in hardware and converts it to a PD motor index. This is achieved by the automatic discovery of patterns in the time series of key hold times using an ensemble regression algorithm. This new approach discriminated early PD groups from controls with an AUC = 0.81 (n = 42/43; mean age = 59.0/60.1; women = 43%/60%;PD/controls). The performance was comparable or better than two other quantitative motor performance tests used clinically: alternating finger tapping (AUC = 0.75) and single key tapping (AUC = 0.61). Parkinson’s disease (PD) is the second most prevalent neurodegenerative disorder in the western world1. Subtle motor manifestation can precede the clinical diagnosis by several years and continue throughout the course of the disease, however they often go unnoticed particularly in the early stages2–4. After this point of diagnosis, patients typically follows a progressive course leading to severe disability and shortening life span5,6. A number of drugs are available for symptomatic relief, including levodopa, dopamine agonists and MAO-B inhibitors7. These types of treatments administered by a specialist significantly lowered the risk of hip fractures, admissions to skilled nursing facility and increased survival rates8. An accessible way to precisely quantify PD motor signs in the patient’s home has the potential to bring significant benefits to therapy management, better diagnosis and possibly earlier detection of the symptoms and enabling the development of new therapies9,10. The current standard to evaluate motor signs is the Unified Parkinson’s Disease Rating Scale part III (UPDRS-III)11, a compound clinical score that ascertain various motor aspects of the disease, such as rigidity, resting tremors, speech and facial expression among others. This scale requires trained medical personnel and attendance of the patient in the clinic, limiting the ease and frequency with which it can be administered. Longitudinal clinical studies measuring motor signs typically have a time resolution at least 3 months12. Outside the clinical study settings, patients report visits with their neurologist every 2 to 6 months13. Thus, the time frame over which a clinician can act on information is intrinsically many months, while many
1 Madrid-MIT M+Visión Consortium, Research Laboratory of Electronics, Massachusetts Institute of Technology, Cambridge, MA, USA. 2HM Hospitales - Centro Integral en Neurociencias HM CINAC, Móstoles, Madrid, Spain. 3CEU San Pablo University, Campus de Moncloa, Calle Julián Romea, 18, 28003 Madrid, Spain. 4Centro de Investigaci ´on Biom´edica en Red, Enfermedades Neurodegenerativas (CIBERNED), Madrid, Spain. 5Instituto de Investigación Hospital 12 de Octubre (i+12), Madrid, Spain. 6Universidad Politécnica de Madrid, Spain. 7Movement disorders unit, Hospital Clinico San Carlos, Madrid, Spain. 8The Institute of Medical Engineering and Science, Massachusetts Institute of Technology, Cambridge, MA, USA. 9Brigham and Women’s Hospital, Harvard Medical School, Boston, MA, USA. *These authors contributed equally to this work. Correspondence and requests for materials should be addressed to L.G. (email:
[email protected])
Scientific Reports | 6:34468 | DOI: 10.1038/srep34468
1
www.nature.com/scientificreports/
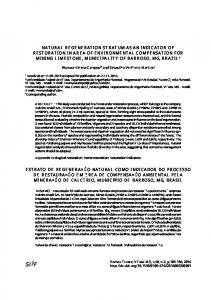
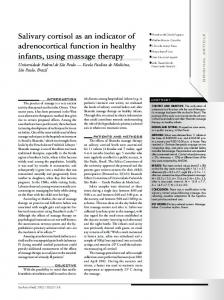
Figure 1. Pipeline of the algorithm to generate the neuroQWERTY score (nQi) from the hold time (HT) series. (1) The HT time events are split by non overlapping 90 seconds windows to create the Bi sets. (2) From each independent Bi set, a 7-element feature vector, xi is computed: 3 features that represent HT variance, and 4 features that represent a histogram of HT values. Any Bi sets with fewer than 30 HT values were ignored. (3) For each feature vector, xi, a single numerical score, nQi, is generated using an ensemble regression approach. Each unit in the ensemble regression includes a linear Support Vector Regression step trained on the Unified Parkinson’s disease rating scale part III (UPDRS-III), the clinical score for evaluating PD motor symptoms. The Support Vector parameter estimation was done using a separate data set. A cross validation strategy with two data sets (de novo PD and early PD) was employed (see Fig. 4). (4) For the analyses herein, an average nQi score was computed for each subject tested. More information can be found in the Methods.
aspects of PD can fluctuate broadly in time, from hours to months, thus making higher frequency PD signs quantification tools an unmet medical need for PD management14. Digital technologies for objectively quantify PD motor signs exist and new ones are being developed15. One of the most frequently used is finger tapping, where subjects are asked to intermittently press buttons as fast as possible for a given time16. More recently, wearable inertia measurement units (IMUs) have been employed to measure information about gait, posture, tremors, bradykinesia (slow movements) and dyskinesias (involuntary movements)17,18. Typically, multiple sensors are applied on various areas of subject’s body who is then asked to perform a particular task. IMUs can also be found in modern smartphones, which has motivated attempts to combine finger tapping and IMUs in a single device, in some cases also including voice utterances tests19. In the last 30 years, typing cadence (also known as keystroke dynamics) has been studied by various research groups and employed commercially as a biometric, mainly as a way to replace or strengthen passwords20,21. Applications to the medical field are almost non-existent, one exception are Austin et al. who used the typing speed in login sessions to evaluate sensory-motor speed in healthy subjects22. In our previous work23, we were able to detect a pattern from keystroke dynamics that could detect a state of psychomotor impairment with a cohort of 14 healthy subjects. The state of psychomotor motor impairment was induced via a sleep inertia paradigm, i.e. the abrupt awakening during sleep. The algorithm developed was able to classify the change of state from “awaken” to “sleep inertia” with an Area Under the ROC curve of 0.93/0.91 and performance significantly superior over typing speed alone. In this work, we demonstrate the ability to distinguish PD patients at the early stage of the disease from comparable healthy controls. We monitor their natural interactions with standard keyboards, recording the hold time (HT) occurring between pressing and releasing a key while the user is typing in a standard word processor. Then we convert the series of HTs to the numerical neuroQWERTY index (nQi) employing a novel algorithm. The system automatically learns by example the PD typing patterns by comparing the PD subjects with a control group with similar typing skills and education. Our approach does not require information about the text being typed or the actual key being pressed, only the hold time for each key (typically around 100 milliseconds)24,25. Figure 1 shows how the neuroQWERTY index is computed. First, the HT time series generated from the typing task is split by non overlapping windows, then 7 features are computed from the HT data set in each independent Scientific Reports | 6:34468 | DOI: 10.1038/srep34468
2
www.nature.com/scientificreports/
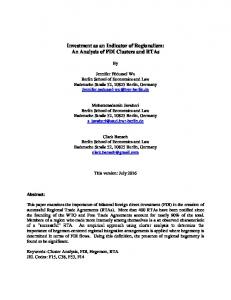
Figure 2. Discriminative performance of nQi. For each subject, an average nQi score was computed (as illustrated in Fig. 1) from the hold time series measured during the typing task. Box plots visualize first, third quartiles and medians; the ends of the whiskers represent the lowest (or highest) value still within 1.5-times the interquartile range. (a) Group level comparison between PD and controls with the combined dataset between all 43 controls and 42 PD subjects. The control group is significantly different from the PD group (p = 0.001). (b) Group level comparison between controls, de-novo PD subjects (recently diagnosed with PD and never taken PD medications; average time since diagnosis 1.6 years) and early PD subjects (average time since diagnosis 3.9 years; on PD medication, but no medication for the 18 hours before the typing test). Both PD sub-groups are significantly different from the controls group (de-novo/controls p = 0.022, early PD/controls p = 0.003). The statistical significance of the discriminative performance is computed with a logistic regression model including sex, age, years of education and typing skills as co-variates (see suppl. material Fig. S.3).
window, 4 features representing estimates of the absolute HT probability, and 3 representing different aspect of the HT variance. These features are used as the input to an ensemble regression algorithm based on ε-Support Vector Regression and previously trained on an independent dataset. The output of the regression algorithm is a numerical score (one score for each of the non-overlapping HT data sets). Finally, for the typing tests described here, we average the sequence of numerical scores to create a quantitative numerical index for each subject which is evaluated against the diagnostic category (PD or healthy controls) and compared to two quantitative motor tasks typically used in clinical studies.
Results
Figure 2(a) shows the box plots of the nQi scores computed on the typing tasks for between 43 controls and 42 PD subjects. Each box plot uses a single data point for each subject, thus allowing a meaningful comparison between the groups. After accounting for sex, age, years of education and typing speed (a common metric for typing skills) with a logistic regression model, the difference between the two groups measured with nQi are statistically significant (p-value = 0.001, see suppl. material Fig. S.3). In Fig. 2(b), the PD group is split into early PD (already-medicated PD group evaluated 18 hrs after the last dose) and de-novo (recently diagnosed group who never took any medication related to PD). These two subgroups show a statistically significant difference from the control group (de-novo/controls p = 0.022, early PD/controls p = 0.003) and similarly to the previous experiment, the logistic regression model accounted for sex, age, years of education and typing speed (see suppl. material Fig. S.3). In Fig. 3 and Table 1, we compared the nQi scores with quantitative metrics evaluating upper limbs motor functions, i.e. finger tapping. Finger tapping is typically used in clinical trials and involves pressing one or two buttons as fast as possible for a short period of time. We evaluated two common variations of the finger tapping test: “single key tapping”26 and “alternating finger tapping”16. Receivers operating characteristic (ROC) curves are used to compare the metrics. nQi showed the best classification performance with an Area under the Receiving Operating Characteristic Curve (AUC) of 0.81 (0.72–0.88 95% CI, p-value = 0.001), alternating finger tapping had a lower performance with an AUC = 0.75 (0.64–0.83 95% CI, p-value