theoretically demonstrated in only two models (Meyer & Stryer,. 1988; Goldbeter et al. .... centration (Joseph et al., 1989; Willems et al., 1989; Meyer et al.,. 1990).
Biochem. J. (1990) 271, 835-838 (Printed in Great Britain)
835
Computer simulation of a cytosolic calcium oscillator Stephane SWILLENS* and Dany MERCAN Institut de Recherche Interdisciplinaire, Universite Libre de Bruxelles, Campus Erasme, B-1070 Brussels, Belgium
A
interpretation of existing data permits
route de Lennik
808,
to define a model capable of accounting for agonist-induced Ca2, one Ca2+ store, which contains Ca21 channels controlled by inositol 1,4,5-trisphosphate and Ca2. Computer simulations may generate different experimentally new
us
oscillations in the cytosol of electrically non-excitable cells. The model only requires
observed patterns of Ca2+ oscillations.
INTRODUCTION Discharge of internal Ca2+ stores in the cytosol of electrically non-excitable cells can be triggered by an elevated level of intracellular inositol 1,4,5-trisphosphate (IP3) (Berridge & Irvine, 1989). As observed in single-cell systems, a continuous agonist
Agonist
stimulation of IP3 formation may produce periodic Ca2+ spikes with a frequency in the range of 1-10/min (Berridge & Galione, 1988). The oscillatory pattern of the Ca2+ response depends on the types of cell and agonist. For instance, in hepatocytes the frequency, but not the amplitude, is modulated by the vasopressin concentration (Woods et al., 1986), whereas in pancreatic acinar cells the amplitude increases with cholecystokinin concentration (Tsunoda et al., 1990). Several models have been proposed to delineate feedback loops allowing Ca2+ oscillations (Berridge & Galione, 1988). However, the existence of a cytosolic Ca2+ oscillator has been theoretically demonstrated in only two models (Meyer & Stryer, 1988; Goldbeter et al., 1990). Here another model, based on the interpretation of published experimental data, is analysed. Computer simulations demonstrate that this model can generate observed characteristics of the IP3-induced Ca2+ response.
THEORY AND RESULTS The proposed model defined in Scheme 1 is based on welldocumented facts (Berridge & Irvine, 1989). The interaction of an agonist with its receptor (R in Scheme 1) stimulates the hydrolysis of phosphatidylinositol 4,5-bisphosphate (PIP2) by the G (guanine-nucleotide-regulatory)-protein (G in Scheme 1)coupled phosphoinositidase C (PIC) and thus accelerates the formation of diacylglycerol (DAG) and IP3 (reaction 1, Scheme 1). IP3 is phosphorylated to inositol 1,3,4,5-tetrakisphosphate (IP4) (reaction 3) by a 3-kinase (3-kin in Scheme 1), the Vmax of which is increased by Ca2+ (reaction 4) (Takazawa et al., 1989). Both IP3and IP4are dephosphorylated by a 5-phosphatase (5-ph in Scheme 1) (reactions 2 and 9). Only two pools of Ca2+ are considered, namely the cytosol and an IP3-sensitive store. Indeed, in contrast with the other systems theoretically studied (Meyer & Stryer, 1988; Goldbeter et al., 1990), our model will not require other sources of Ca2+ to account for Ca2+ oscillations. The identity of the IP3-sensitive store is still uncertain, but, by definition, the membrane of such a vesicle contains IP3 receptors which are linked to Ca2+ channels. The efflux of Ca2+ from the vesicle (reaction 5) is accelerated by IP3 (reaction 6). On the other
Scheme 1. Definition of the model Further abbreviations: R, receptor; G, G-protein; 3-kin, 3-kinase; 5-ph, 5-phosphatase. [+] and [-] stand for positive and negative controls respectively.
hand, the store is refilled by an ATP-driven Ca2+ pump (reaction 8). On the basis of this first description (i.e. ignoring for the time being reactions 7 and 10), the kinetic equations describing the time courses of free cytosolic concentrations of 1P3, IP4 and Ca are as follows:
d[P3]= dt
(1)
Abbreviations used: IP3, inositol 1,4,5-trisphosphate; PIP2, phosphatidylinositol 4,5-bisphosphate; PIC, phosphoinositidase C; G-protein, guaninenucleotide-regulatory protein; 1P4, inositol 1,3,4,5-tetrakisphosphate; DAG, diacylglycerol; [Ca21]t.t, total amount of Ca21; ISP3, inositol trisphosphothioate; ED50, effective dose producing half-maximal effect. * To whom correspondence and reprint requests should be sent.
Vol. 271
S. Swillens and D. Mercan
836 d[IP4] = vf-v9 dt
(2) (2)
d[Ca2+] /,IN (3) dt vi is the activity of an enzyme or channel involved in reaction i and acting on a certain component X ( o in Scheme 1).f, is the fractional effect on reaction i of a component X due to the interaction described by reaction j (------_ in Scheme 1). It is assumed that the reactions obey the Hill equation and thus are characterized by an activity v=
V/[l+(K/[X])h]
or by an effect
f= I/[ I+ (K/[X])'] where V, K and h are defined as maximal activity, effective dose producing half-maximal effect (ED50) and Hill coefficient respectively. The model assumes that the total amount of Ca2' ([Ca2+1]50,) is constant and is distributed between the cytosolic pool and the IP3-sensitive stores. Theoretical analysis shows that this model cannot generate Ca2+ oscillations, despite the existence of the Ca2+ feedback loop (reaction 4). Only stable stationary states are obtained for any value of the kinetic parameters. Theoretical studies on the nature and multiplicity of stationary states came to the conclusion that stable oscillations may be produced by the adequate combination of a negative feedback and an autocatalytic process (Tyson, 1975). Now we will show that an autocatalytic process may be defined on the basis of the interpretation of published observations. Joseph et al. (1989) reported that the addition of Ca2+ to a cerebellum microsomal preparation diminished both Ca2+ efflux and IP3 binding to the receptors. They suggested that cytosolic Ca2+ may contribute to Ca2+ oscillations by inhibiting the IP3-induced Ca2+ efflux, allowing the refilling of the stores. However, this interpretation is not supported by the mathematical analysis of the model, which again presents stable steady states (simulation not shown). Now it was shown in the same study that the uptake of Ca2+ by the vesicles is directly related to the external Ca2+ concentration. Thus another interpretation of the data is that Ca2+ efflux is inhibited by intra- rather than extra-vesicular Ca2+, even in the submicromolar range, since this efflux must be corrected for the variable calcium load of the vesicle. This interpretation is supported by the study of Willems et al. (1990), which showed that the IP3-induced Ca2+ efflux from vesicles preloaded with submicromolar concentrations of Ca2+ does not depend on the extravesicular Ca2+ concentration in the submicromolar range. This proposed negative control of calcium efflux (reaction 7 in V,
=
6,uM/min
v,
=
7.5 uM/min
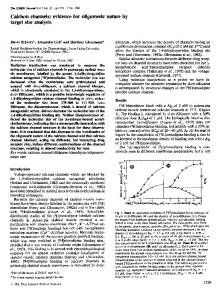
Scheme 1) may be viewed as an autocatalytic process, since a decrease of Ca2l concentration in the vesicle, and consequently an increase of free Ca2+ concentration, favours the Ca2+ efflux. On the basis of this description, eqn. (3) becomes: d[Ca2+] - VIf/ dt Even in the absence of any co-operativity in the considered reactions (i.e. all the Hill coefficients are equal to 1), the model may generate Ca2l oscillations (Fig. 1), at least if the kinetics of Ca2+ movements across the vesicle membrane are faster than the kinetics of IP3 metabolism. Sustained oscillations only appear at IP3 production rates (v,) between two critical values. When Ca2+ movements are relatively slow, the oscillations exhibit a sinusoidal shape, with a period not obviously dependent on v, (Figs. la-ic). By contrast, the peak and baseline of the oscillation are both modulated by v1. Fig. 1(c) is reminiscent of the Ca2+ response observed with acinar pancreatic cells in the presence of 0.1 /M-acetylcholine (Osipchuk et al., 1990). If Ca2+ movements are relatively faster, the amplitude becomes independent of v1, but an enlargement of the peak showing an unrealistic shape is observed (not shown). Thus the proposed model contains the required cross-coupling between IP3 and Ca2+ to account for a cytosolic Ca2+ oscillator, but cannot generate certain oscillatory patterns which are experimentally observed. It has been repeatedly reported that each cell of the same population is characterized by a unique and reproductible pattern of oscillations described by their amplitude, frequency and shape (Kawanishi et al., 1989; Rooney et al., 1989; Tsunoda et al., 1990). This observed variability is probably a consequence of a high sensitivity of the Ca2+ response to intercellular variations of the value of kinetic parameters, which could be due to different cellular contents of certain effectors. Such a high sensitivity is present in control processes exhibiting positive co-operativity. It has to be noted that positive co-operativity has been introduced in both models previously proposed to account for Ca2+ oscillations (Meyer & Stryer, 1988; Goldbeter et al., 1990). Interestingly, both IP3 binding to the Ca2+-channel-linked receptor and Ca2+ efflux exhibit a positively co-operative dependence on IP3 concentration (Joseph et al., 1989; Willems et al., 1989; Meyer et al., 1990). The Hill coefficients deduced from these data are close to 2. [Incidentally, the Hill coefficient of 4 reported by Meyer et al. (1990) was not obtained by means of the Hill equation.] We have thus investigated how the oscillatory pattern is modulated by the introduction of positive co-operativity in different reactions of the model. In summary, positively co-operative inhibition of Ca2+ flux by intravesicular Ca2+ leads to an abrupt switch between a phase of slow Ca2+ increase and the sharp Ca2+ spike. The dependence of oscillation frequency on IP3 production rate V,
=
9 pM/min
(b)
(a)
1.0 0.8
0.6 0.4
0 CD
0.2 0 1
min
Fig. 1. Oscillatory patterns of cytosolic Ca2" obtained with the model defined by eqns. (1) and (3') The kinetic equations were numerically integrated (fourth-order Runge-Kutta method with a step size of 0.001 min) using the following parameter values: [Ca2+],Ot 1 ,UM; basal v, = 1.75 /LM/min; v2 = 37.5 /M/min; K2 = 25 ,UM; V3 = 45 ,#M/min; K3 = 0.6 ,uM; K4 = 1 /M; v5 = 1200 tiM/min; K5 0.01 ,UM; K6 1.5 ,UM; K7 i-5 ,um; v8 = 300 ,uM/min; K. = 0.01 /tM. All the Hill coefficients (hi) are equal to 1. The rate of 1P3 production was set to three different stimulated levels (a-c) during the indicated period. =
=
=
1990
Simulation of a cytosolic Ca2+ oscillator V1
=
837 v-= 1.4 pM/min
1 pummin
=
v,
2 pM/min 2
1.0
(a)
Z. 1-
*-
.--i
I
0.8 0.6
0.4
a-
0.2
:0
0 1 min
(d)
6.0
1.0 -
(e)
1.0
(f)
.0.8 7 C
*0.6
3.0
a70.
i
0.6 'a.
E2.0
/
.
0
1
7AAAAA
0.2 E E O
1.0 2
3
4
04
0.2 0
6
5
0.4
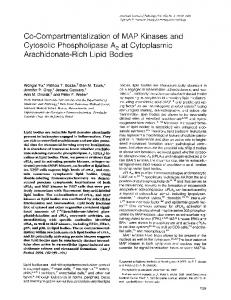
1 min v, (M/mmin) Fig. 2. Oscillatory patterns of cytosolic Ca2l and IP3 obtained with the model defined by eqns. (1) and (3') The kinetic equations were numerically integrated (fourth-order Runge-Kutta method with a step size of 0.002 min) using the following parameter values: [Ca2"],OJ = I1/M; basal v1=0.36 /M/min; v2= 15/tM/min; K2=25g#M; v3=60 #M/min; K3= 1SM; h4=4; v5=240fM/min; K5= 0.01 pM; K; = 1.5 /UM; h6 = 2; K7 = 0.5 ,tM; h7 = 4; v8 = 60 /SM/min; K8 = 0.6 jeM; h8 = 2. All the other Hill coefficients (he) are equal to 1. The rate of IP3 production was set to three different stimulated levels (a-c) during the indicated period. (d) Frequency and amplitude of the Ca2+ oscillations as functions of v,. (e) Simulation of the ISP3 action in the basal condition (v, = 0.36 ,uM/min), assuming that ISP3 (0.6 #M) activates the Ca2+ channel with the same ED50 as 1P3. (J) Same as (e), except that ISP3 does not activate the Ca"+ channel, but completely inhibits the 5-phosphatase (v2 = O ,uM/min).
v,
(a)
=
V1
8 pM/min
=
8 M/min
v,
(b)
=
8 pM/min
V,
=
8 pM/min 1.2 1.0
(d)
0.8 0.6 0.4 0.2 0
0 +4
1 min
Fig. 3. OsciDlatory patterns of cytosolic Ca2" obtained with the model defined by eqns. (1) and (3") The kinetic equations were numerically integrated (fourth-order Runge-Kutta method with a step size of 0.0001 min) using the following parameter values: [Ca2+]tJt = 1 /M, basal v, = 1 /SM/min; v2 = 75 /LM/min; K2 = 25/SM; V3 = 500 /M/min; K3 = /S M; K4 = 1/SM; h4= 4; v5= 1200 M/min; K5 = 0.01 #M; K6= 2.5/M; h6 = 2; K7= 0.5 ,M; h7= 4; v8 = 300 /sM/min; K8 = 0.5/,M; h8 = 2; vg = 7.5/M/min; Kg = 5/,M; Klo = 10 /tM; hlo = 2; blo = 0.1. All the other Hill coefficients (h;) are equal to 1. (a) The rate of IP3 production was set to 8 /M/min during the indicated period. (b-d) Same as (a), except that [Ca2,LJO = 0.9 /M (b), [Ca2+]1t0 = 1.2 /SM (c), and blo = 1 (d).
without enlargement of the peak can be obtained if the activation of 3-kinase by the calcium-calmodulin complex is positively cooperative. Finally, the basal concentration of Ca2+ is more easily controlled if the activity of the ATP-driven pump exhibits positive co-operativity, as experimentally observed in sarcoplasmicreticulum vesicles (Inesi et al., 1980). Positive co-operativity has been simultaneously introduced in reactions 4, 6, 7 and 8 of the model (Scheme 1). The increase of v1 within the range of values for which Ca2+ oscillations are observed leads to a marked increase of frequency and to moderate changes of amplitude (Figs. 2a-d). Fig. 2 also shows 1P3 oscillations, which occur because of the cross-coupling between Ca2+ and IP3. Wakui et al. (1989) recently reported that the injection of the non-metabolizable IP3 analogue inositol trisphosphothioate (ISP3) in a single cell may evoke regular spikes of Ca2+, suggesting that Ca2+ oscillation does not depend on fluctuations in lP3 concentration. However, this interpretation does not consider the possibility that, although the concentration of ISP3 is constant, endogenous Vol. 271
IP3 may accumulate and oscillate because ISP3 is a potent inhibitor of 5-phosphatase (Cooke et al., 1989), but not of 3kinase (Taylor et al., 1989). This interpretation is supported by simulation results, showing the oscillatory patterns obtained in the presence of ISP3 and with a basal rate of IP3 production. In Fig. 2(e), ISP3 was assumed to activate the Ca2+ channel without any significant inhibition of 5-phosphatase, whereas, in Fig. 2(J), ISP3 was not capable of activating the Ca2+ channel but was considered as a full inhibitor of the 5-phosphatase. Recently, Hill & Boynton (1990) showed that the rate of Ca2+ sequestration in 'P3-sensitive stores is stimulated by 'P4. This control is introduced in the model by replacing eqn. (3') by: d[Ca2
] =
v5f6/f7- v8 (f1o + blo)
(3")
where b1o is the IP4-independent contribution of the ATP-driven Ca2l pump. Fig. 3(a) shows that this model may generate a first
S. Swillens and D. Mercan
838 high transient Ca2+ peak followed by oscillations with smaller, but increasing, amplitudes. This is due to the delayed accumulation if IP4, allowing a first complete discharge of Ca2+ because of the low rate of Ca2` re-uptake. Such a pattern resembles the Ca2l oscillations induced by phenylephrine in hepatocytes (Kawanishi et al., 1989). Variability of intercellular oscillatory patterns have been tentatively simulated by varying some parameters of the model. A slight decrease (Fig. 3b) or increase (Fig. 3c) of the cellular Ca2+ content may cause obvious modifications in the Ca2+ response. Fig. 3(d) shows the pattern when the IP4independent activity of the Ca2+ pump is increased. DISCUSSION So far, only two models have been demonstrated to contain a cytosolic Ca2+ oscillator. In the model of Meyer & Stryer (1988), Ca2+ oscillations are essentially the consequence of PIC activation by free Ca2+ and of the existence of an infinite Ca2+ reservoir insensitive to IP3. However, numerical simulations may show that the baseline of the Ca2+ spikes is lower than the basal Ca2+ concentration obtained in the absence of extracellular stimulus. Moreover, above a certain stimulation level, the oscillations merge into a stationary state equal to the basal level. Thus very low and very high stimulation levels lead to identical stable Ca2+ concentrations, whereas for intermediate stimulation levels Ca2+ concentrations oscillate around the basal concentration. In this respect the model of Goldbeter et al. (1990) generates more realistic patterns of Ca2+ oscillations. The key feature of this latter model is the existence of an infinite extracellular Ca2+ reservoir and of a Ca2+-induced Ca2+ release from IP3-insensitive stores. Thus this model cannot describe those systems which exhibit Ca2+ oscillations in the absence of extracellular Ca2+ (Yule & Gallacher, 1988; Tsunoda et al., 1990). Interestingly, it seems that Ca2+ would have opposite actions on its release from stores sensitive or insensitive to IP3 respectively. As proposed in our model, the negative control of Ca2+ efflux from IP3-sensitive stores would be better explained by the inhibiting action of intravesicular Ca2+. This hypothesis seems to be also supported by the observed delayed action of Ca2+ injection in oocytes on IP3-induced membrane currents (Parker & Ivorra, 1990). This delay could be accounted for by the kinetics of Ca2+ uptake by
the vesicle. However, direct experimental evidence in favour of the proposed mode of Ca2+ action is still lacking. We thank Dr. J. E. Dumont for his support in this work. This work was performed under a contract with the Ministere de la Politique Scientifique (Sciences de la Vie: BIO/04).
REFERENCES Berridge, M. J. & Irvine, R. F. (1989) Nature (London) 341, 197-205 Berridge, M. J. & Galione, A. (1988) FASEB J. 2, 3074-3082 Cooke, A. M., Nahorski, S. R. & Potter, V. L. (1989) FEBS Lett. 242, 373-377
Goldbeter, A., Dupont, G. & Berridge, M. J. (1990) Proc. Natl. Acad. Sci. U.S.A. 87, 1461-1465 Hill, T. D. & Boynton, A. L. (1990) J. Cell. Physiol. 142, 163-169 Inesi, G., Kurzmack, M., Coan, C. & Lewis, D. E. (1980) J. Biol. Chem. 255, 3025-3031 Joseph, S. K., Rice, H. L. & Williamson, J. R. (1989) Biochem. J. 258, 261-265 Kawanishi, T., Blank, L. M., Harootunian, A. T., Smith M. T. & Tsien, R. Y. (1989) J. Biol. Chem. 264, 12859-12866 Meyer, T. & Stryer, L. (1988) Proc. Natl. Acad. Sci. U.S.A. 85, 5051-5055 Meyer, T., Wensel, T. & Stryer, L. (1990) Biochemistry 29, 32-37 Osipchuk, Y. V., Wakui, M., Yule, D. I., Gallacher, D. V. & Petersen, 0. H. (1990) EMBO J. 9, 697-704 Parker, I. & Ivorra, I. (1990) Proc. Natl. Acad. Sci. U.S.A. 87, 260-264 Rooney, T. A., Sass, E. J. & Thomas, A. P. (1989) J. Biol. Chem. 264, 17131-17141 Takazawa, K., Passareiro, H., Dumont, J. E. & Erneux, C. (1989) Biochem. J. 261, 483-488 Taylor, C. W., Berridge, M. J., Cooke, A. M. & Potter, B. V. L. (1989) Biochem. J. 259, 645-650 Tsunoda, Y., Stuenkel, E. L. & Williams, J. A. (1990) Am. J. Physiol. 258, C147-C155 Tyson, J. J. (1975) J. Chem. Phys. 62, 1010-1015 Wakui, M., Potter, B. V. L. & Petersen, 0. H. (1989) Nature (London) 399, 317-320 Willems, P. H. G. M., Van Den Broek, B. A. M., Van Os, C. H. & de Pont, J. J. H. H. M. (1989) J. Biol. Chem. 264, 9762-9767 Willems, P. H. G. M., De Jong, M. D., de Pont, J. J. H. H. M. & Van Os, C. H. (1990) Biochem. J. 265, 681-687 Woods, N. M., Cuthbertson, K. S. R. & Cobbold, P. H. (1986) Nature (London) 319, 600-602 Yule, D. I. & Gallacher, D. V. (1988) FEBS Lett. 239, 358-362
Received 12 July 1990/17 August 1990; accepted 30 August 1990
1990